
How does an analysis work in K-Stra?
Where, What, then a price you accept or not. The same three moves for a 10-minute drive or a whole state.
An analysis in K-Stra takes two steps and a confirmation. In Where you pick the area: an address with travel-time or distance bands, drawn polygons or up to 12 administrative areas. In What you choose one module and its indicators. Evaluate & decide then shows the exact price, and nothing runs or is charged until you confirm.
How do you choose the area of an analysis?
Where has three tabs, and the area is the one in the tab you used last. For bands and polygons K-Stra counts residents on the address points inside them, so no postcode is ever cut in proportion.
| Tab | The area is | Options |
|---|---|---|
| Location | One address, typed or clicked on the map, with bands around it | Time or distance; car, car avoiding motorways or on foot; average or heavy traffic; a straight-line radius with distance. 1 to 6 bands, up to 120 minutes or 30 km. |
| Drawn area | Polygons you draw yourself, as many as the question needs | Up to 10 polygons and 5,000 vertices in all. Each one can be renamed and reshaped, and shows its surface in km². |
| Administrative | Official areas picked from a search, from the map or from a list | States, SA4 regions, councils, postcodes and suburbs, mixed if needed, up to 12 at once, with their residents shown as you pick. |
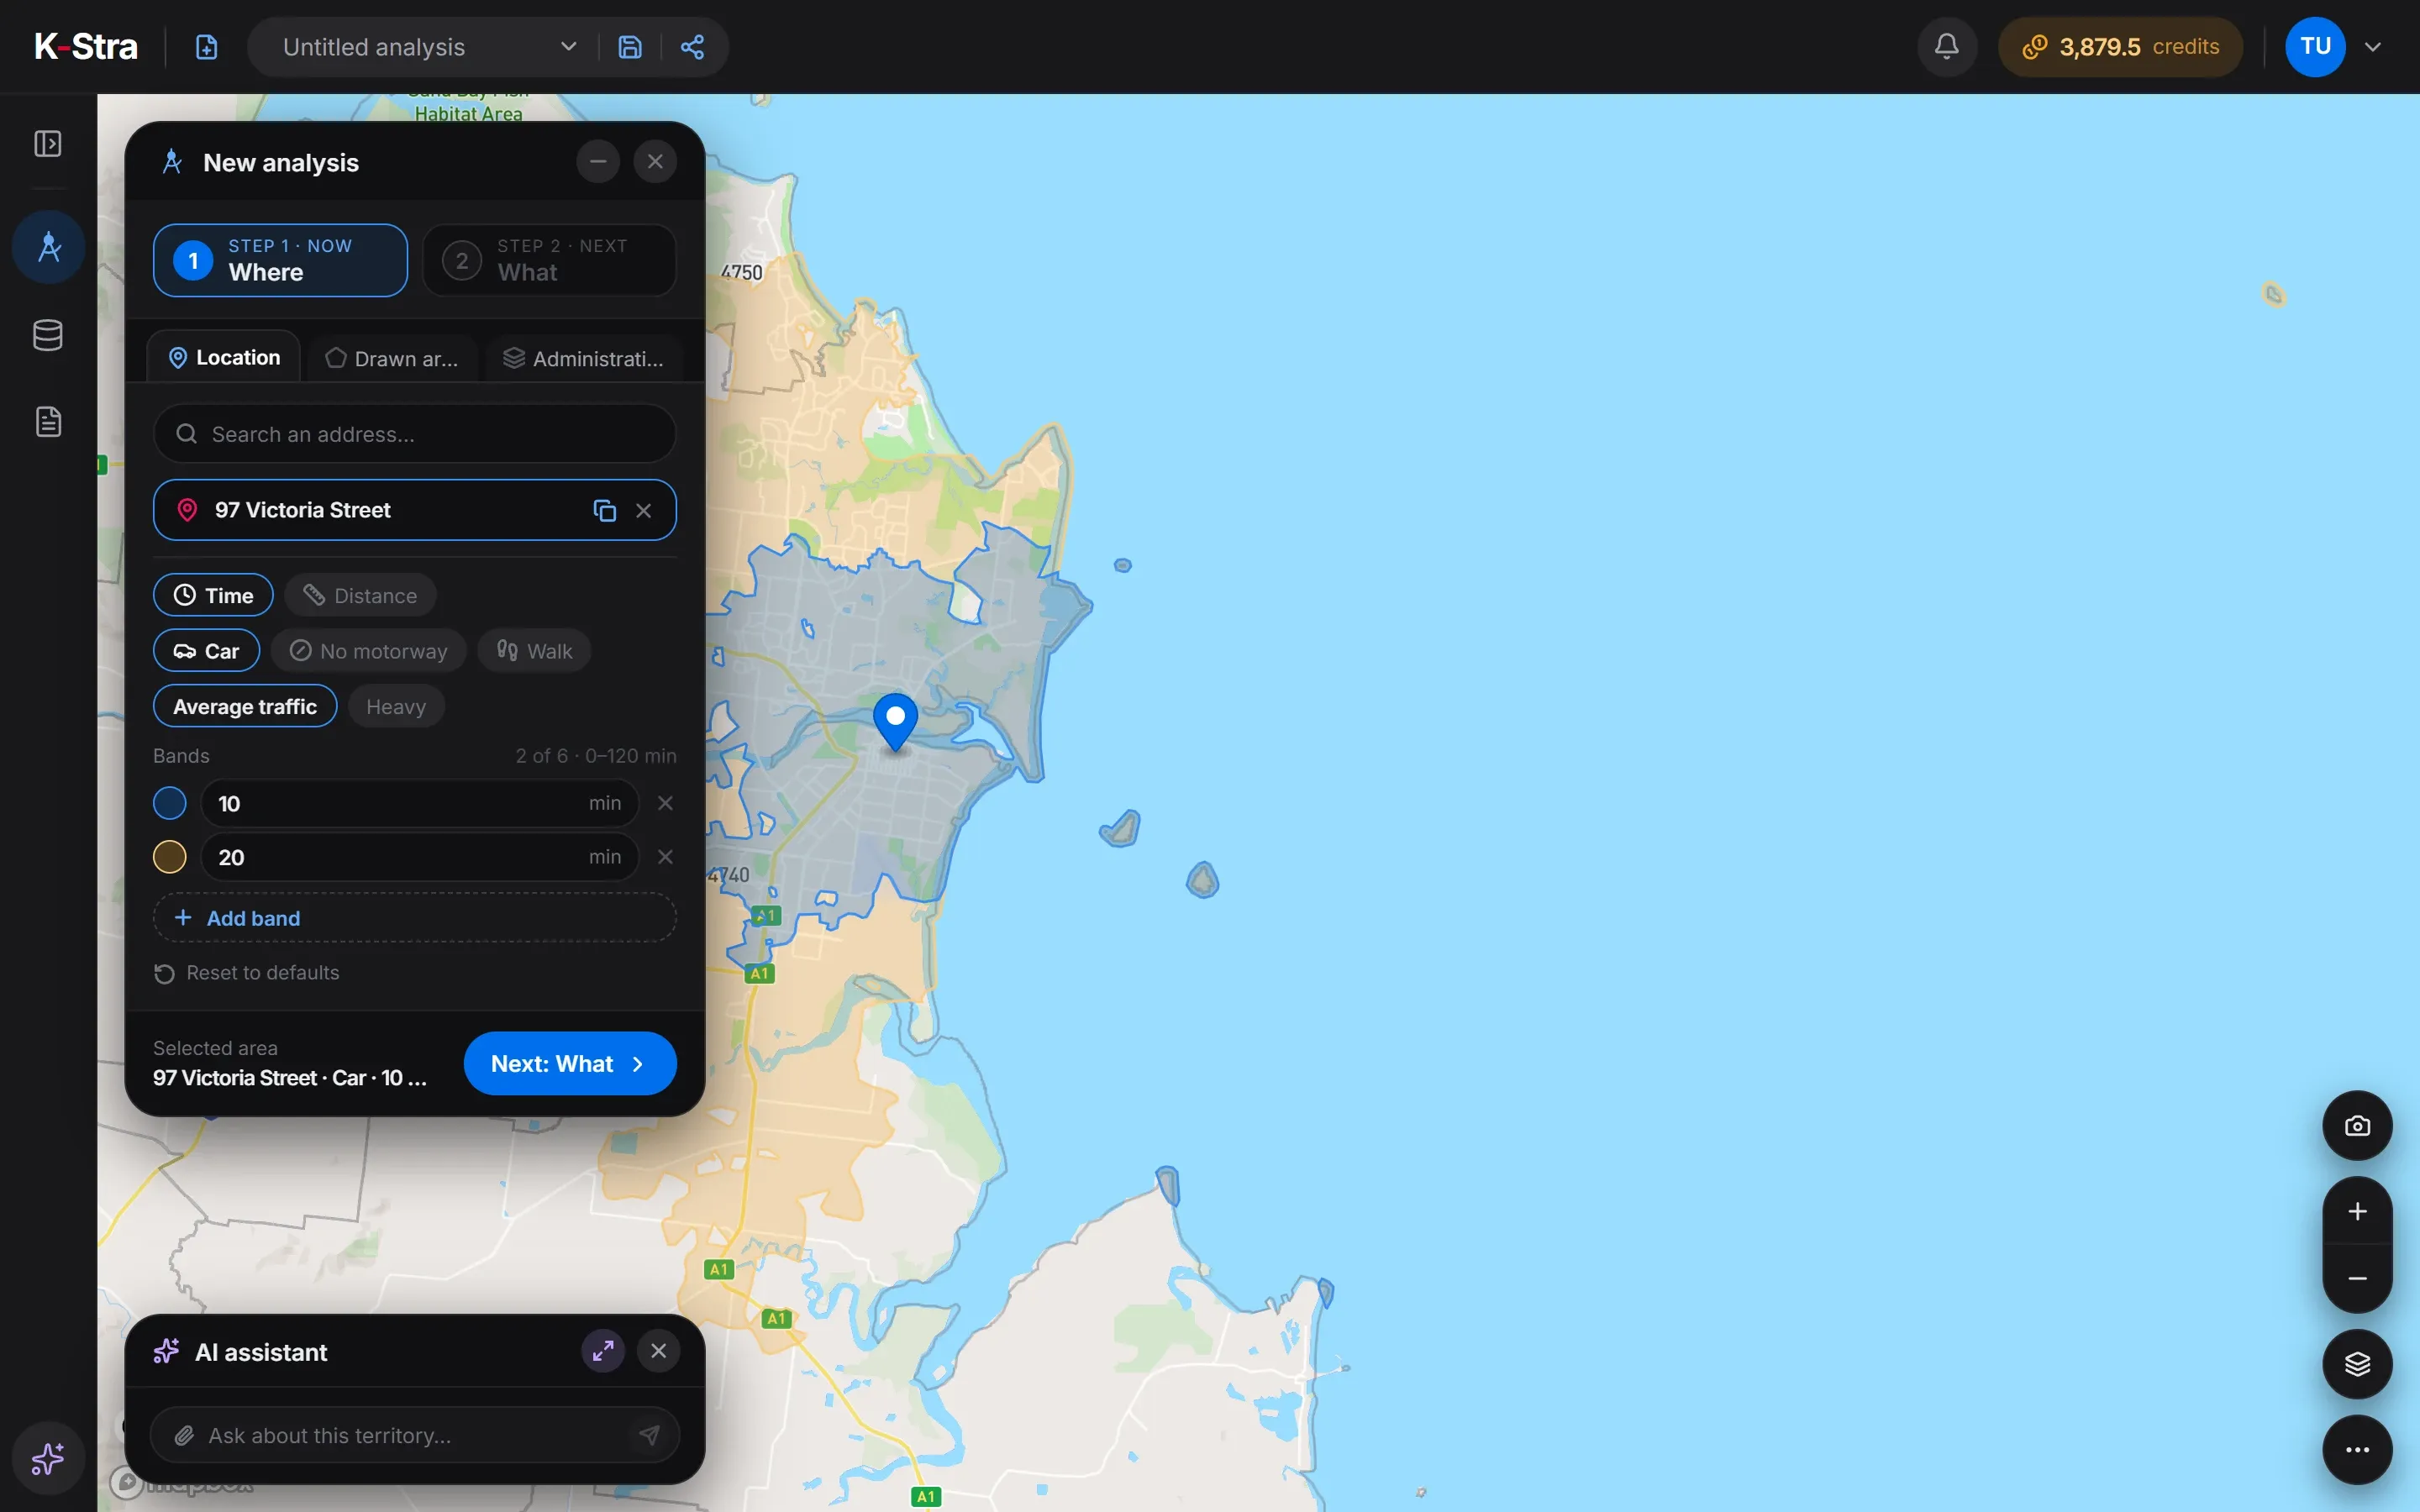 Where · Mackay
Which modules can an analysis use?
One module per run. After the run you can choose another module on the same area, and each run is priced on its own.
| Module | What it needs | Credits |
|---|---|---|
| People & Economy | Only the area | 2 credits per topic, all 10 for 20 |
| Markets & Brands | The area and a sector, or up to 10 brands | 40 credits per sector, 5 per brand |
| Real Estate | The area, sale or rent, property types and period | 20 credits per analysis |
| Customer Loyalty | A loyalty-card file in My Data | 20 credits per store analysed |
| Sales | A file of sales reps, with clients and prospects if you have them; no area | 5 credits per sales rep |
| Traffic & Footfall | The area, vehicles or pedestrians, and a day or hours if you want | 30 credits per area; other periods on it are free |
Before anything runs, the What you will get panel lists every table the selection will produce, with its rows: per band, per council, per postcode. Switching indicators on and off changes the list and the price, and costs nothing.
How does each module work, in under a minute?
The same narrated videos the app opens from Watch how it works, each on an example in the app. Sales and Customer Loyalty use sample data, because they work on your own files.
Transcript
Markets & Brands shows who sells what around a place, and how much room is left. Pick an address and its catchment — here, a ten-minute walk from Smith Street, Collingwood — and choose a sector: fast food. You see the residents' yearly spending on fast food within reach, and how hard the outlets already there compete for it. The map shades every block by potential spend captured — the residents' spending a new outlet could win there — and lists the best addresses. Following particular chains instead? Pick up to ten brands and count their stores in each band, and per resident. Exploring and setting up are free. You only spend credits when you run the analysis.
Transcript
People & Economy tells you who lives around a place — how many, how old, what they earn and what they spend. Pick an address and its catchment — here, five and ten minutes by car from Cronulla Street, Cronulla — then switch on the topics you need. Residents and families, age, people born overseas, education: every figure is built on official statistics, band by band and postcode by postcode. Then jobs, income and yearly spending by category, and homes owned or rented — and, with one switch, how the area compares with its suburb, council area, state and Australia. Exploring and setting up are free. You only spend credits when you run the analysis.
Transcript
Real Estate reads the property market of an area from its listings: asking prices and rents, and which way they are moving. Choose the area — here, three postcodes in the centre of the Gold Coast — then homes or commercial property, sale, rent or both, and the quarters to read. You get the median asking price and the price per square metre, postcode by postcode, the trend by quarter, how many listings sold and how many cut their price. Where there are rentals, rents and gross yield too. For a single address, One property gives an estimated range from comparable listings — market evidence, not a valuation. Exploring and setting up are free. You only spend credits when you run the analysis.
Transcript
Traffic & Footfall shows how busy every road is: vehicles a day, and people on foot. Draw or pick an area — here, part of western Sydney with its motorways — and choose vehicles or pedestrians. Every road is coloured in one of seven bands of vehicles a day, estimated from trips on the road network and calibrated on official counts. Where a count was taken, the road is marked as measured. Pedestrians come in five grades, and you can pick a date, a range of days or the hours. One price per area: other days, hours and pedestrians on it cost nothing more. Exploring and setting up are free. You only spend credits when you run the analysis.
Transcript
Sales shows how your sales force covers the territory: who leads where, who overlaps, and what nobody follows yet. Load your sellers, your business clients and your prospects — here, a sample team of nine in Sydney. There is no area to draw: the postcodes they work in are the territory. For each postcode you see the leading seller, the clients shared between sellers, and the prospects nobody is following yet. Each seller gets a drive-time catchment, showing the residents reached by one seller, by several, or by nobody. Balanced territories then divides the area among your sellers, by clients or by residents. Exploring and setting up are free. You only spend credits when you run the analysis.
Transcript
Customer Loyalty shows where your customers come from, using the loyalty cards of your own stores. Load your card data: an anonymised card code, its store, what it spent and its postcode are enough — no names, no addresses. Here, a sample chain with three stores in Canberra. You see the store's card turnover postcode by postcode, how far its customers travel, and its share of the spending of the residents around it. And Wallet share shows how much of each card's spending stays in this store, and how much goes to your other stores. Exploring and setting up are free. You only spend credits when you run the analysis.
How do you know the price before you run?
Evaluate & decide opens a confirmation window with the area, the indicators, what you will get, the surface, the total cost and your balance after the run. Cancel costs nothing.
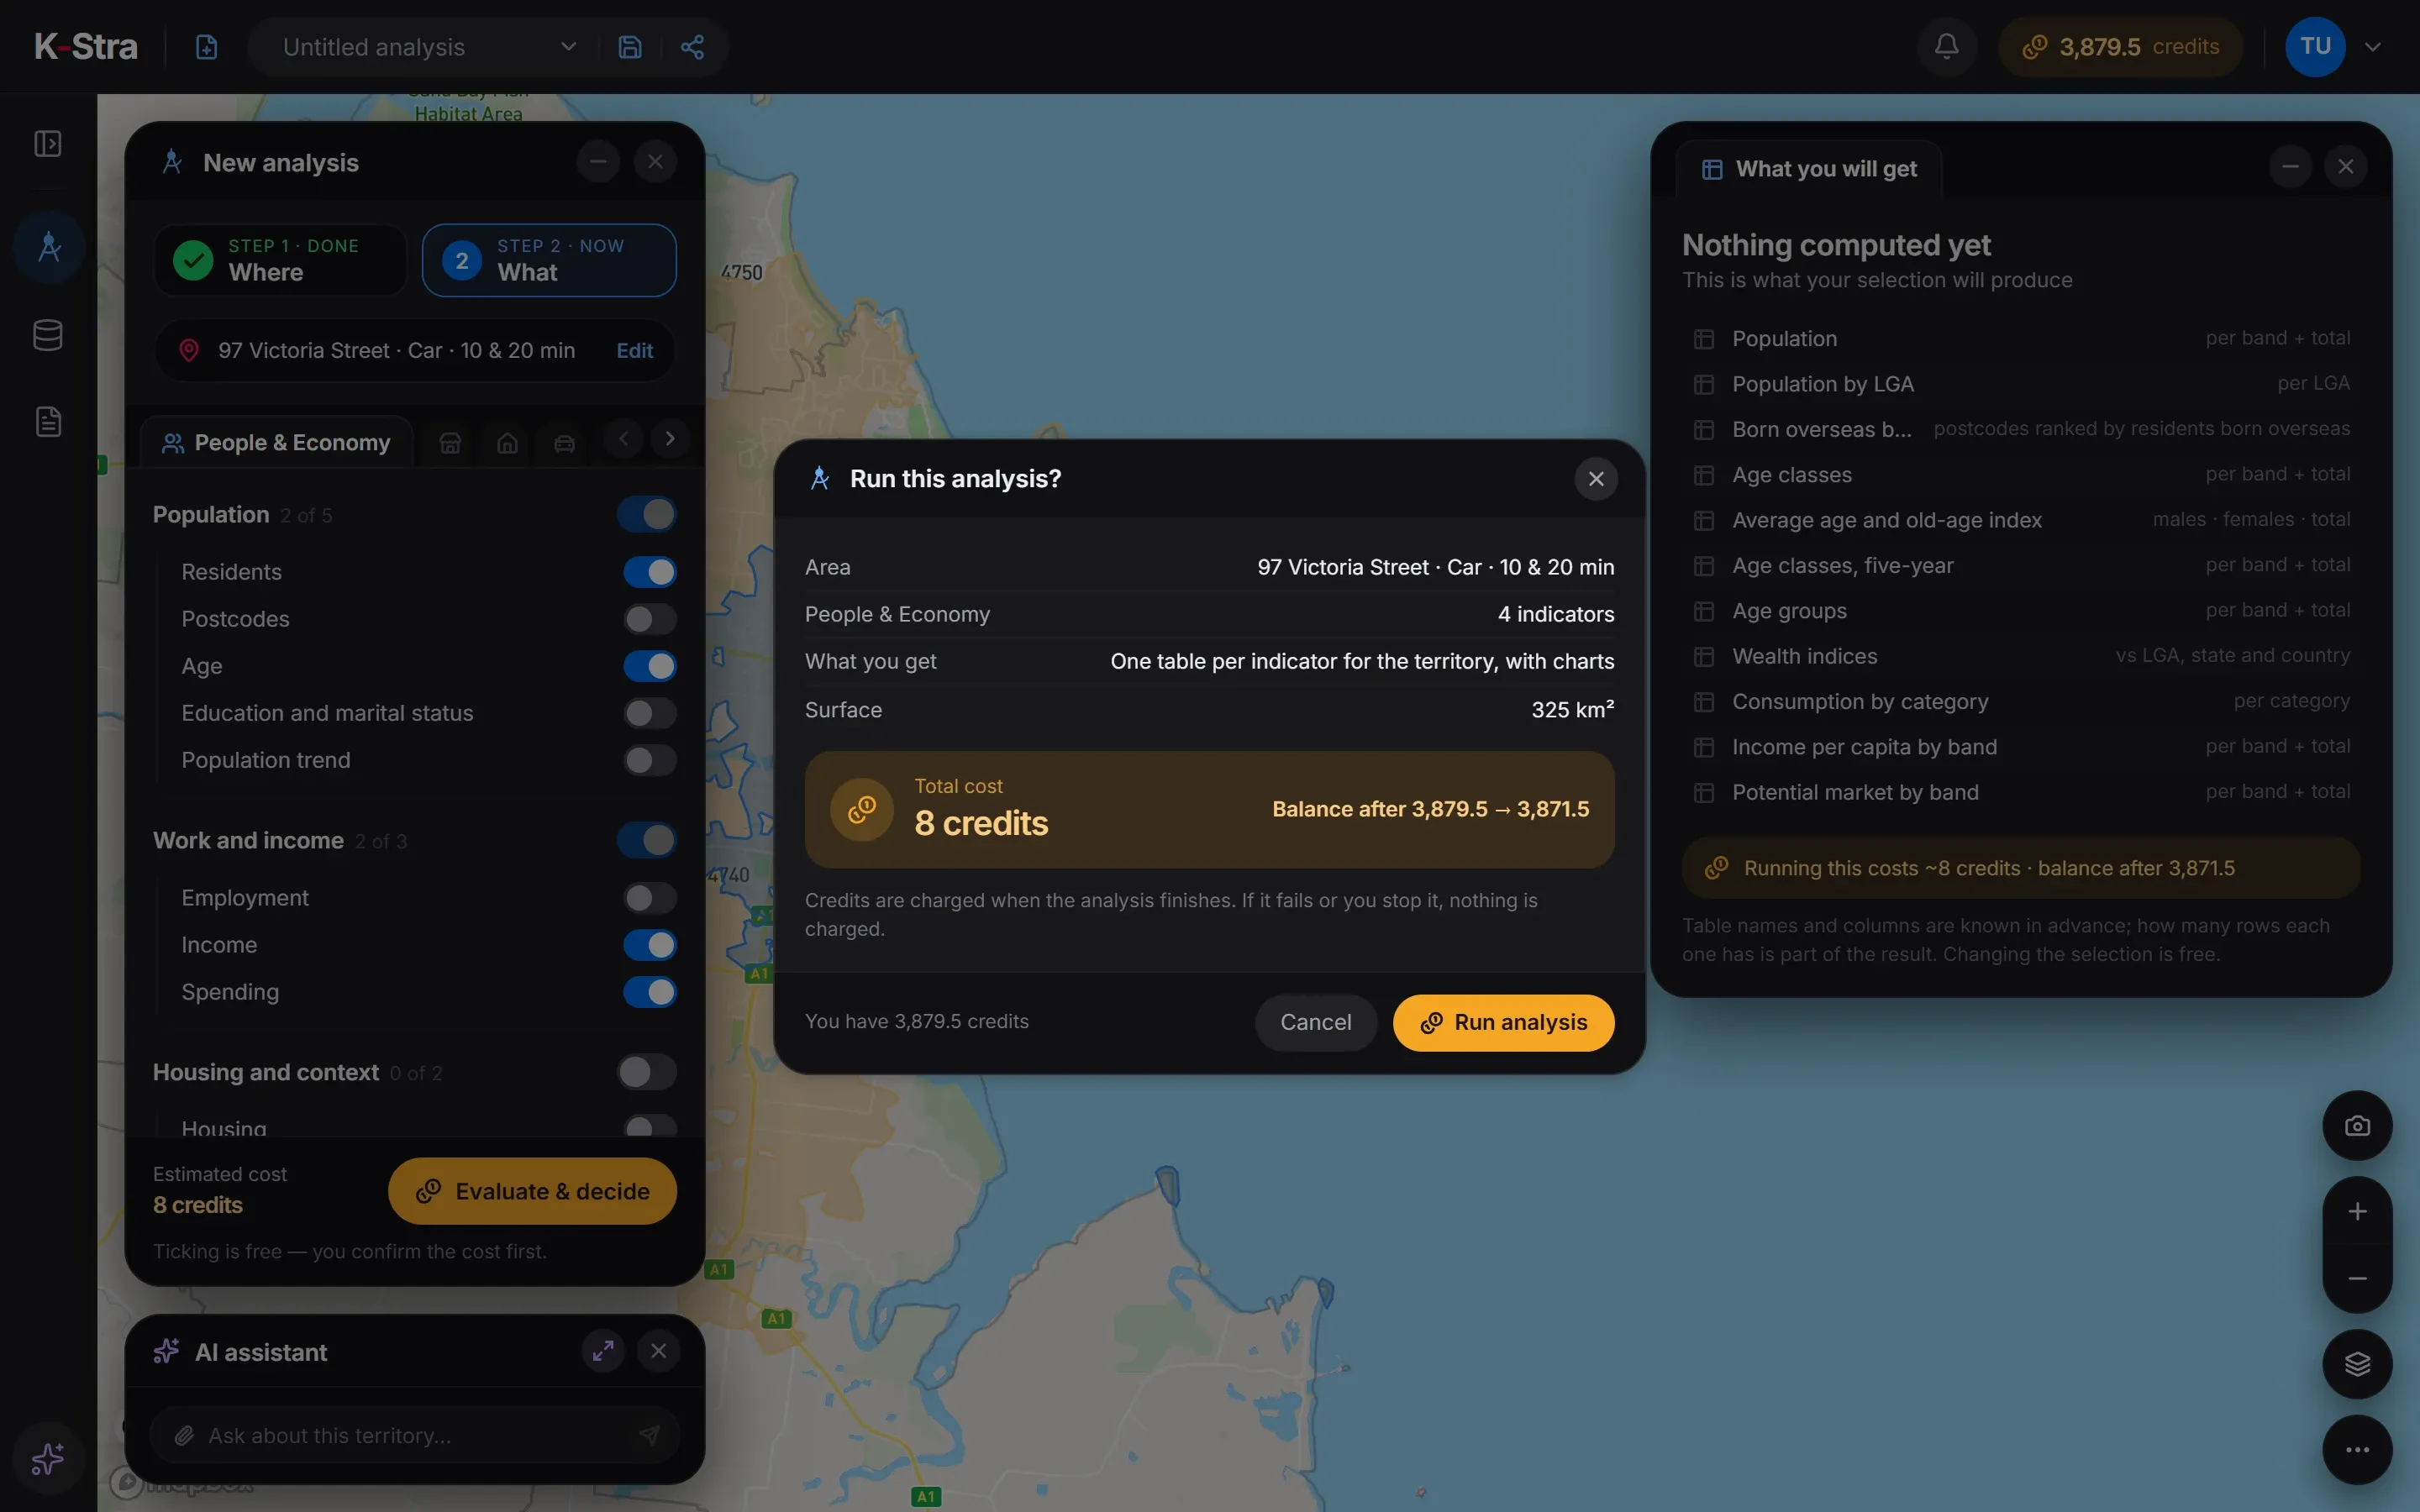 The price, before the run
Credits are reserved when the run starts and charged when it finishes. A run that fails, or one you stop, is released and costs nothing; Retry does not charge twice.
When the analysis is already saved, the same window asks where the results go: a new version of the analysis, or a new analysis next to it.
How credits workWhat does the result of an analysis look like?
4 topics of People & Economy within 10 and 20 minutes by car of 97 Victoria Street, Mackay QLD, run on 1 November 2026 for 8 credits. The result opens as tables with charts on the right and the bands on the map, each with its residents.
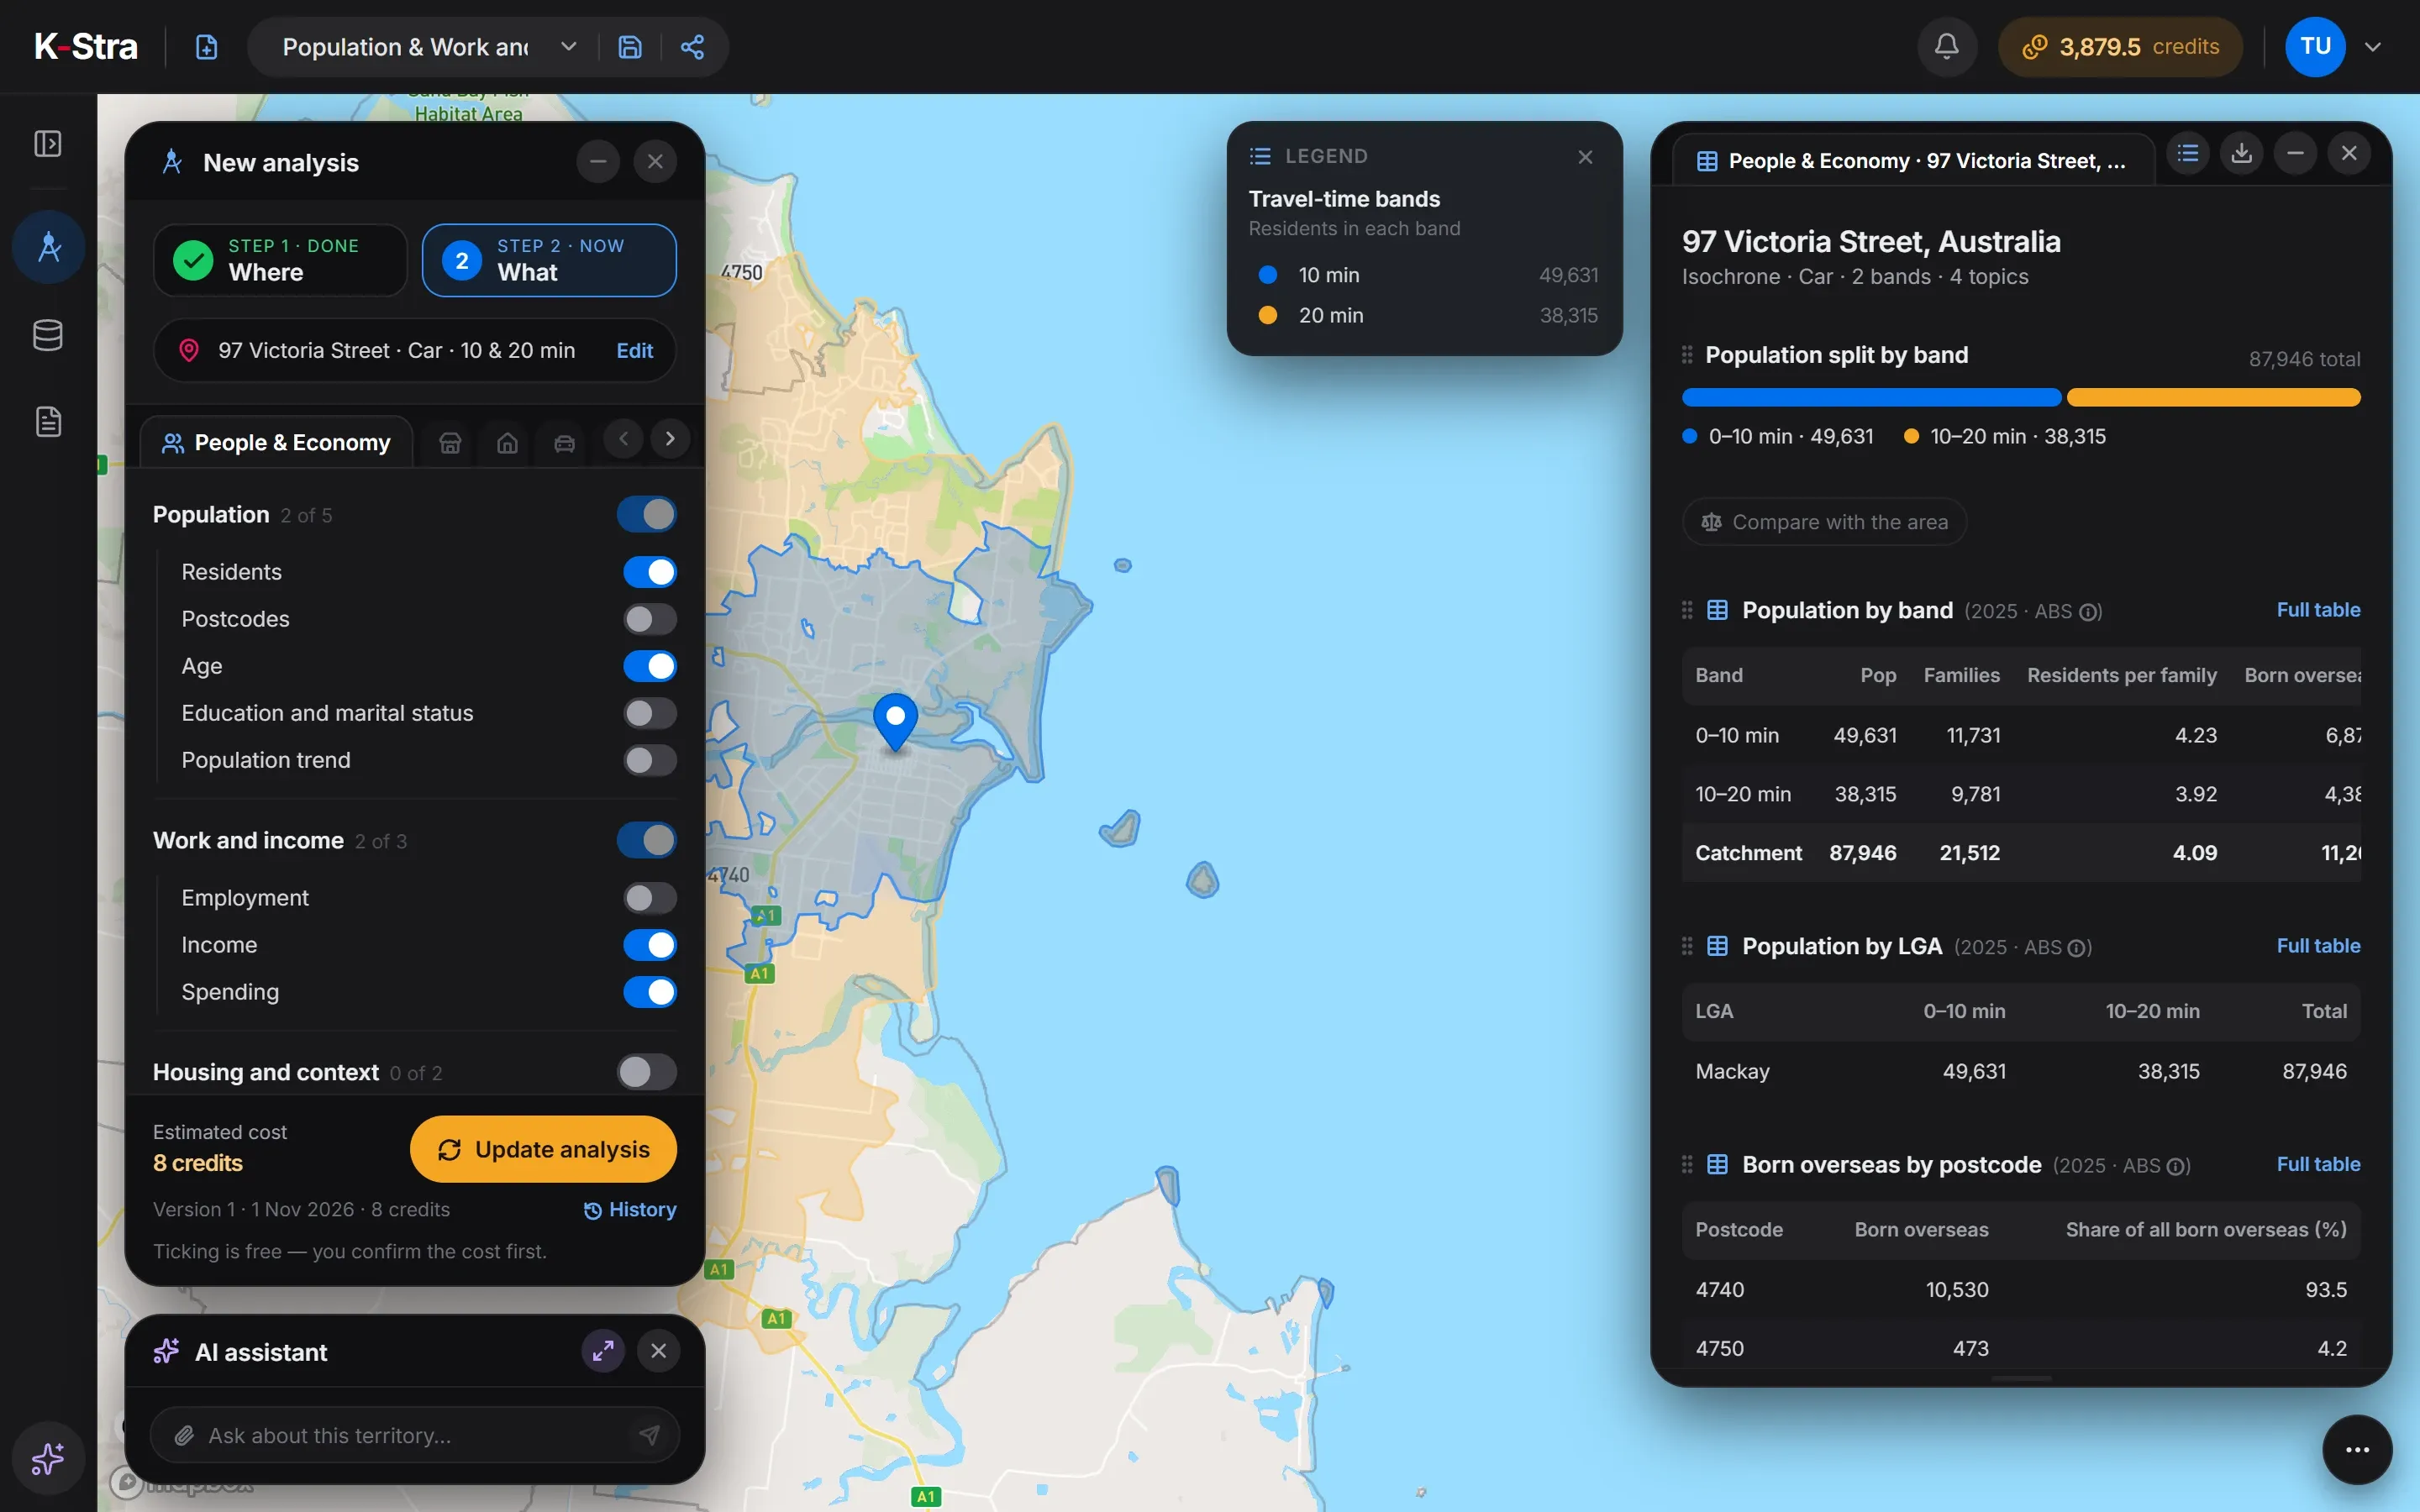 Result · Mackay
| Measure | Catchment | Note |
|---|---|---|
| Residents, 0–10 min | 49,631 | 11,731 families |
| Residents, 10–20 min | 38,315 | 9,781 families |
| Residents within 20 minutes | 87,946 | 21,512 families |
| Average age | 39.5 | years |
| Residents aged 65 and over | 16.9% | Australia 17.5% |
| Income index | 108.9 | Australia = 100 |
| Consumption per head | A$56,965 | A$52,583 in Australia, a year |
K-Stra analysis of 1 November 2026: 10 and 20 minutes by car in average traffic from 97 Victoria Street, Mackay. Residents, families and age: ABS Estimated Resident Population at 30 June 2025, spread onto addresses by K-Stra. Income and consumption indices: ABS, 2023.
What can you do with a result without spending more?
- Changing the area, the bands, the module or the indicators before you confirm.
- Opening every table in full, sorting, filtering and hiding columns.
- Comparing the catchment with its suburb, council, state and Australia.
- Exporting to PDF, Excel, CSV or KML, and saving map images.
- Reopening the analysis and any earlier version of it.
Bands of 5 and 10 minutes by car are drawn in about half a second, and 30 minutes in under three seconds. A coverage analysis of 100 stores in Sydney took under six seconds on the production server in Sydney.
Times measured by the K-Stra team in September 2026; they vary with the area and the load.
Questions about analyses
Do I pay for the size of the area?
No. The price depends on what you measure, such as the topics of People & Economy or the number of brands, never on the size of the area. A 10-minute drive and a whole state cost the same for the same indicators.
Can I run two modules on the same area?
Yes, one after the other. Each run is one module; when it ends you can pick another module on the same area without drawing it again, and each run is priced on its own.
What happens if an analysis fails?
Nothing is charged. Credits are reserved when the run starts and charged only when it finishes; a run that fails or that you stop is released, and Retry does not charge twice.
Can I change an analysis after it has run?
Yes. Change the indicators or the area and choose whether the new run updates the analysis as a new version or is saved as a new analysis. The new run is priced like any other.
Can the AI assistant set up an analysis for me?
Yes. Describe what you need and the assistant fills Where and What for free; an analysis that costs credits is shown with its price and runs only after your confirmation. Each answer costs 0.5 credits.
Draw the area.
See the price.
Drawing bands and reading the price are free. Sign up to run the analysis, with no card required.
Open the app — free to explore40 credits when you sign up · no card required