How do you get a location report written by AI and sent by email every month?
One sentence in, a location report out, and the same report in your inbox every month with the latest figures.
In short
In K-Stra a location report is built from real analyses: the AI writes it from a one-sentence request, a ready-made model fills it for one address, or you lay it out yourself. Exporting to PDF, PowerPoint or Excel is free, and any report can go out by email weekly, monthly or quarterly with refreshed figures.
What does a report written from one sentence look like?
This sample was made by K-Stra from a single request, with the same steps a customer takes. The consultancy on the cover, Tallowood & Hart, is invented; the figures are K-Stra’s, as of the day the report was made.
The request
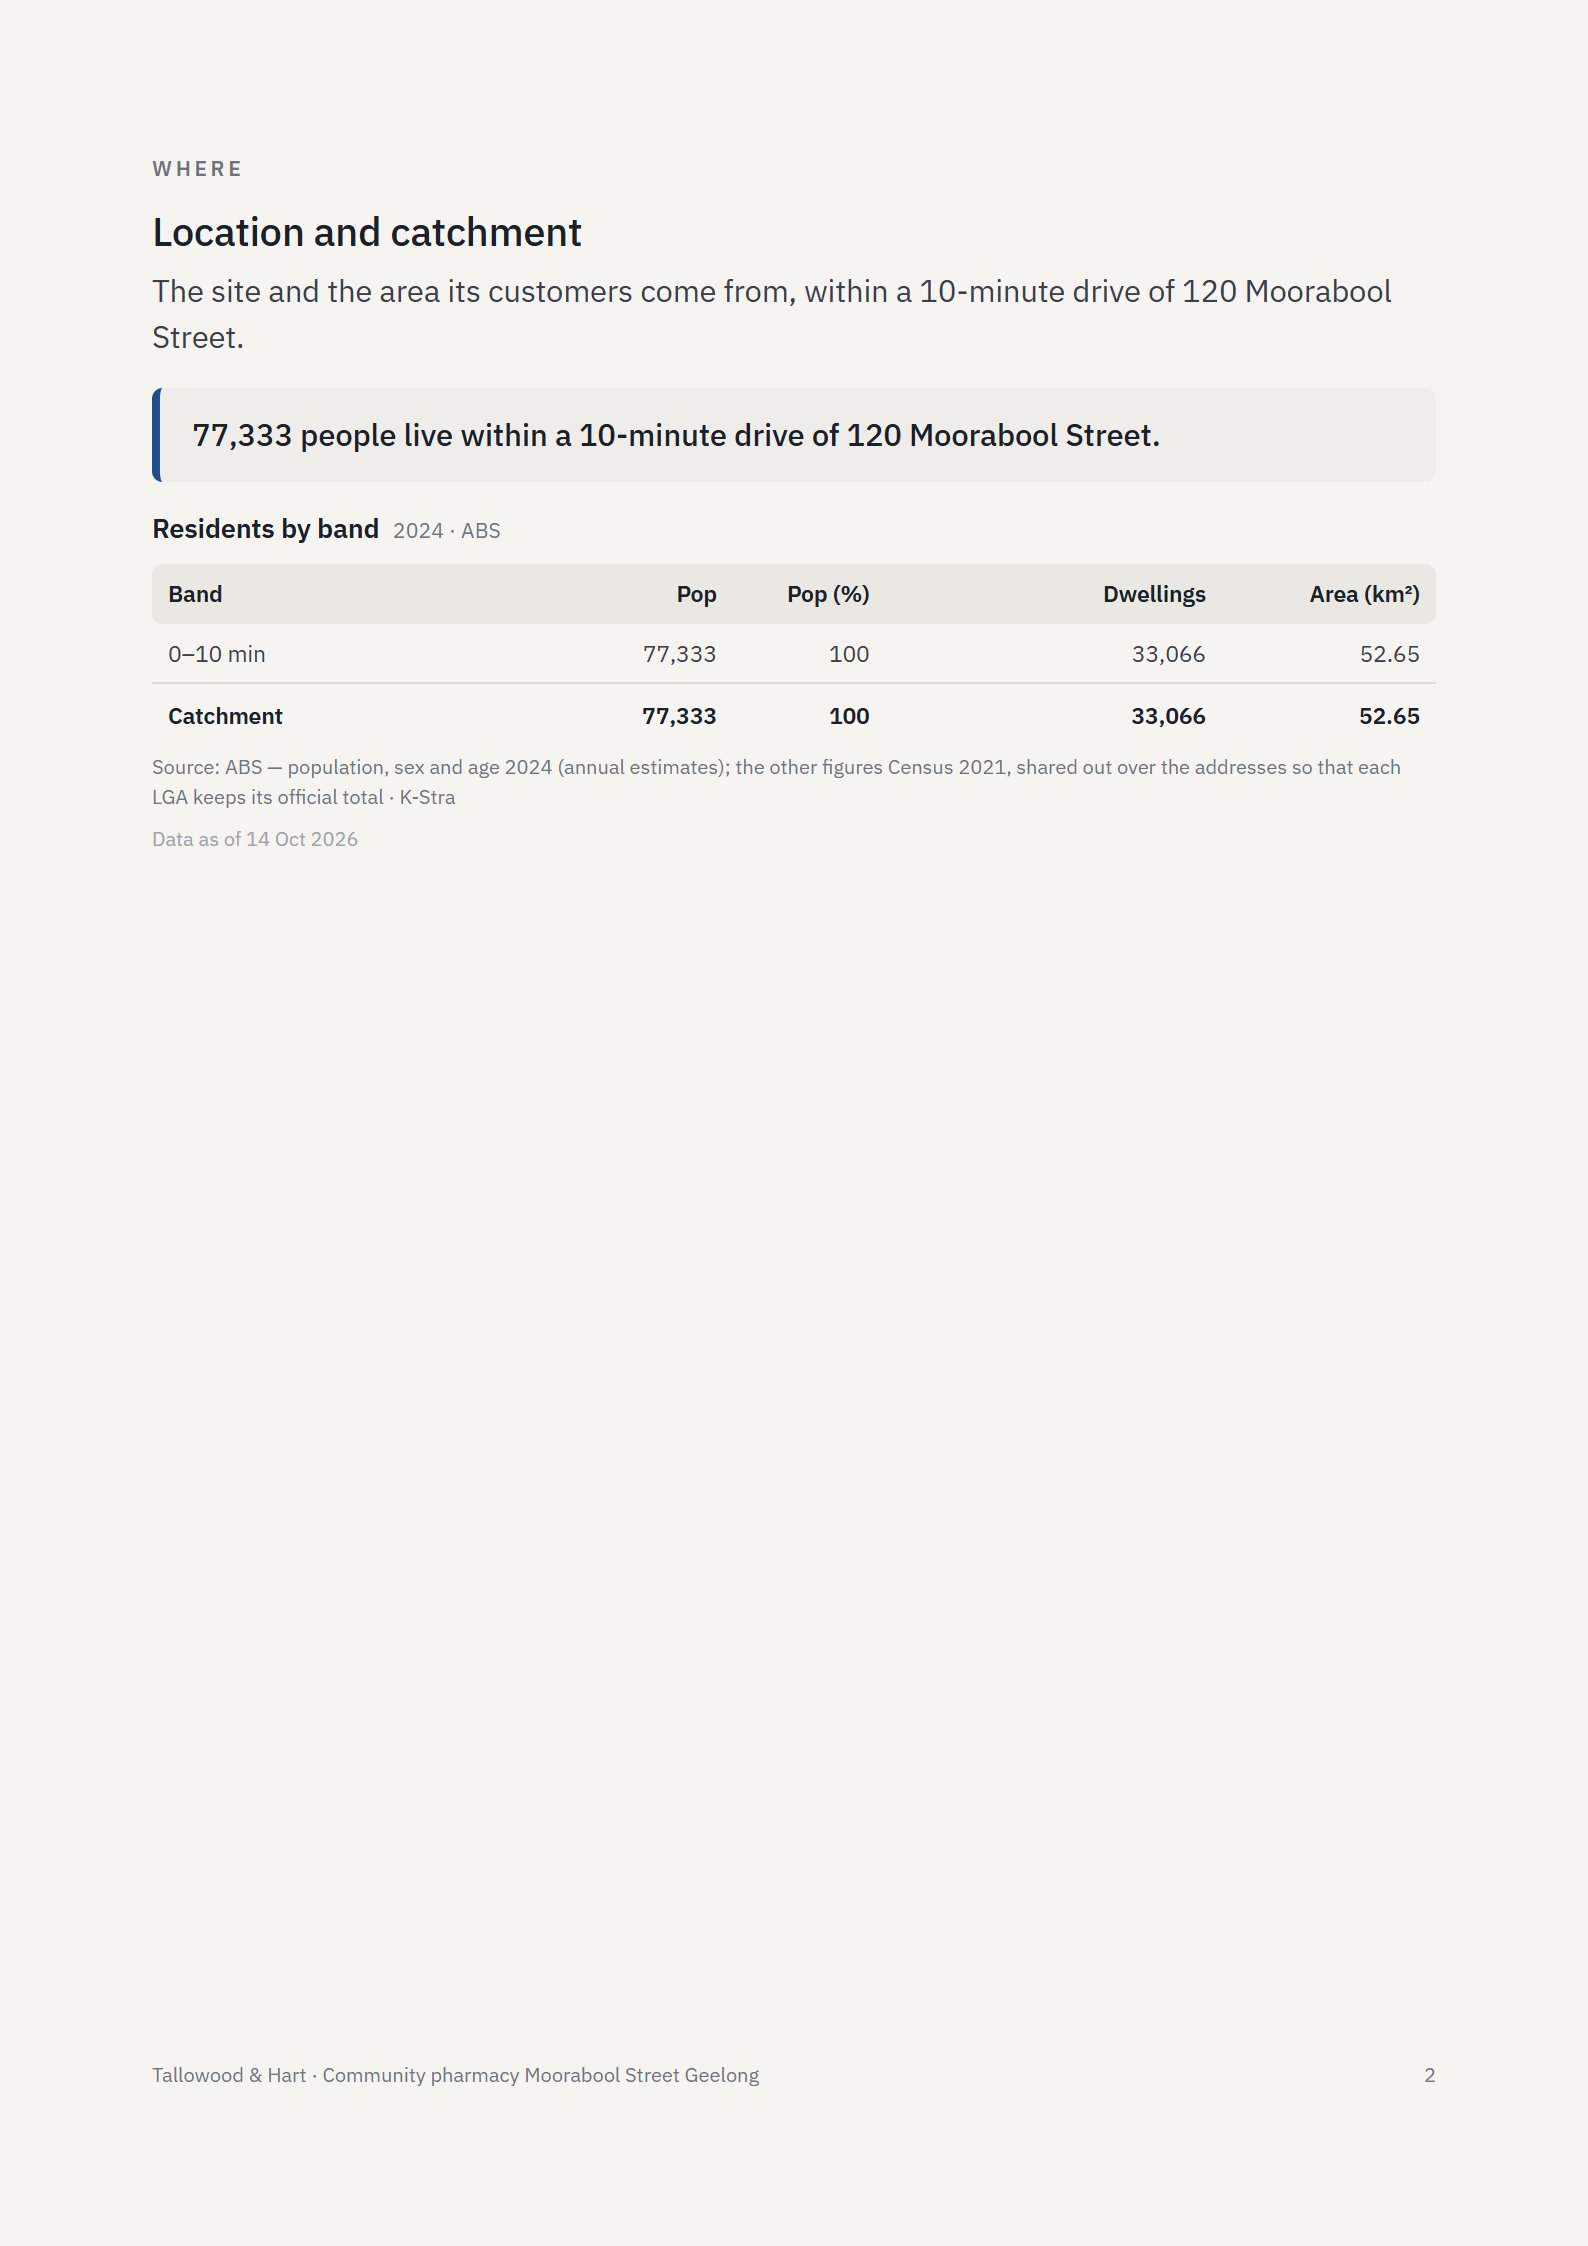
“A community pharmacy at 120 Moorabool Street, Geelong: who lives within 10 minutes by car, how much they spend on health, and which pharmacies are already there.”
From that sentence the AI chose a Location Report, a catchment of 10 minutes by car and the pharmacy sector, then wrote the summary on the first page and the conclusions at the end. 120 Moorabool Street, Geelong · 10 minutes by car.
Four more reports made by K-Stra at real Australian addresses, from the ready-made models. The consultancy on the cover is invented as above; the figures are K-Stra’s, as of the day each report was made.
Location Report · Basic
A café in Fitzroy
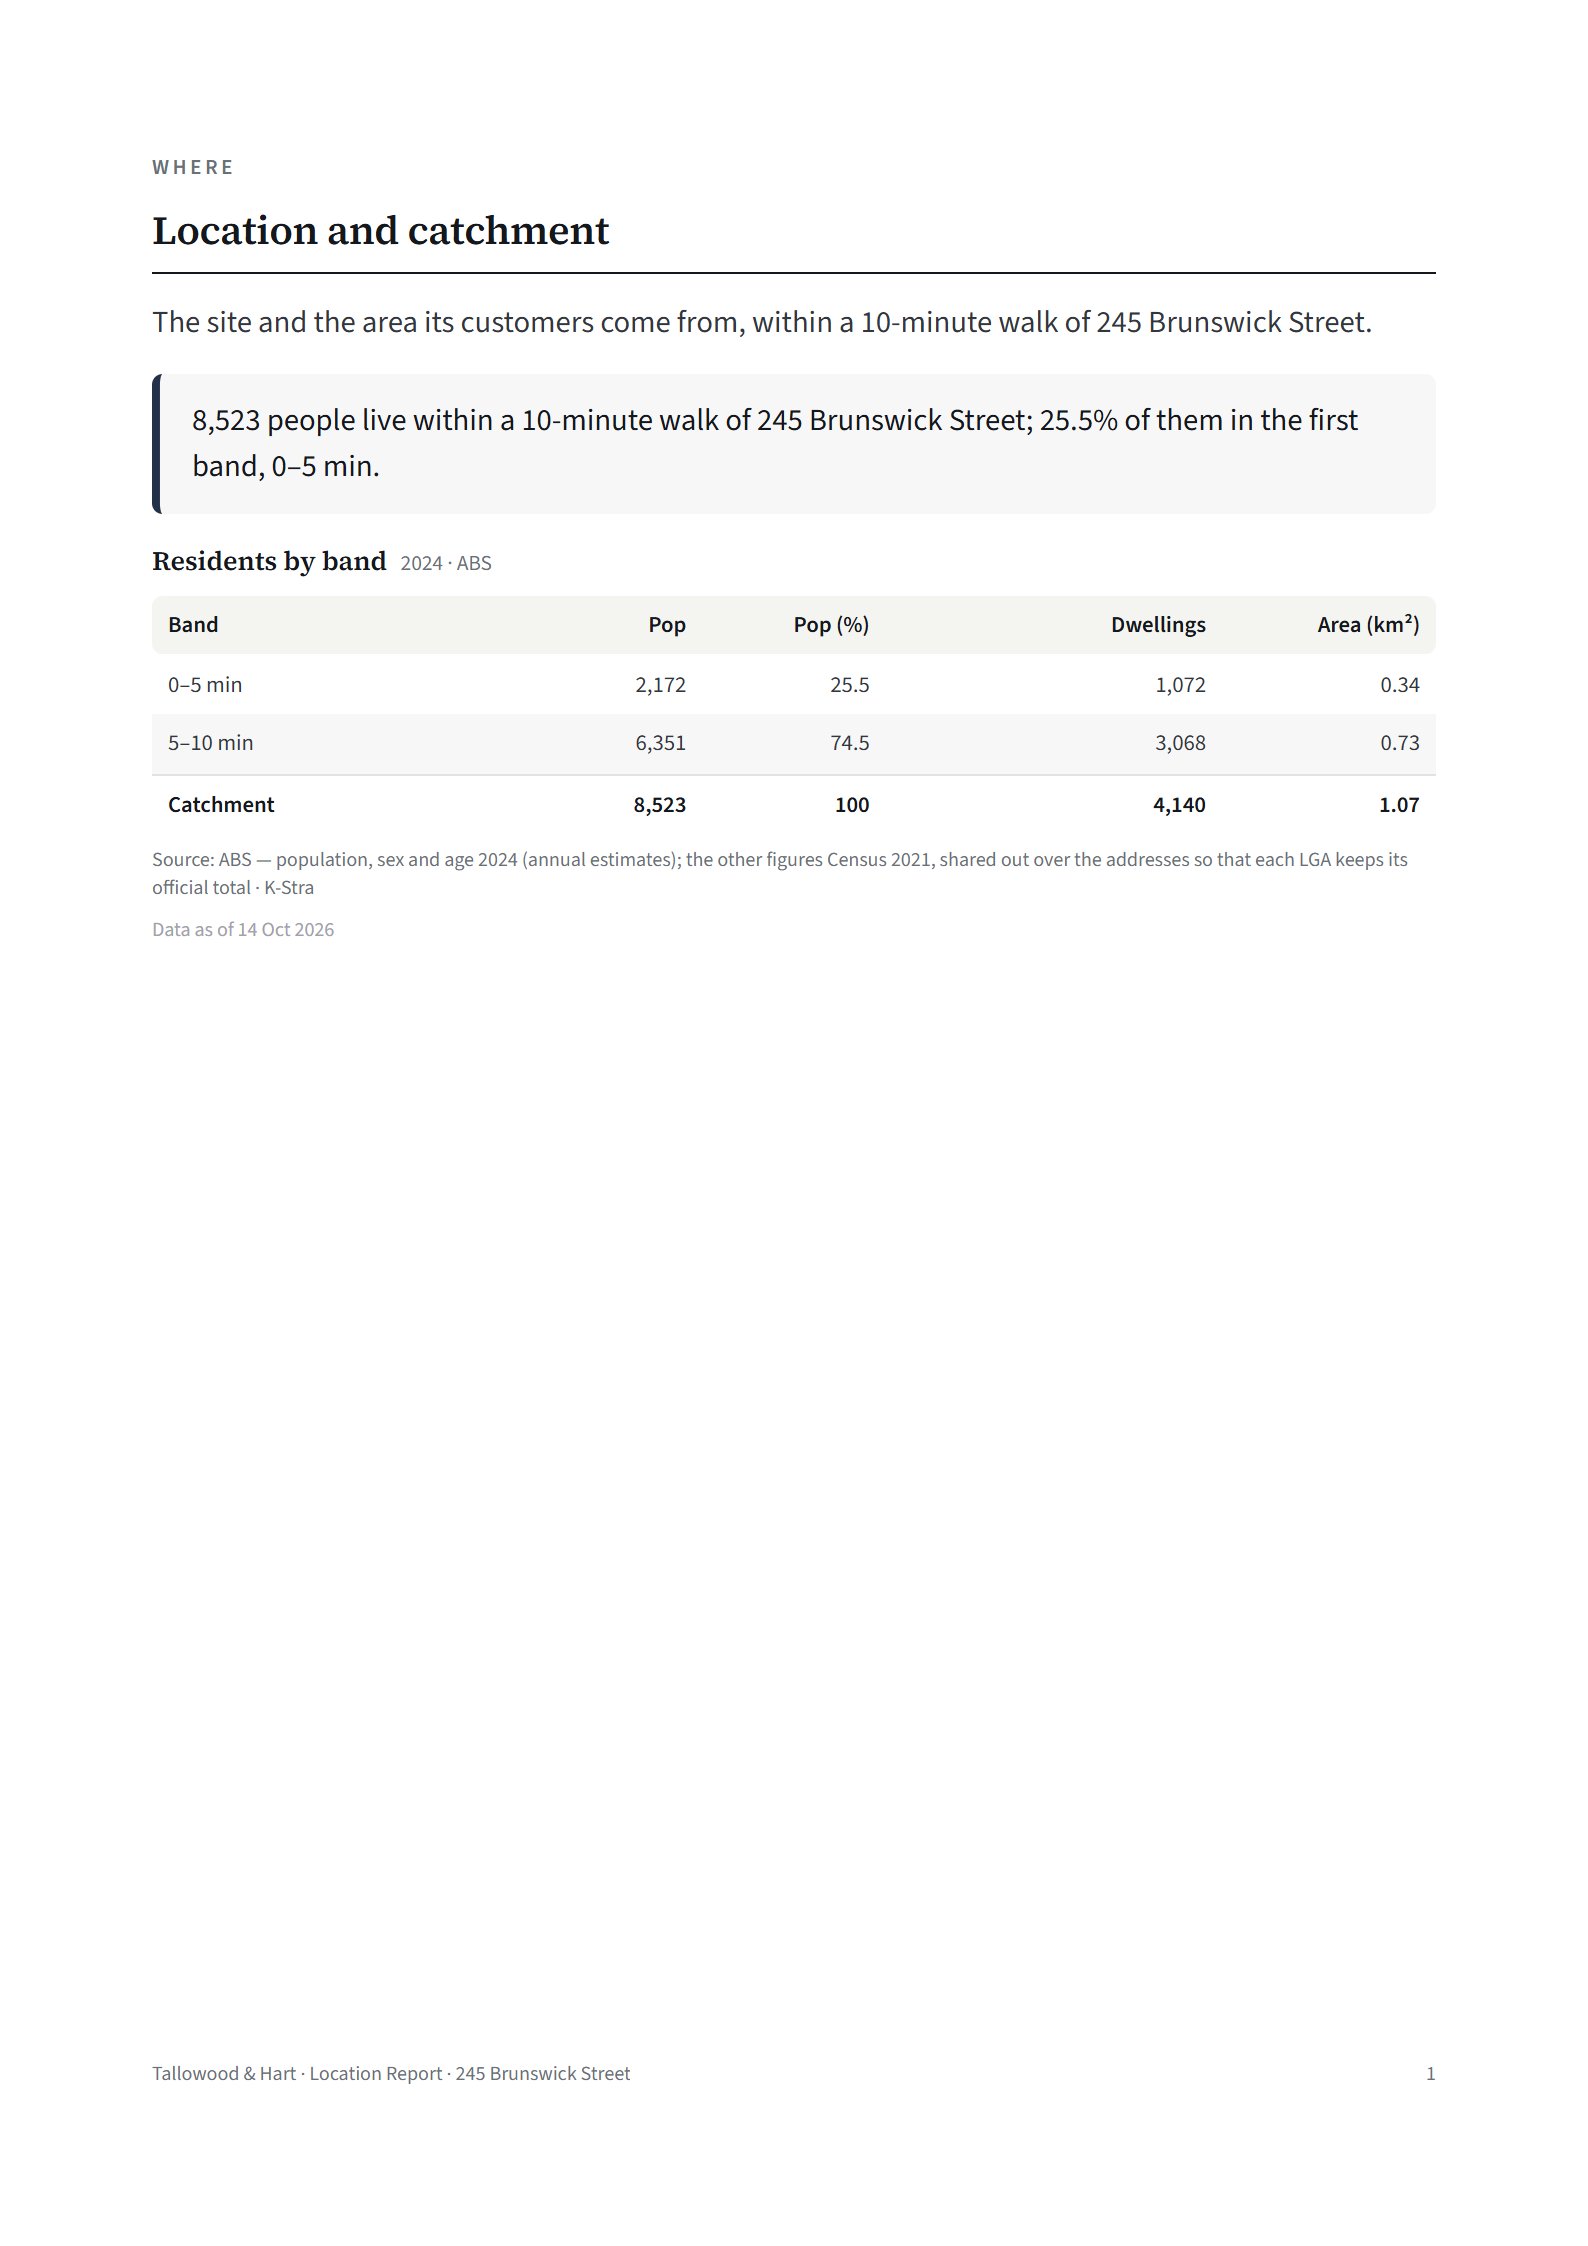
245 Brunswick Street, Fitzroy, Melbourne · 5 and 10 minutes on foot
Who lives within a short walk, how much they spend and how many cafés and bars already compete for them, with the conclusions written by AI.
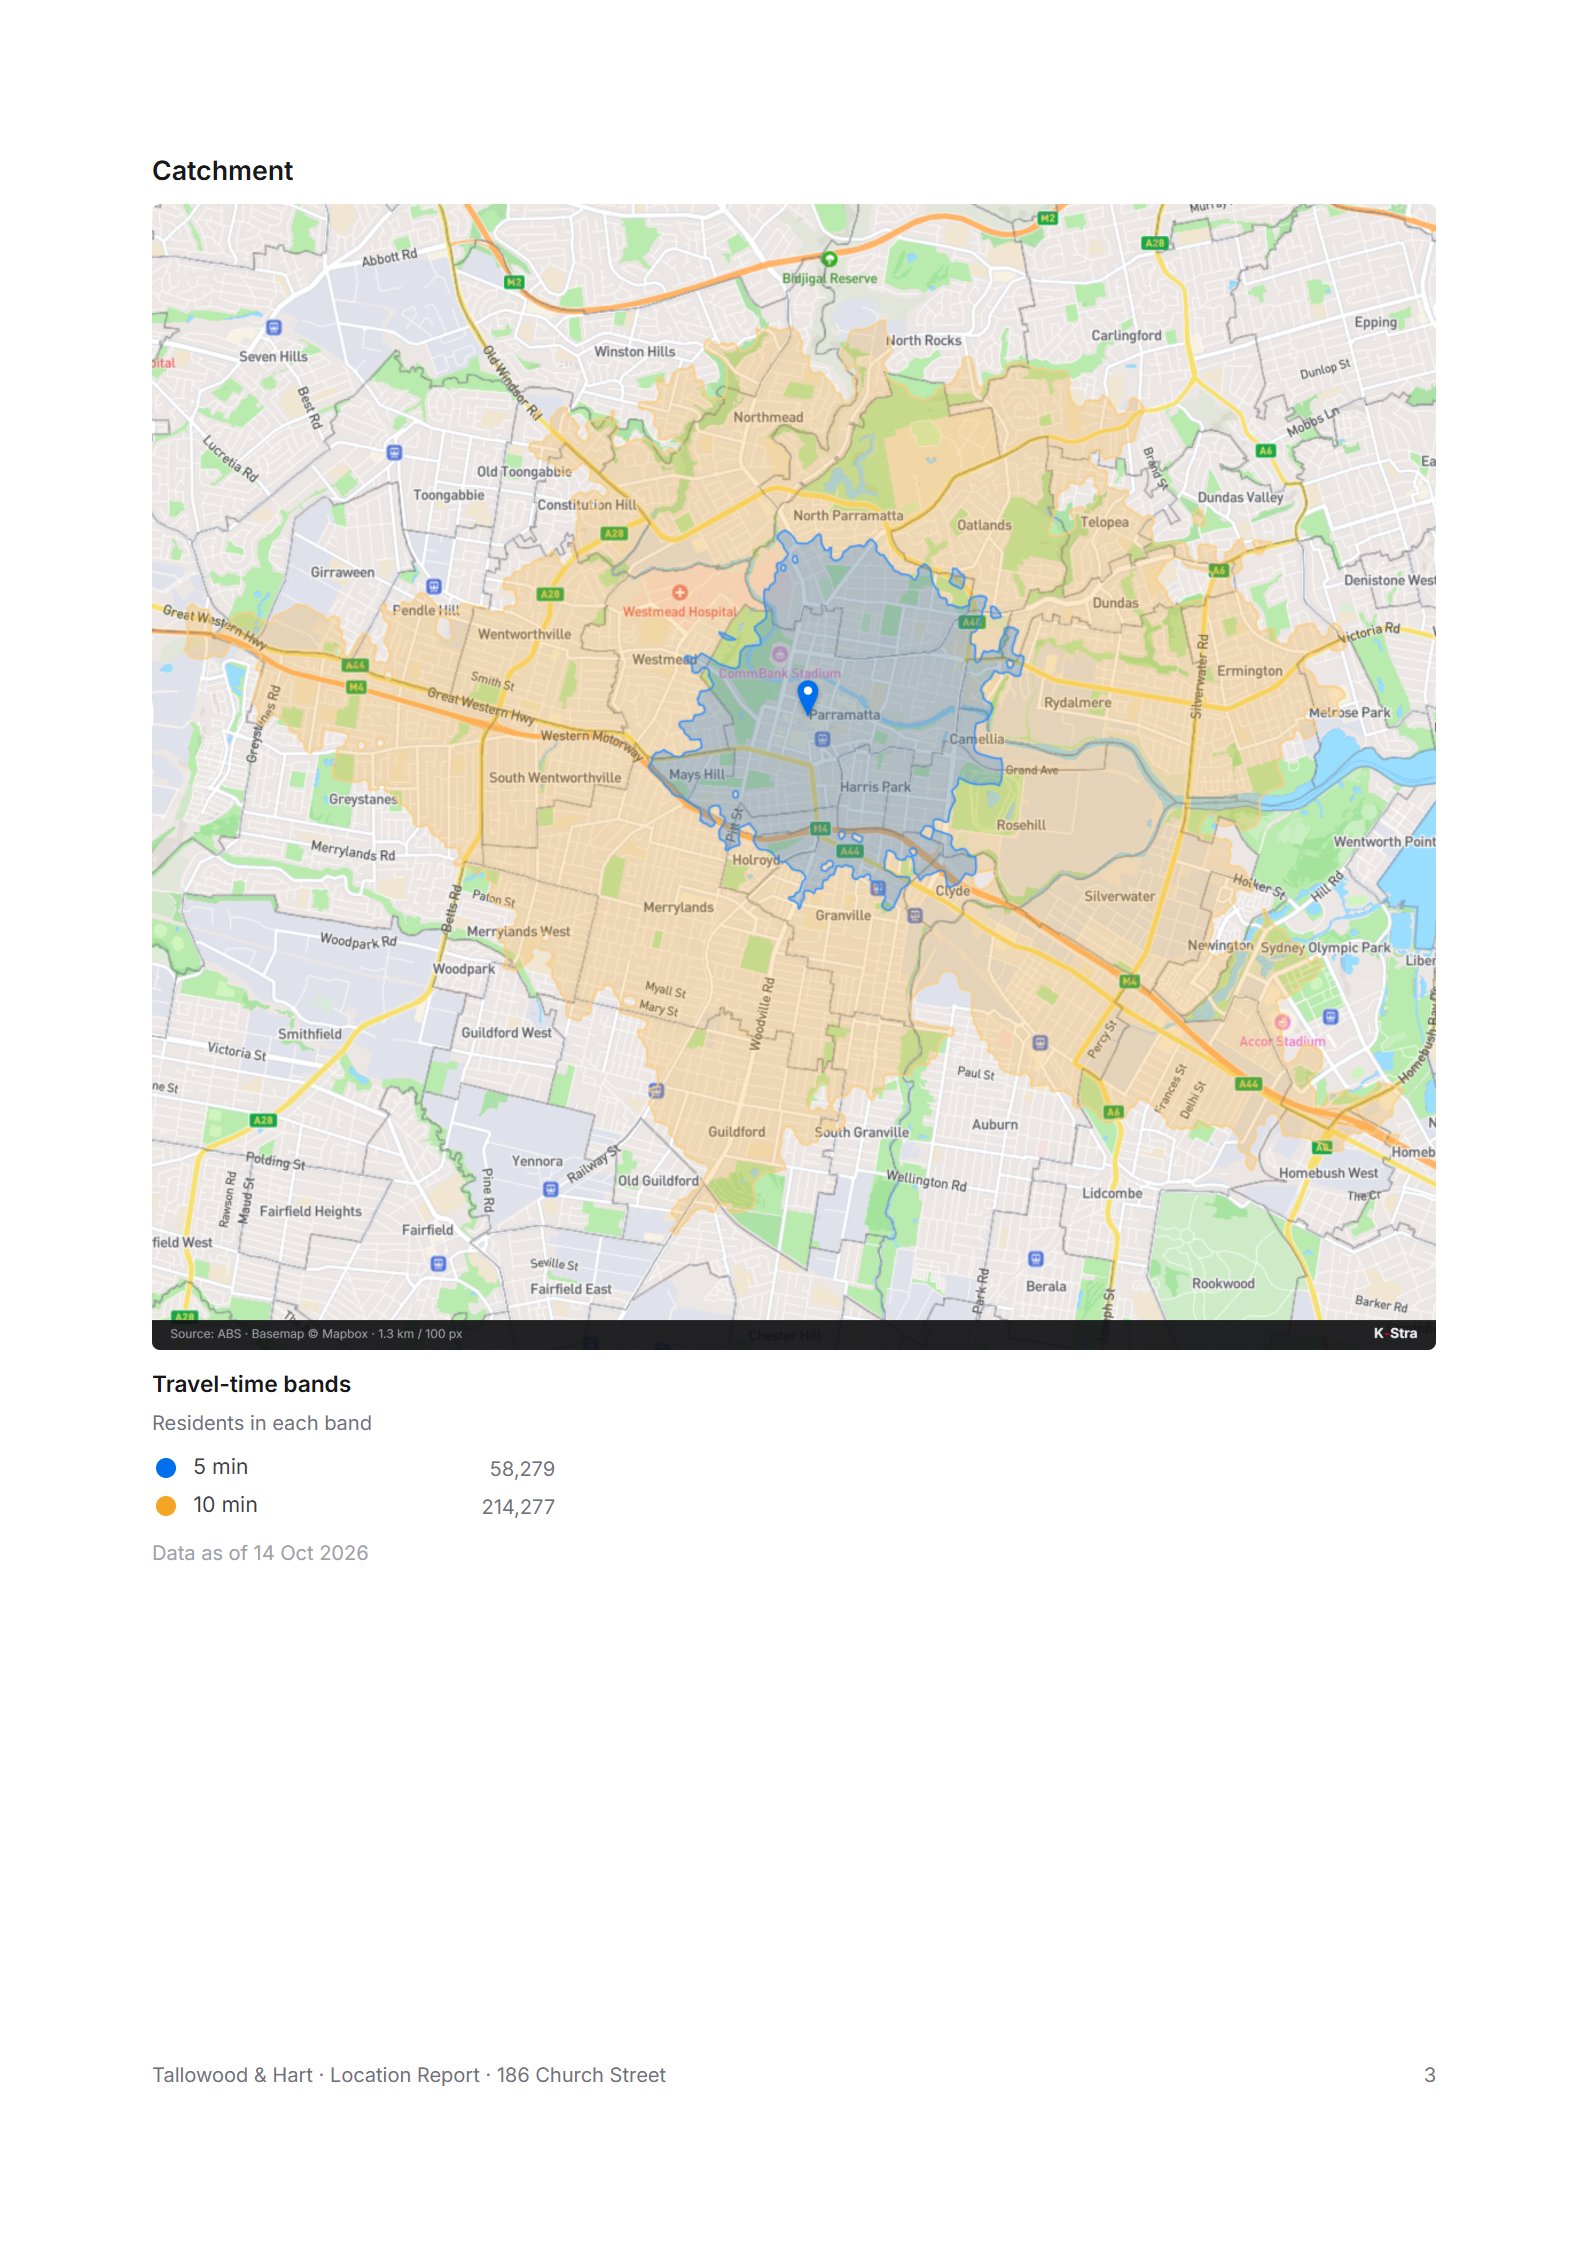
Church Street, Parramatta, Sydney · 5 and 10 minutes by car
The Basic report plus the sector market, the neighbouring categories, an estimate of the residents’ spending a new store could capture, property prices and takeaway lines written by AI.
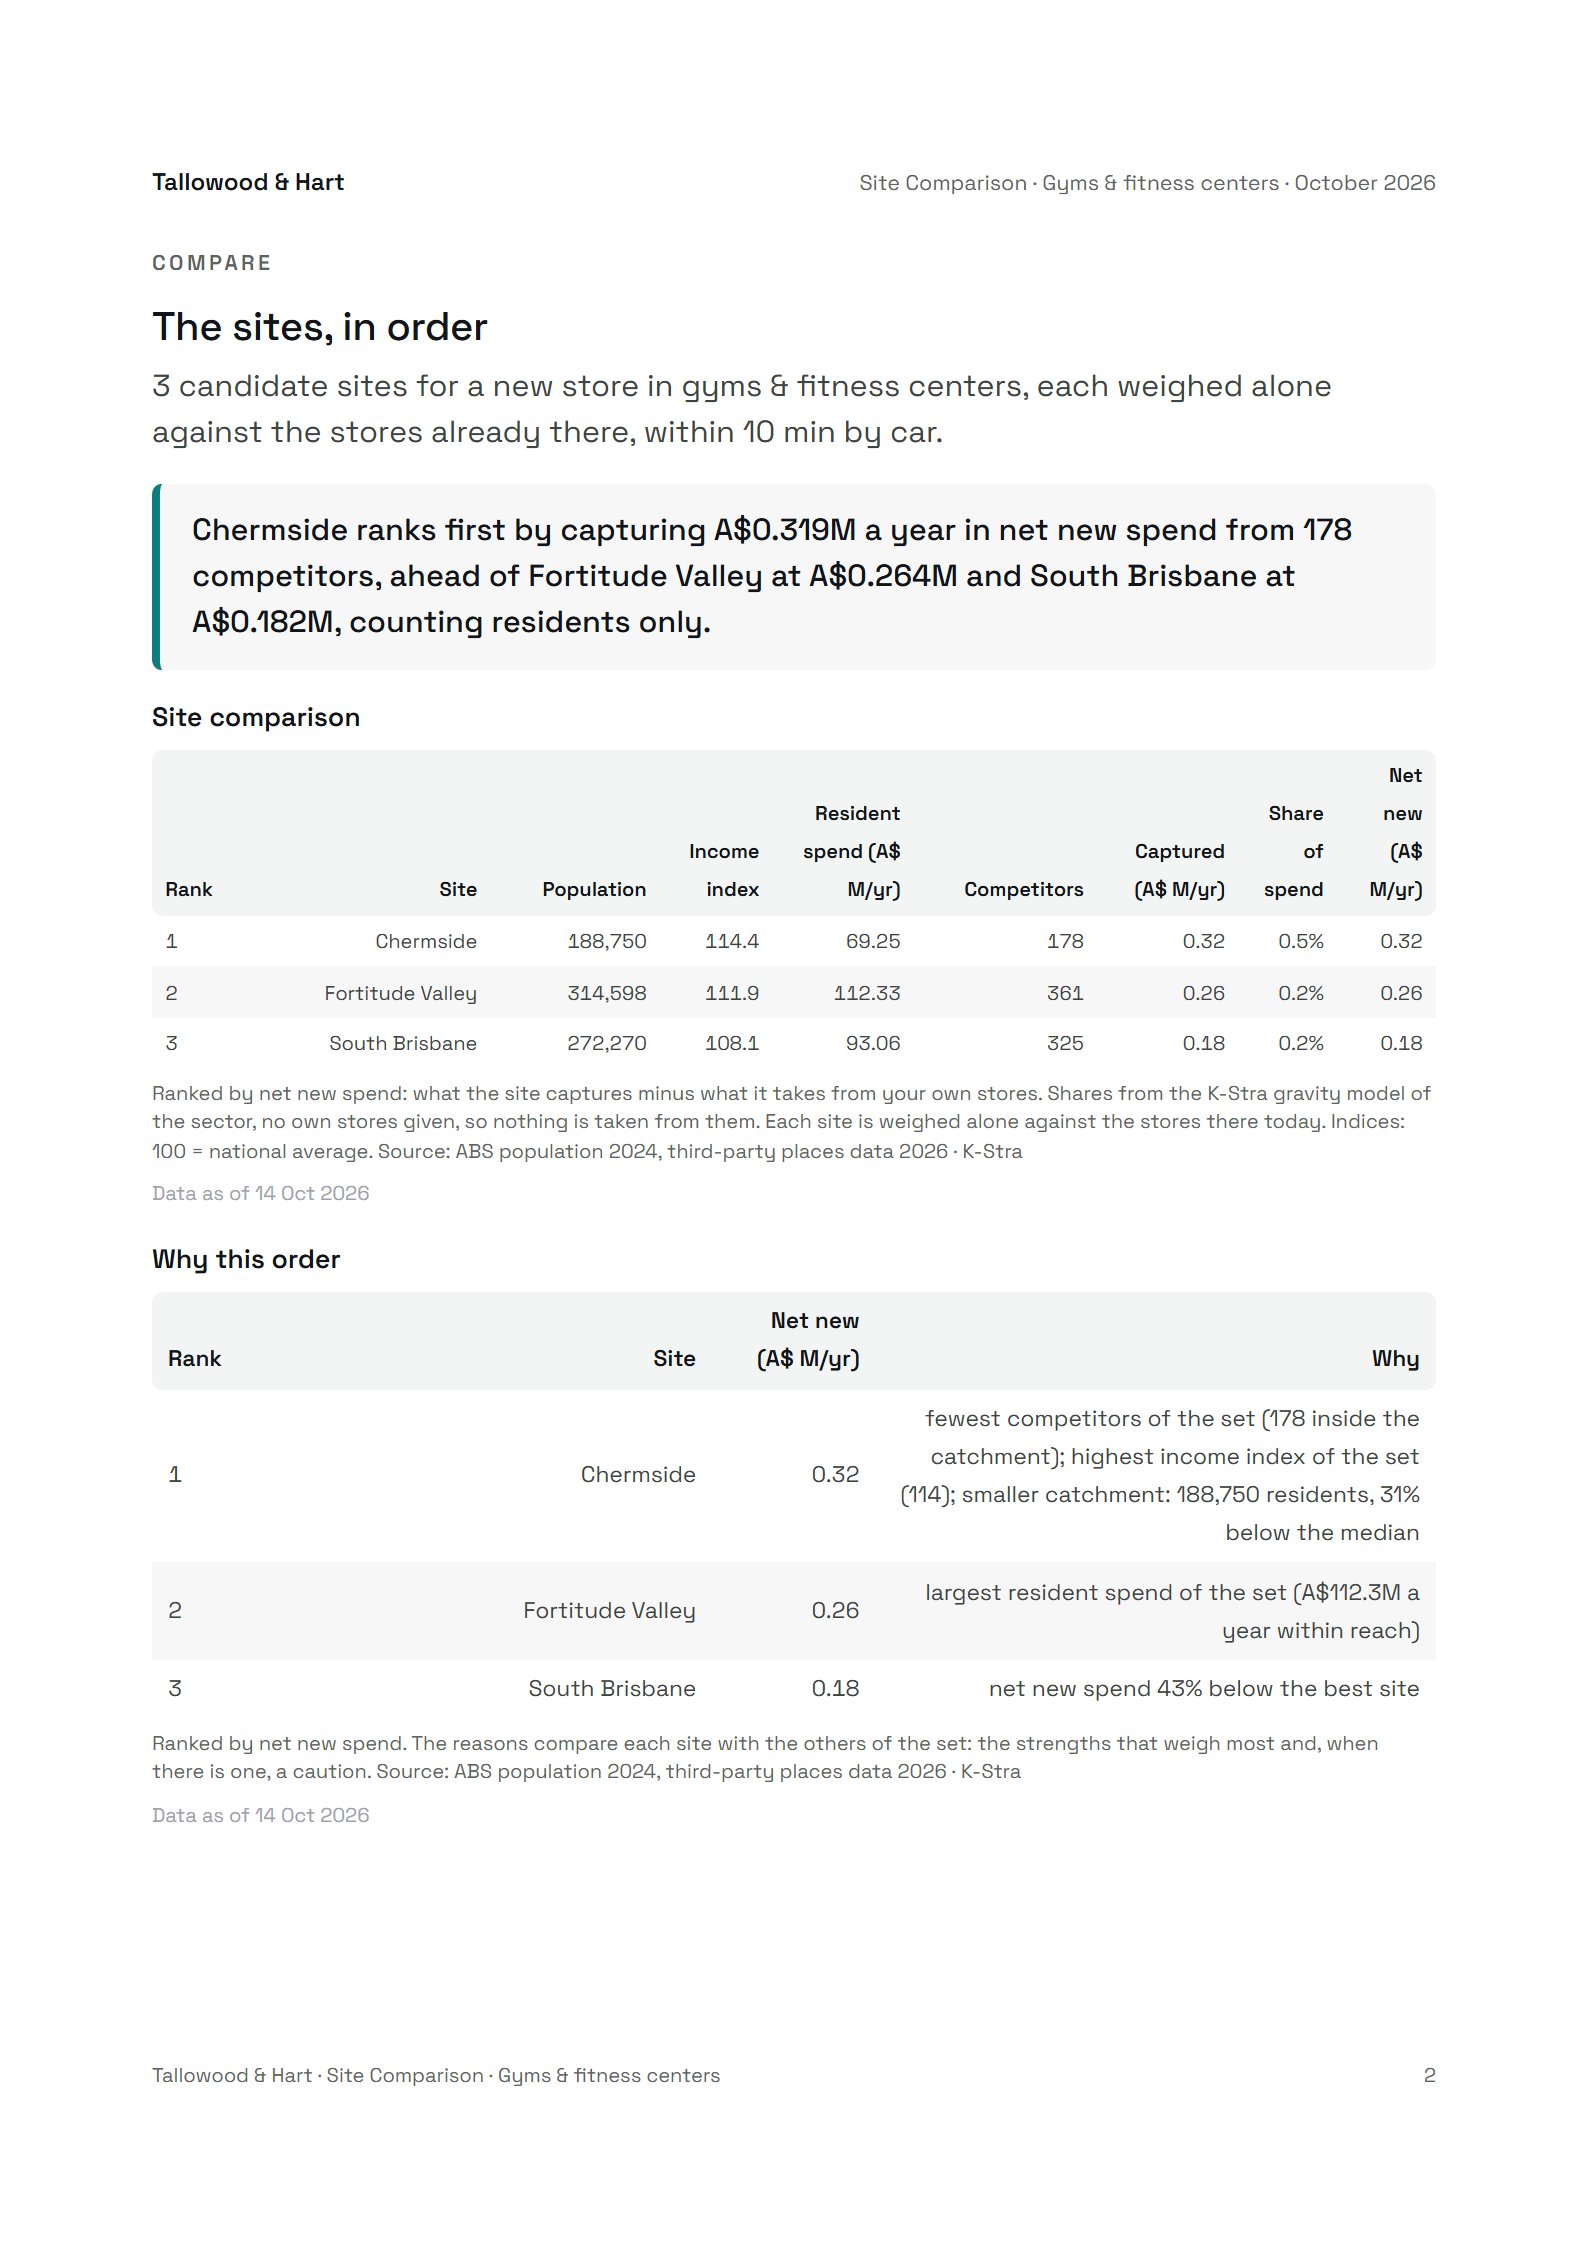
Fortitude Valley, South Brisbane and Chermside · 10 minutes by car
The candidate sites in order, the residents’ spending each could capture and where it comes from, how much their catchments overlap, and one page per site.
The web version is the interactive HTML file a report exports to: it opens in a new tab and works in any browser. The same samples are a click away in the app, inside each model in the New report window. They are made again when the models or the styles change, so the PDF can differ slightly from the pictures above.
Three ways to start
How do you start a report in K-Stra?
Every report is made of the results of analyses: what changes is who arranges them. The price of a model is always shown before anything runs.
Generate it with AI
Describe the report in one sentence: the place, the business, how far customers travel. The AI picks the model, the catchment and the sector, shows the price, and after your yes fills the report and writes a summary and the conclusions.
1 credit on top of the analyses it runs (plus the takeaway lines in the Pro).
Let a model fill it
Choose a model and a place. The Location Report Basic and Pro describe one address; the Site Comparison ranks two to five candidate sites. Fill all runs the analyses each section needs and places the results.
The analyses at their own price, shown before they run; 26 credits per site for a Site Comparison.
Lay it out yourself
Start from a blank page or a style with sample pages, then drag in the tables, charts and map views of your analyses. A4 or presentation format, portrait or landscape, with your logo, header and footer.
No charge to lay out: the figures come from analyses you have already run.
Method
How does the AI turn a sentence into a location report?
The AI reads the request and proposes; K-Stra’s analyses produce every figure. Nothing runs, and nothing is charged, until you confirm the price.
Step 0101
Write one sentence
Say the place, the business and how far customers travel, as you would to a colleague. An address is enough to find the place.
Step 0202
Check the proposal
The AI picks the report, the catchment and the sector, and shows the price. Change the model, the sector, the style or the format before anything runs.
Step 0303
Say yes
Only then do the analyses run, at their normal price. Two to five places in the same sentence become a Site Comparison with one catchment for all.
Step 0404
Read what the AI wrote
A summary after the cover, a takeaway line on each section of the Pro, and conclusions with strengths, risks and what to check on site.
Step 0505
Schedule it
Choose weekly, monthly or quarterly, the day, the hour, the time zone, the first issue and who receives it.
The AI’s part
What does the AI write in a report, and what does it leave to the data?
What the AI writes
The summary on the first page, with up to four key figures from the tables.
The conclusions: strengths, risks, what to check on site and the answer to your question.
In the Location Report Pro, one takeaway line per section, drawn from that section’s numbers.
On request, a first draft of a report you lay out yourself, or a block rewritten or translated.
What it does not do
It does not make up figures: every number comes from an analysis K-Stra ran, and its text is checked against them, so a number that is not in the data is caught.
It does not run anything without your yes: the price is shown first.
It does not rewrite its text by itself at every issue: the figures update, the words stay until you ask again.
Models
What is inside a Location Report and a Site Comparison?
Each section opens with a takeaway line drawn from its own figures. The Pro adds the market of the sector and its takeaway lines are written by AI (2 credits per fill); the conclusions by AI cost 2 credits in any report.
Location Report · Basic
Location and catchment
Who lives there
Spending power
Competition
Conclusions
Sources and method
Location Report · Pro
Everything in the Basic
The sector market
Neighbouring categories
Estimate of the spending a new store could capture
Property prices and rents
What changed since the last issue
Site Comparison
The sites in order
What each site would capture, and from where
Shared catchments
One page per site
Conclusions
The estimate is how much of the yearly spending of the catchment’s residents a new store could capture, as a low, central and high figure. Workers, commuters and visitors are not counted, so in city centres it is a minimum: it is meant for comparing sites of the same sector in the same area, and the absolute value is an order of magnitude.
Scheduled issues
How do you receive the same report by email every month?
Any report can be scheduled from its menu, whether the AI wrote it, a model filled it or you laid it out yourself.
On your calendar
Weekly, monthly (the last day of the month too) or quarterly, at the hour you choose in your time zone, from the date you choose. No issue goes out before it.
To whoever needs it
Up to 50 recipients per report: colleagues in K-Stra or any email address, each with an unsubscribe link.
As files and as a page
PDF, Excel and PowerPoint attached up to 10 MB in all, and a read-only web version of the issue that opens from the email for 30 days.
Kept in an archive
Every issue keeps a PDF with its figures frozen at the issue date in Reports › Issues. Send a test now makes one without credits, outside the archive.
Without a schedule, a report can be shared with your team, your organisation, named people or anyone with the link, with an optional expiry. People outside your team read the figures as they were when you shared them, without an account.
Fresh figures
Which numbers change from one issue to the next?
Every table, chart and map in a report is either a Snapshot or Dynamic. A Snapshot keeps the numbers of the day you added it, for free; a Dynamic item runs its analysis again on the latest data at every issue.
Business listings and property listings are updated every month, so a monthly issue sees the new ones. If every item is a Snapshot, K-Stra warns that each issue would repeat the same numbers, and one switch makes them all Dynamic.
The Location Report Pro has a page on what changed since the last issue sent: the businesses that opened and closed in the catchment, then up to 15 figures that moved, the main tables first. On the first issue the page is empty and is not printed.
The words the AI wrote do not change by themselves. When the figures have moved enough to matter, Add conclusions writes the summary and the conclusions again from the new numbers.
A monthly Location Report Pro on a store’s catchment lists the businesses that opened and closed in it since the last issue, and the figures that moved.
On 14 October 2026 the sample Location Report Basic used 50 credits and the Pro 100, conclusions by AI included. Each scheduled issue then costs the analyses behind its Dynamic items, at their normal price, and nothing for the rest.
Generating a report from your words1 credit per report, plus the analyses it runs1 credit
Snapshot items in every scheduled issueFree
Test issue, exports, sharing and the archiveFree
Optional, not in the total
Takeaway lines written by AI in the Pro2 credits per fill+ 2 credits
Conclusions written again by AI2 credits per report+ 2 credits
First draft by AI of a report you lay out10 credits per draft+ 10 credits
The schedule window shows the cost per issue before you save it. If the balance is short, the issue is skipped and nothing is charged; an issue that fails is refunded.
FAQ
What else do people ask about AI reports?
Can an AI write a location report for a new store?
Yes. In K-Stra you write one sentence with the place and the business, and the AI chooses the report, the catchment and the sector, shows the price and, after your yes, runs the analyses and writes the summary and the conclusions. Generating costs 1 credit on top of the analyses it runs.
Does the AI make up the numbers?
No. The figures come from the analyses K-Stra runs on its own data. The AI decides which analyses a report needs, lays out the pages and writes the sentences around the numbers, which are then checked against those numbers.
Do the conclusions change at every issue?
No. Each issue works out the Dynamic figures again on the latest data and, in the Location Report Pro, rewrites the page on what changed since the last issue. The summary and the conclusions stay as the AI wrote them; Add conclusions writes them again for 2 credits whenever you want.
What does a scheduled report cost?
Each issue runs again the analyses behind its Dynamic items, at their normal price, and items from the same analysis share one run. Snapshot items cost nothing. The cost per issue is shown before you save the schedule, a test issue is free and an issue that fails is refunded.
What happens if there are not enough credits for an issue?
That issue is skipped, nothing is charged and you are notified. After two skipped issues in a row the schedule pauses until you resume it.
Can people outside my company receive the report?
Yes. Any email address can be a recipient, up to 50 per report, and opens the web version of the issue without an account for 30 days.
How much does a Location Report cost?
Filling it runs the analyses its sections need — residents, spending, competition and, in the Pro, the sector market and the estimate — each at its normal price, and the total is shown before anything runs. On 14 October 2026 the Basic sample on this page used 50 credits and the Pro sample 100, conclusions by AI included. Exporting and sharing the report are free.
Are the sample reports real?
Yes. K-Stra made them with the same steps a customer takes, on real addresses and with the data of the day they were made. Only the company on the cover, Tallowood & Hart, is invented: it stands for the consultancy or the business that would sign the report.
What does the estimate in the Pro report measure?
How much of the yearly spending of the catchment’s residents a new store could capture, and which stores it would take it from, as a low, central and high figure from a model of the sector. Workers, commuters and visitors are not counted, so in city centres it is a minimum. It is meant for comparing sites of the same sector in the same area; the absolute value is an order of magnitude.
Can I put my own logo and colours on a report?
Yes. The company logo, name and details set in your account appear on the cover, in the header and footer and on the closing page, and your brand colour can be the accent of every new report. The style of a report can be changed at any time without touching its content.
Your first AI report
One sentence, one report, every month.
Sign up free, describe a place and a business, and see the price before anything runs. Exports, sharing and test issues are free.