
Where do my customers come from?
Most businesses guess where their customers live from the car park and the counter. A map of the customers you already have replaces the guess.
To see where your customers come from, put your customer or loyalty records on a map by postcode or suburb, add up sales and customers for each area, and rank the areas. The handful of postcodes that make about three quarters of the business is your real trade area; the rest shows how far customers will travel.
Why don’t businesses know where their customers come from?
The information exists, scattered across systems: loyalty cards in one, online orders in another, deliveries in a third. Each holds a postcode or an address, and none of them draws a map.
Raw counts also mislead. A postcode with many customers may just have many residents; a small one next door with a handful of customers may be where the store does best. Counts need to be put next to the area.
And the useful boundary is not obvious. Customers thin out with distance rather than stopping at a line, so the trade area has to be read from the data: where most of the business is, and where it fades.
of customers is where analysts usually draw a store’s primary trade area, when they build it from real customer records.
Pesch, R. and Ryan, B. (2022), “Trade Area Analysis”, University of Wisconsin–Madison Division of Extension.
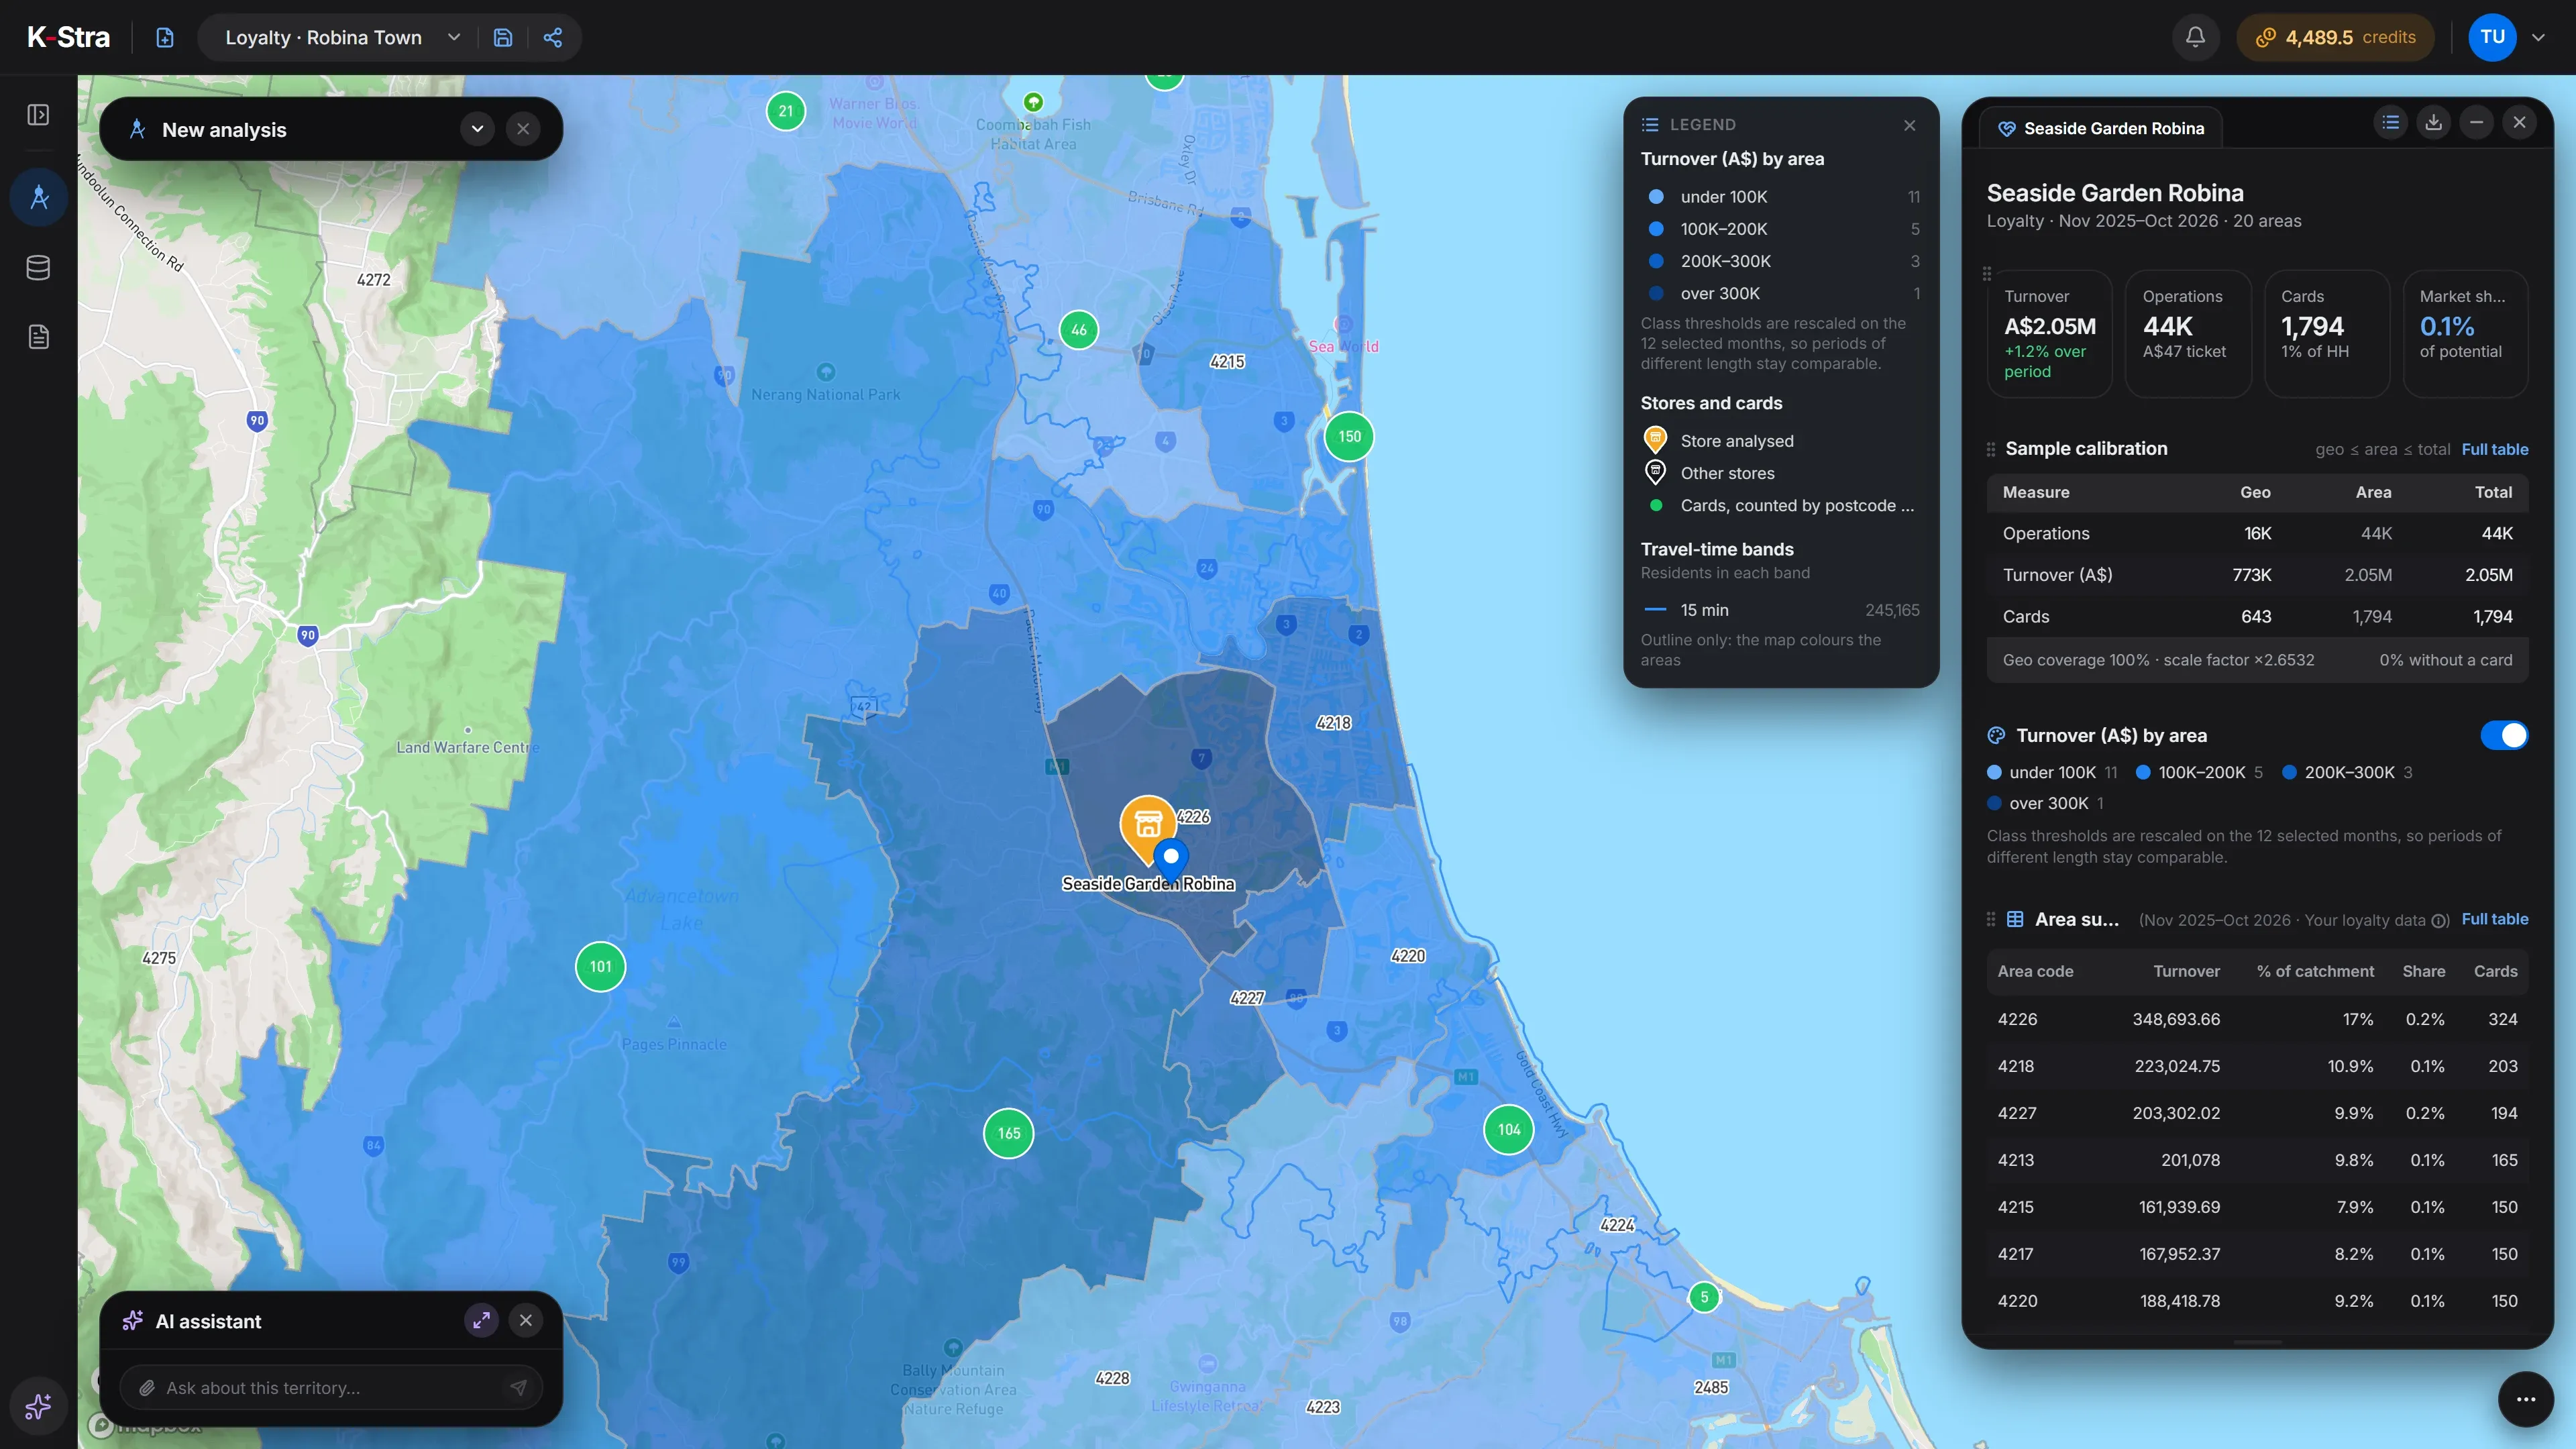 Sample data · Gold Coast
How do you map your customers, step by step?
Gather a customer file
Loyalty cards, online orders or a client list: any record with a postcode or suburb and, ideally, a value.
Strip out the people
Keep an anonymised customer code and a postcode or suburb. Names, emails, phone numbers and the street addresses of private individuals add nothing to a map and should not be uploaded.
Place each record
A postcode or suburb is enough to count customers by area. Only addresses of businesses and other places, such as your stores, are geocoded onto the street.
Add up by area
Customers and sales for each postcode, and each postcode’s share of the total.
Rank and accumulate
Sort the areas from largest to smallest and add their shares. Where the running total reaches about 75%, you have your primary trade area.
Look at the gaps
Populous postcodes near the store that bring few customers are either served by a competitor or not reached by your marketing.
Repeat over time
Do it again each quarter or after a change of store, range or campaign, and compare.
What data do you need to map your customers?
A file of customers with a location. The more you can attach to each record — sales, visits, a date — the more the map can tell.
A customer or loyalty file
One row per customer or per customer and month, with an internal code. Loyalty files follow the template in the app.
Loyalty card analysisA location for each record
A postcode or suburb, or the address of a business or place to be geocoded. Never a name, an email, a phone number or the street address of a private individual.
File formats and limitsA value, if you have one
Sales, visits or orders turn a map of customers into a map of business. Without it you still see where people come from.
Clients by repResidents of each area
ABS population estimates at 30 June 2025, to tell a busy postcode from a big one.
Population data
K-Stra runs on a dedicated server in Sydney: your datasets, your analyses and your results stay in Australia. Map tiles, payments and sign-in never see your files. Three steps can: geocoding sends only the address text, and only after you confirm; the AI assistant reads column names and values when you ask it about a dataset; email notifications carry figures from your analysis.Where your data lives. Mark a dataset “session only” and it is deleted 24 hours after upload.
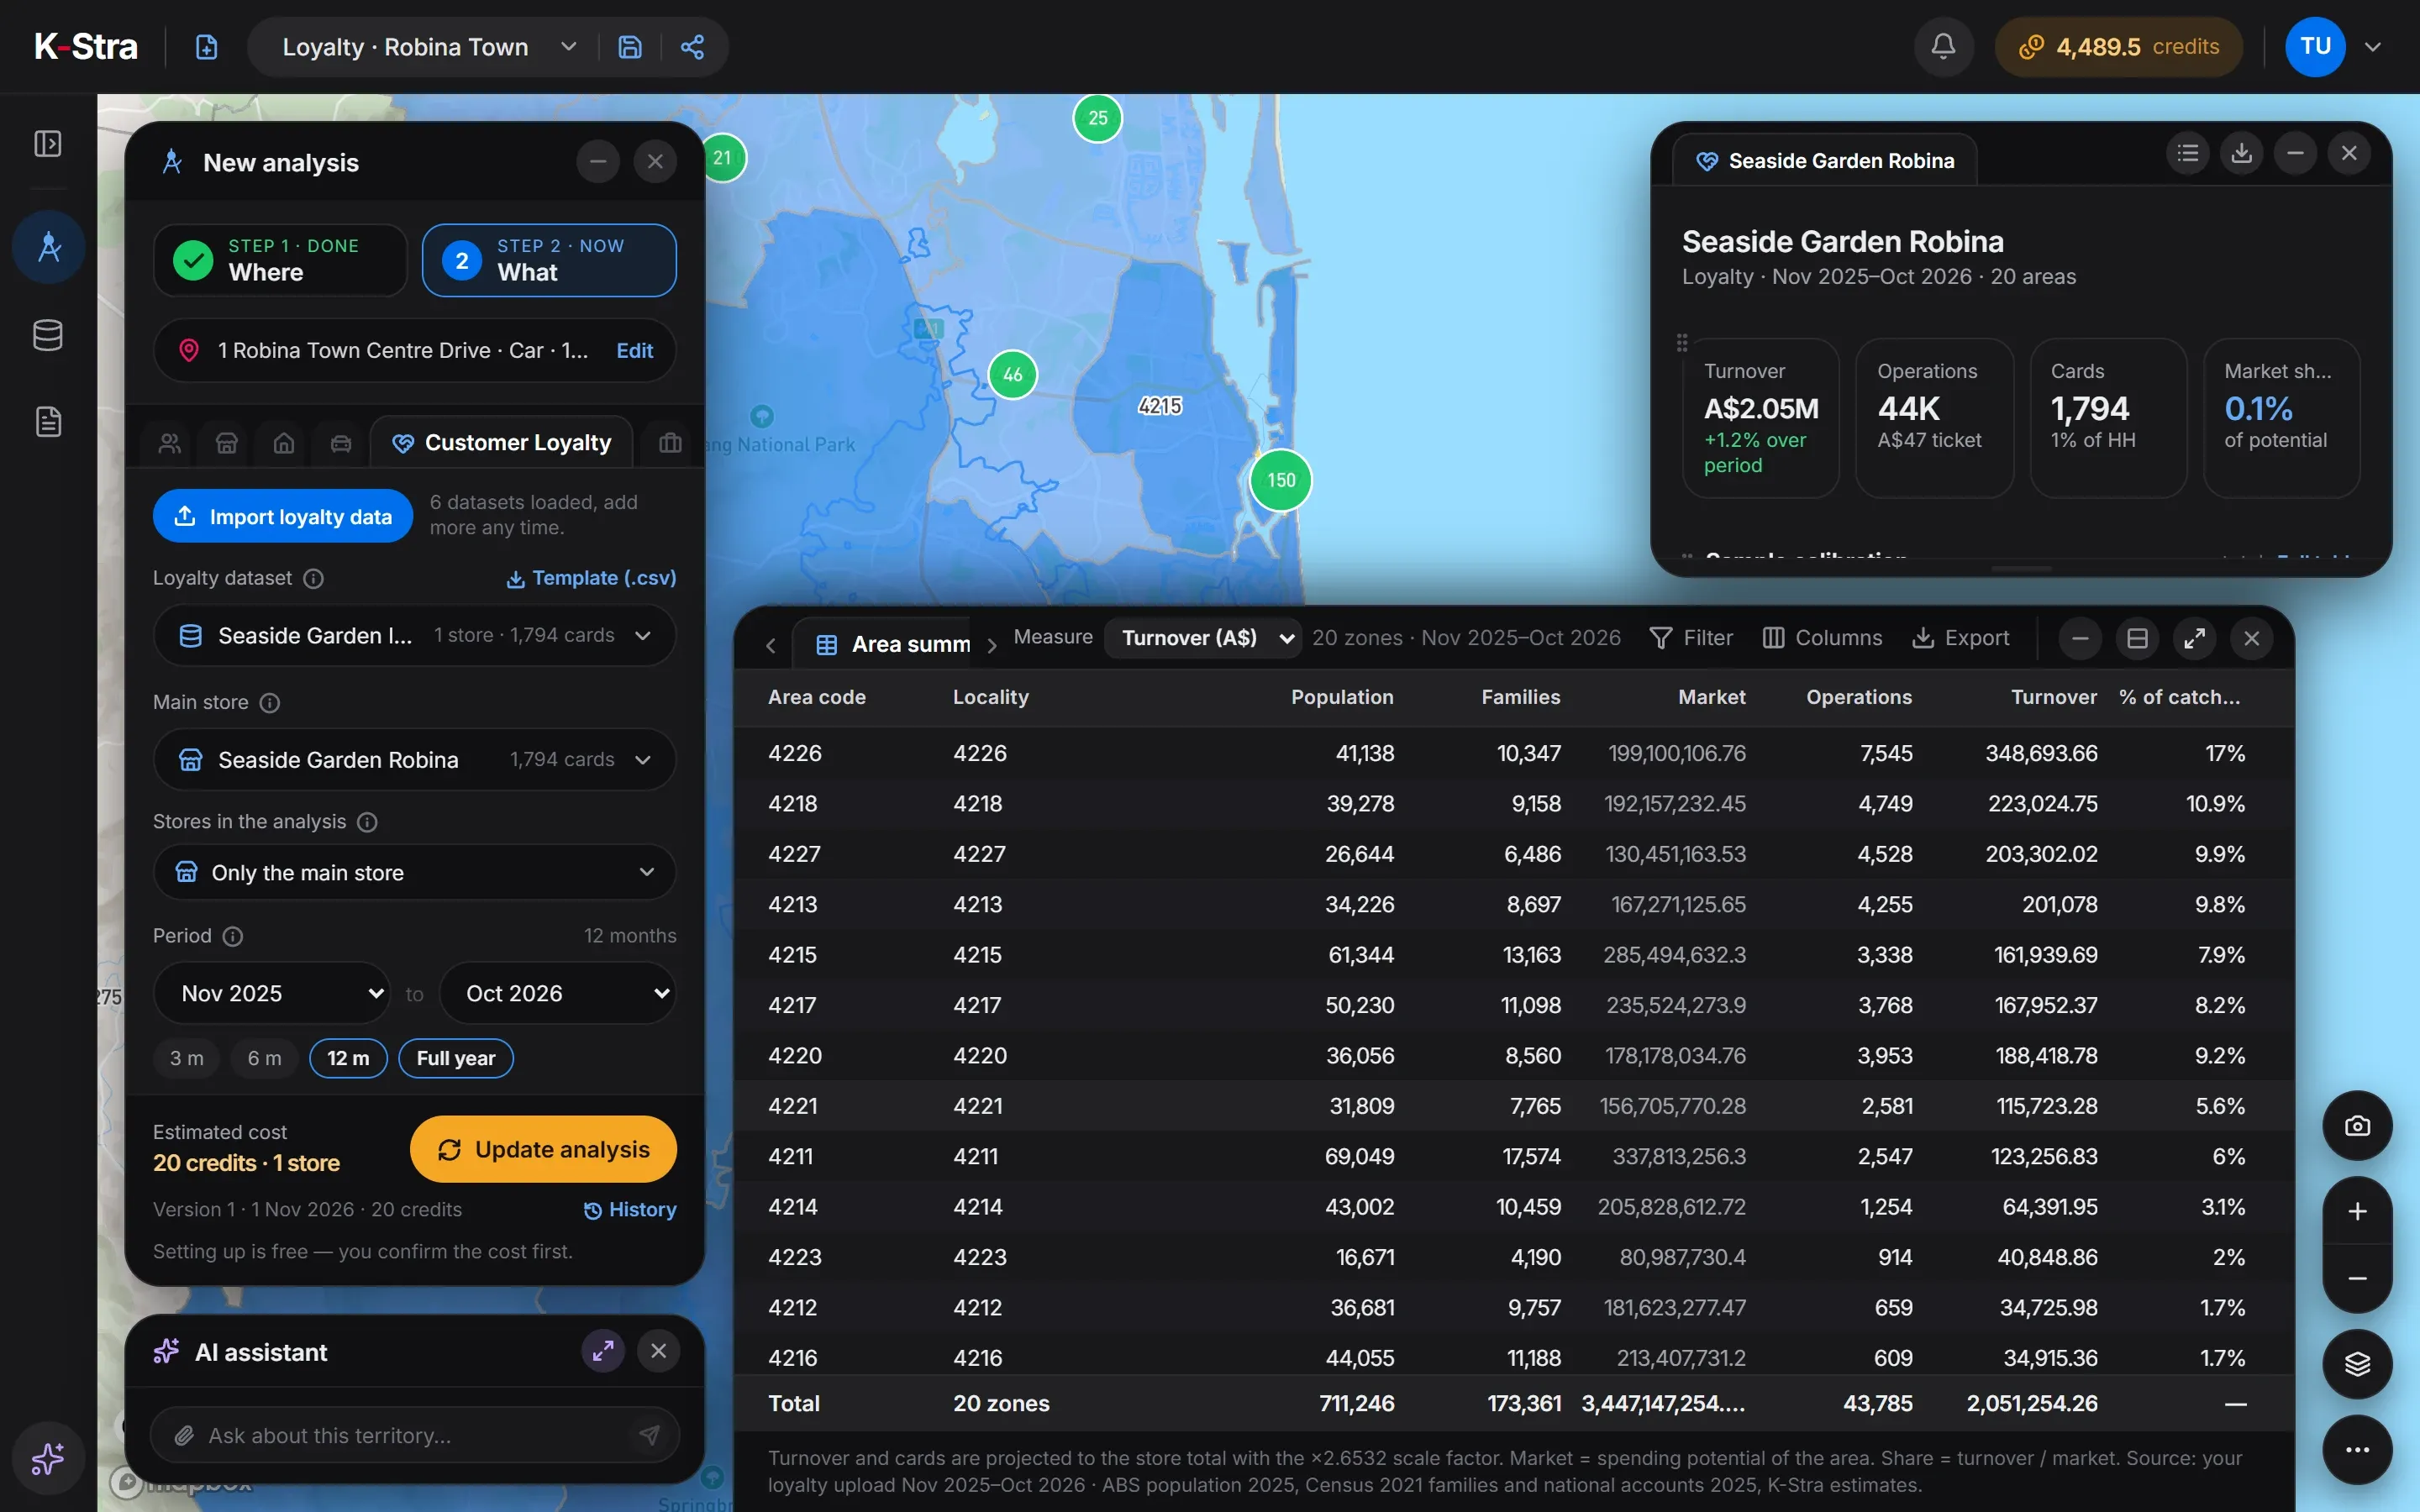
How do you map customers in K-Stra?
Three routes, depending on the file you have. The example uses the first: a loyalty file read by postcode.
- Customer LoyaltyImport a loyalty file, pick the store and group the cards by postcode or by drive-time band. 20 credits per store analysed.
- My DataImport any customer list as points on the map. Rows with coordinates cost only the import, 1 credit per 10,000 rows; addresses of businesses or places are geocoded after you confirm.
- Your figures by areaAttach your own values to postcodes or councils and shade the map with them, at 1 credit per 1,000 values.
Loyalty data is a sample of the business: K-Stra projects it to the store’s total and shows the factor. The customers can be exported as KML for other mapping tools, and every table as Excel or CSV, at no cost.
What does a customer map show?
A sample garden centre in Robina, Gold Coast, November 2025 to October 2026: 1,794 loyalty customers and A$2.05 million of turnover, from 20 postcodes. Ranked by turnover, the first eight postcodes add up to 78.9% of the business — the store’s primary trade area.
| Postcode | Suburb | Customers | Share of turnover | Running total |
|---|---|---|---|---|
| 4226 | Robina | 324 | 17% | 17% |
| 4218 | Broadbeach | 203 | 10.9% | 27.9% |
| 4227 | Varsity Lakes | 194 | 9.9% | 37.8% |
| 4213 | Mudgeeraba | 165 | 9.8% | 47.6% |
| 4220 | Burleigh Heads | 150 | 9.2% | 56.8% |
| 4217 | Surfers Paradise | 150 | 8.2% | 65% |
| 4215 | Southport | 150 | 7.9% | 72.9% |
| 4211 | Nerang | 101 | 6% | 78.9% |
Sources: sample loyalty data of a fictional store in a K-Stra sample account, projected to the store total; ABS population at 30 June 2025. K-Stra analysis of 1 November 2026.
What does the map say about the store?
Robina itself brings 17% of the turnover. The next four postcodes are spread from the coast at Broadbeach to the hinterland at Mudgeeraba: the store draws from a wide area, not just from its own suburb.
The tail is long and thin: 28 customers even come from Tweed Heads and Banora Point, across the state border, for 1.8% of turnover. Those postcodes are worth watching for a second store, not for marketing from this one.
The store and its customers are invented for this example and loaded into a K-Stra sample account; postcodes and population are real.
How much does it cost to map your customers?
The import of the example’s 14,730 monthly rows cost 2 credits, and the analysis of the store 20. Once a file is in, every further store or period is a new analysis at the same price, with no new import.
Records with the address of a business or a place can be geocoded at 1.5 credits per 1,000 addresses; the import shows that cost before you confirm.
- Customer Loyalty for the Robina store20 credits per store analysed20 credits
- Import of the customer file1 credit per 10,000 rows2 credits
- Maps, tables, KML and Excel exportsFree
- Total= 22 credits
- ≈ A$34 at the Single report pack rate of A$1.53 a credit; less with larger packs and monthly plans. A new free account’s 40 welcome credits cover it.
The cost appears before anything runs; a failed run costs nothing, and an interrupted import pays only for the rows already loaded.
What else do people ask about customer mapping?
What is the difference between customer mapping and a catchment area?
A catchment is drawn from the store outwards, by drive time, before you know who comes. Customer mapping starts from the customers you actually have and shows where they live. Comparing the two shows whether the store reaches the area it should.
Can I map customers without a loyalty programme?
Yes. Any file with a location works: import it into My Data as points, after geocoding if it has addresses of businesses or places (1.5 credits per 1,000 addresses), or attach your own figures to postcodes or councils to shade the map (1 credit per 1,000 values).
Is a postcode precise enough?
For deciding where the business comes from, yes: postcodes are what most teams already report in. Street-level maps need exact points, and those should be the addresses of businesses or places, never the home address of a private individual.
Why does the example leave market share out?
Because the module measures share against residents’ food spending, the category it uses by default. For a garden centre that comparison has no meaning, so the example reads the map, the customers and the turnover by area instead.
Put your customers
on the map.
Import a customer or loyalty file and see which postcodes make your business.
Open the app — free to exploreImport 1 credit per 10,000 rows