
Which population data does K-Stra use?
Who lives around an address is the first number of almost every analysis. Here is where each population figure comes from, and how old it is.
K-Stra counts residents, males and females and fifteen age classes from the ABS population estimates at 30 June 2025, and takes families, birthplace, education and marital status from the 2021 Census. Both are spread onto address points, so a drive time adds up exactly the homes it reaches. Each council also has its population year by year since 2019.
Which population variables are there?
Thirteen variables in five topics of People & Economy: Residents, Postcodes, Age, Education and marital status, Population trend. Each topic costs 2 credits; the size of the area is free.
| Variable | Source | Reference period | Measured at |
|---|---|---|---|
| Residents, by travel-time band and by councilResidents | ABS population estimates | 30 June 2025 | Council total, spread onto addresses |
| Males and femalesResidents | ABS population by age and sex | 30 June 2025 | Council, spread onto addresses |
| Families and residents per familyResidents | ABS Census 2021 | Census 2021 | SA1, spread onto addresses |
| Residents born overseas, also by postcodeResidents | ABS Census 2021 | Census 2021 | SA1, spread onto addresses |
| Dwellings and occupied dwellingsResidents | ABS Census 2021 | Census 2021 | SA1, spread onto addresses |
| Residents of each postcode inside the area, and the share of the postcode it coversPostcodes | ABS population estimates | 30 June 2025 | Sum of the addresses |
| Age in 8 ten-year and 15 five-year classes, by sexAge | ABS population by age and sex | 30 June 2025 | Council, spread onto addresses |
| Average age and old-age indexAge | ABS population by age and sex | 30 June 2025 | Derived from the age classes |
| Age groups: under 5, children 0–14, working age 15–64, 65 and over, 70 and overAge | ABS population by age and sex | 30 June 2025 | Derived from the age classes |
| Highest qualification of residents aged 15 and overEducation and marital status | ABS Census 2021 | Census 2021 | SA1, spread onto addresses |
| Highest year of school completedEducation and marital status | ABS Census 2021 | Census 2021 | SA1, spread onto addresses |
| Marital status of residents aged 15 and overEducation and marital status | ABS Census 2021 | Census 2021 | SA1, spread onto addresses |
| Population of each council year by year, with the average yearly changePopulation trend | ABS population estimates | 2019 to 2025, at 30 June | Council only |
How are population figures counted inside a drive time?
The ABS publishes population for areas, never for streets. K-Stra spreads it onto 14.5 million address points in two layers: the shape inside each council comes from the 2021 Census at its finest level, the SA1 area; the total comes from the council’s estimate at 30 June 2025.
Inside an SA1, people are shared among addresses in proportion to how many each building can house, judged from the road network and the size of the building. A drive time then adds up the addresses it reaches, so its edge passes between street numbers instead of halving a statistical area.
Because every level starts from the same council estimates, the levels agree: postcodes, suburbs, councils, states and Australia add up to the same 27.6 million residents. Census variables follow the same route and keep each council’s census total.
The population trend is the exception. It exists only where the ABS publishes a yearly series K-Stra loads, the council, and the app shows it for the councils inside the area.
What does the population of an area look like?
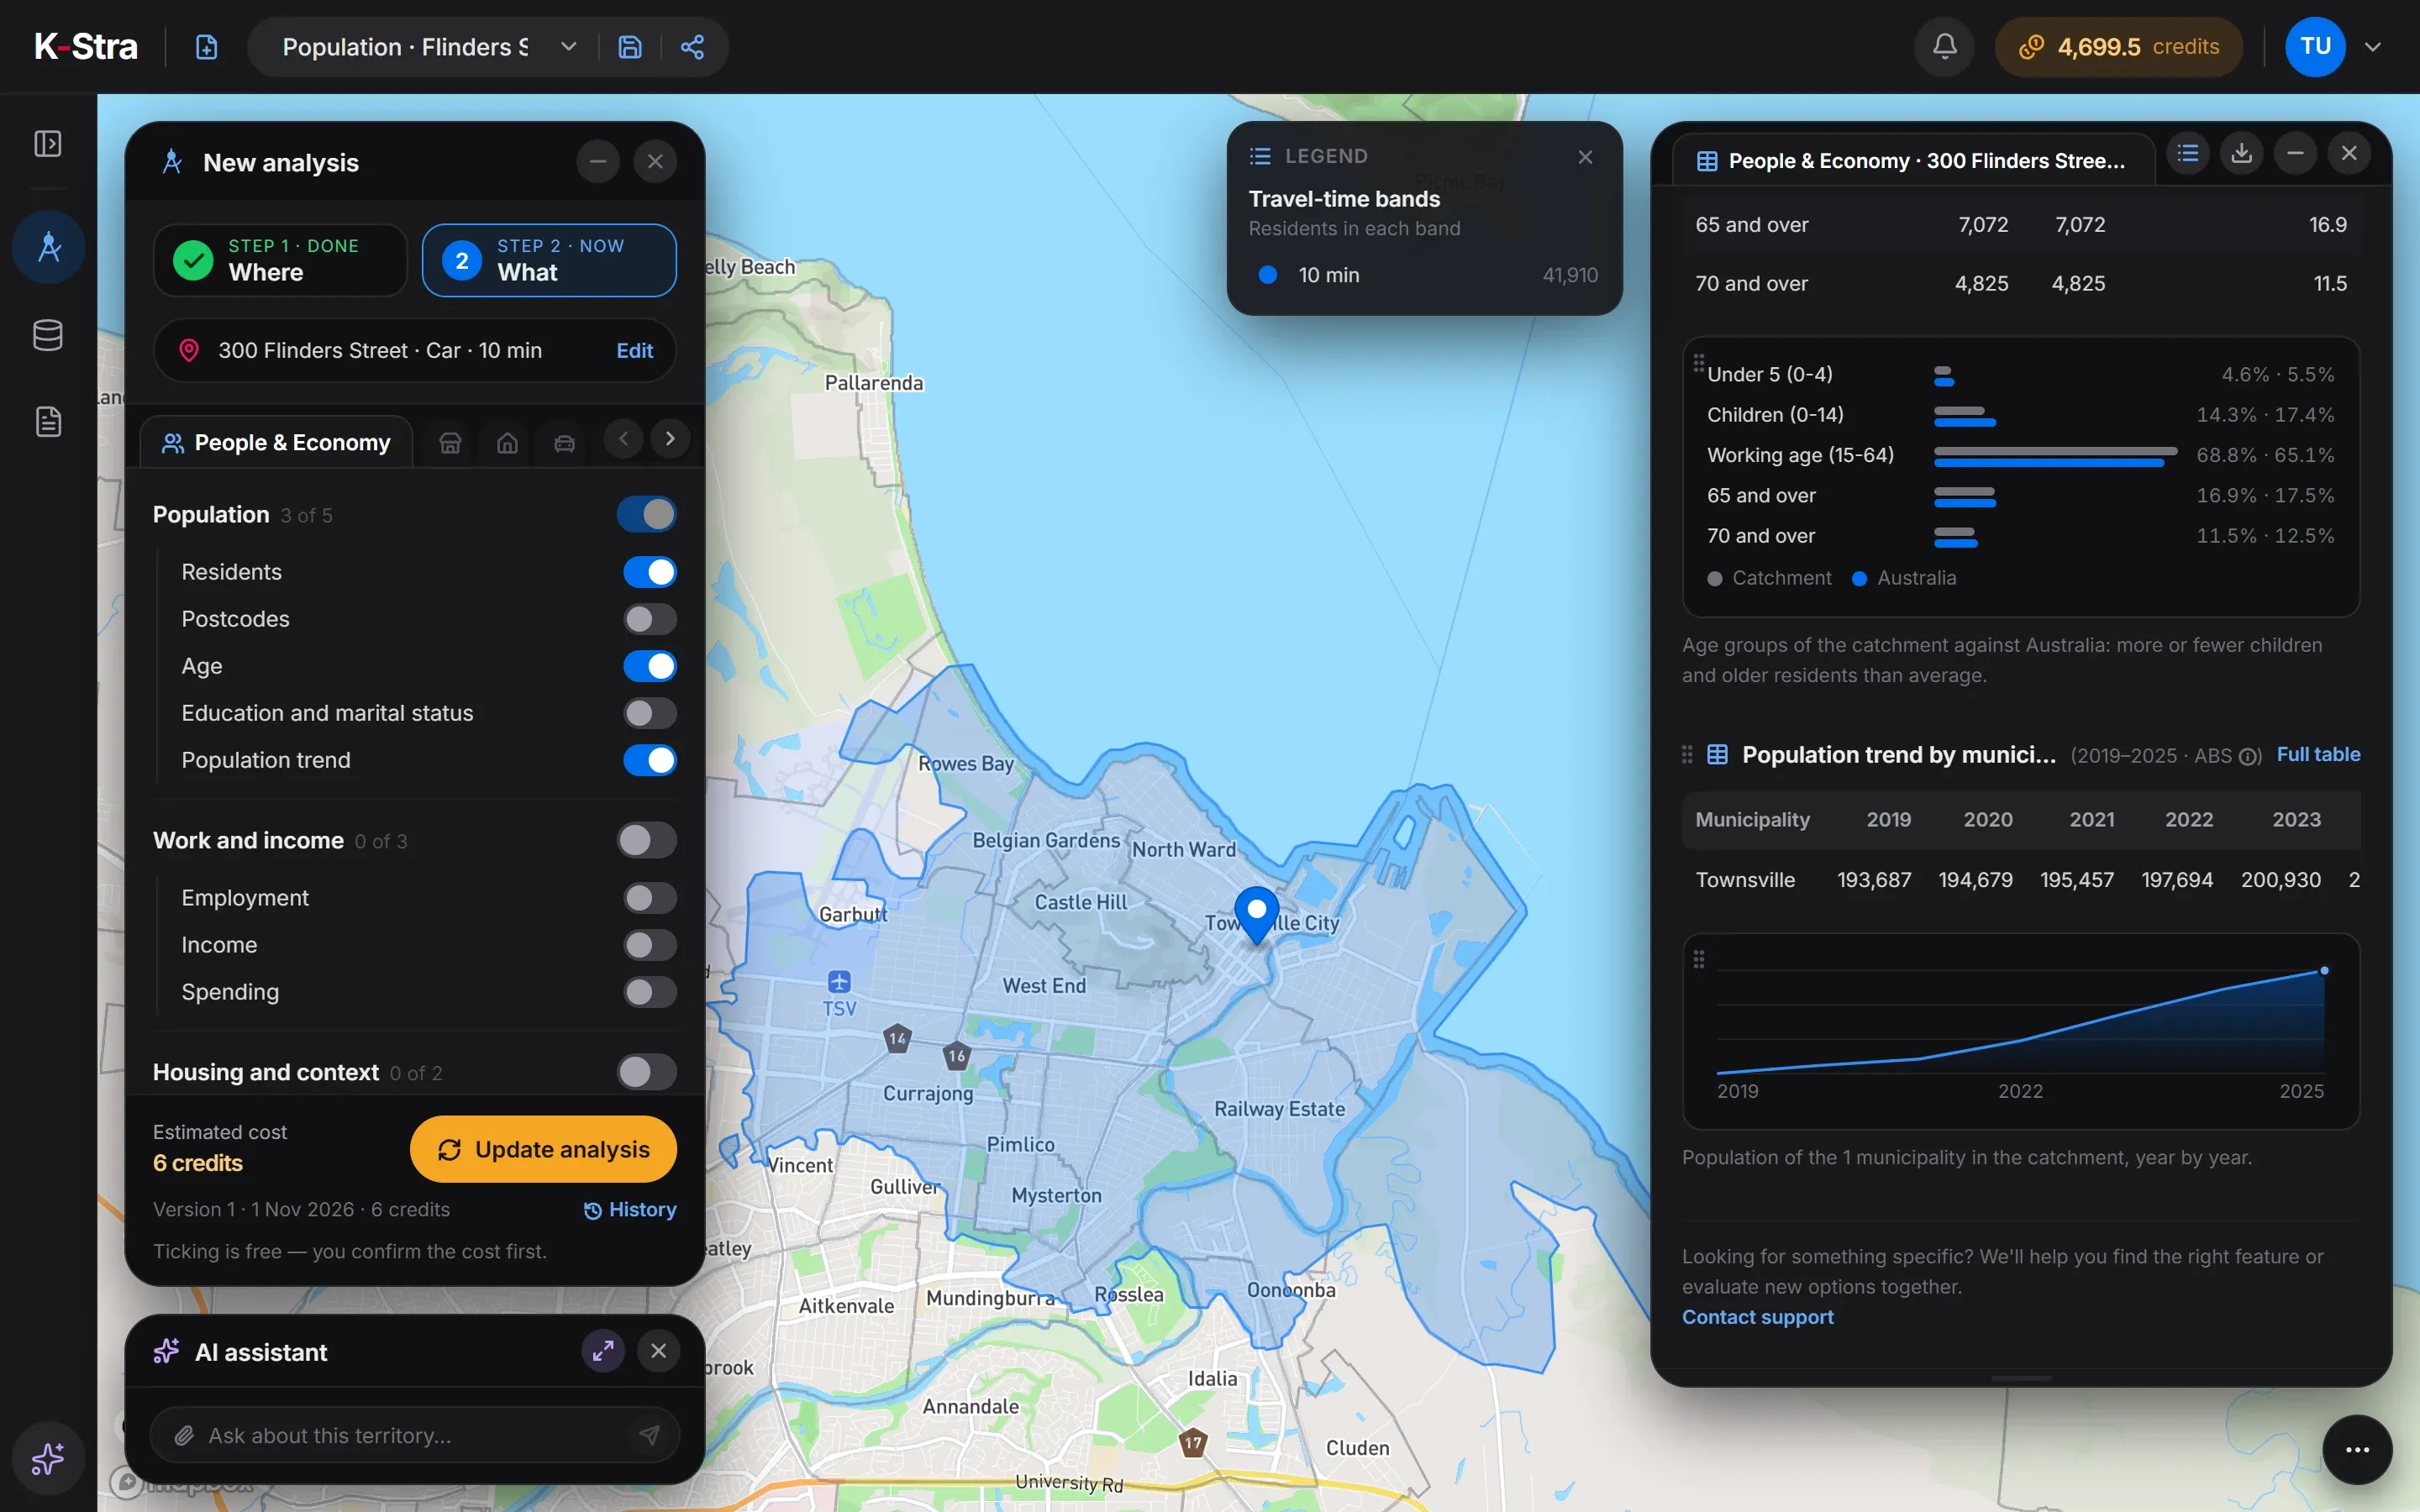 Townsville, QLD
Ten minutes by car from 300 Flinders Street, Townsville QLD reach 41,910 residents in 9,322 families. Their average age is 40.7, and 16.9% are aged 65 or over against 17.5% in Australia.
The City of Townsville grew from 193,687 residents in 2019 to 206,260 in 2025: 6.5% in 6 years, on average 1.08% a year. Children under 15 are 14.3% of the catchment, below the national 17.4%.
| 30 June | Residents |
|---|---|
| 2019 | 193,687 |
| 2020 | 194,679 |
| 2021 | 195,457 |
| 2022 | 197,694 |
| 2023 | 200,930 |
| 2024 | 203,972 |
| 2025 | 206,260 |
Source: K-Stra analysis of 1 November 2026; ABS Regional population and Regional population by age and sex, 30 June 2025.
When are the population sources updated?
| Source | Edition in K-Stra | Published | Next update of the source |
|---|---|---|---|
| ABS Regional population (Estimated Resident Population) | 30 June 2025, by council | 31 March 2026 | 25 March 2027 (30 June 2026) |
| ABS Regional population by age and sex | 30 June 2025 | 27 August 2026 | 31 August 2027 |
| ABS Census of Population and Housing 2021 | Census night, 10 August 2021 | 28 June 2022 | June 2027, first results of the 2026 Census |
The next council estimates, at 30 June 2026, are due on 25 March 2027, and the age and sex detail on 31 August 2027. The first results of the 2026 Census follow from June 2027; until then families, education and birthplace describe August 2021.
What else do people ask about population data?
Why do age and families come from different years?
The ABS estimates population, sex and age every year, but families, education and birthplace are measured only by the census, every five years. K-Stra uses the most recent of each: 30 June 2025 for the first, August 2021 for the second, and every table says which.
What is the old-age index?
The number of residents aged 65 and over for every 100 aged under 15. Above 100 there are more older residents than children. Around Flinders Street, Townsville, it is 118.
Can I see the population trend of a postcode or a suburb?
Not year by year. The ABS publishes yearly estimates down to councils and SA2 areas, and K-Stra shows the series for councils. Postcodes and suburbs take the 2025 total of their addresses, with no earlier years.
Does K-Stra count people who work or study in an area?
No. Every population figure counts residents, the people who usually live at an address. Workers, students, tourists and people passing through are not in any table.
Count who lives
around an address.
Type an address, keep the drive-time bands and switch on Residents and Age.
Open the app — free to exploreDrawing the area is free