
How big is the market for my business in an area?
Before a lease, a loan or a franchise fee, one number matters: how much the people around the site spend on what you sell.
The market potential of an area is what its residents spend each year on your category. Count the residents within a realistic drive time, multiply by local spending per head on that category, then compare the total with the stores already serving it. A large market with few stores is an opportunity; a large market already crowded is not.
Why is the size of a local market hard to estimate?
The numbers that are easy to find are the wrong size. National market reports cover the whole country, and a census table covers a council or a postcode, not the area your customers will actually drive from.
Spending is also uneven. Households in one suburb spend noticeably more on the same category than households fifteen minutes away, so a national average per head misses the local market in both directions.
And a market is only worth what the competition leaves. A large market with a store on every corner can be a worse bet than a smaller one nobody serves.
a year per resident goes to pet shops around Earlville, Cairns, out of A$48,056 of total household spending: 0.33%. The market is a thin slice that has to be measured, not guessed.
K-Stra analyses of 1 November 2026, 15 minutes by car from 537 Mulgrave Road, Earlville (Cairns) QLD: ABS national accounts 2025 by category, adjusted for the area, ABS population at 30 June 2025 and the K-Stra spending model for pet shops.
 Pet shops · Cairns
How do you estimate market potential, step by step?
Define the catchment
Draw the area customers will actually travel from: a drive or walk time from the site, in bands if distance matters.
Count the residents
Residents of each band, from current population estimates rather than the last census.
Find spending per head
What a resident spends each year on your category, adjusted for the area: income moves it up or down.
Multiply and add up
Residents times spending per head, band by band. That total is the market potential of the area.
Subtract the supply
List the stores already serving that spending and compare: spending per store, stores per 10,000 residents, against the region and the country.
Find where the gap is
Map where spending within reach is high and competition is thin. That is where an opening can win share.
Keep the number honest
Residents are only part of the trade: workers, visitors and passing traffic add to it, most of all in centres and tourist areas.
What data do you need to estimate market potential?
An address and a category. Everything else is public data, already prepared for the area you draw.
Residents within reach
ABS population estimates at 30 June 2025, counted inside the drive-time bands rather than whole postcodes.
Population dataSpending by category
ABS national accounts for 2025 across 13 categories, adjusted for each area by a local consumption index.
Income and spending dataThe stores already there
Businesses of your sector with address and status, to measure how much of the market is already served.
Markets dataA site, or several
The address you are weighing, or none: the analysis proposes the best locations within the area.
Retail site selection
K-Stra runs on a dedicated server in Sydney: your datasets, your analyses and your results stay in Australia. Map tiles, payments and sign-in never see your files. Three steps can: geocoding sends only the address text, and only after you confirm; the AI assistant reads column names and values when you ask it about a dataset; email notifications carry figures from your analysis.Where your data lives. Mark a dataset “session only” and it is deleted 24 hours after upload.
How do you estimate market potential in K-Stra?
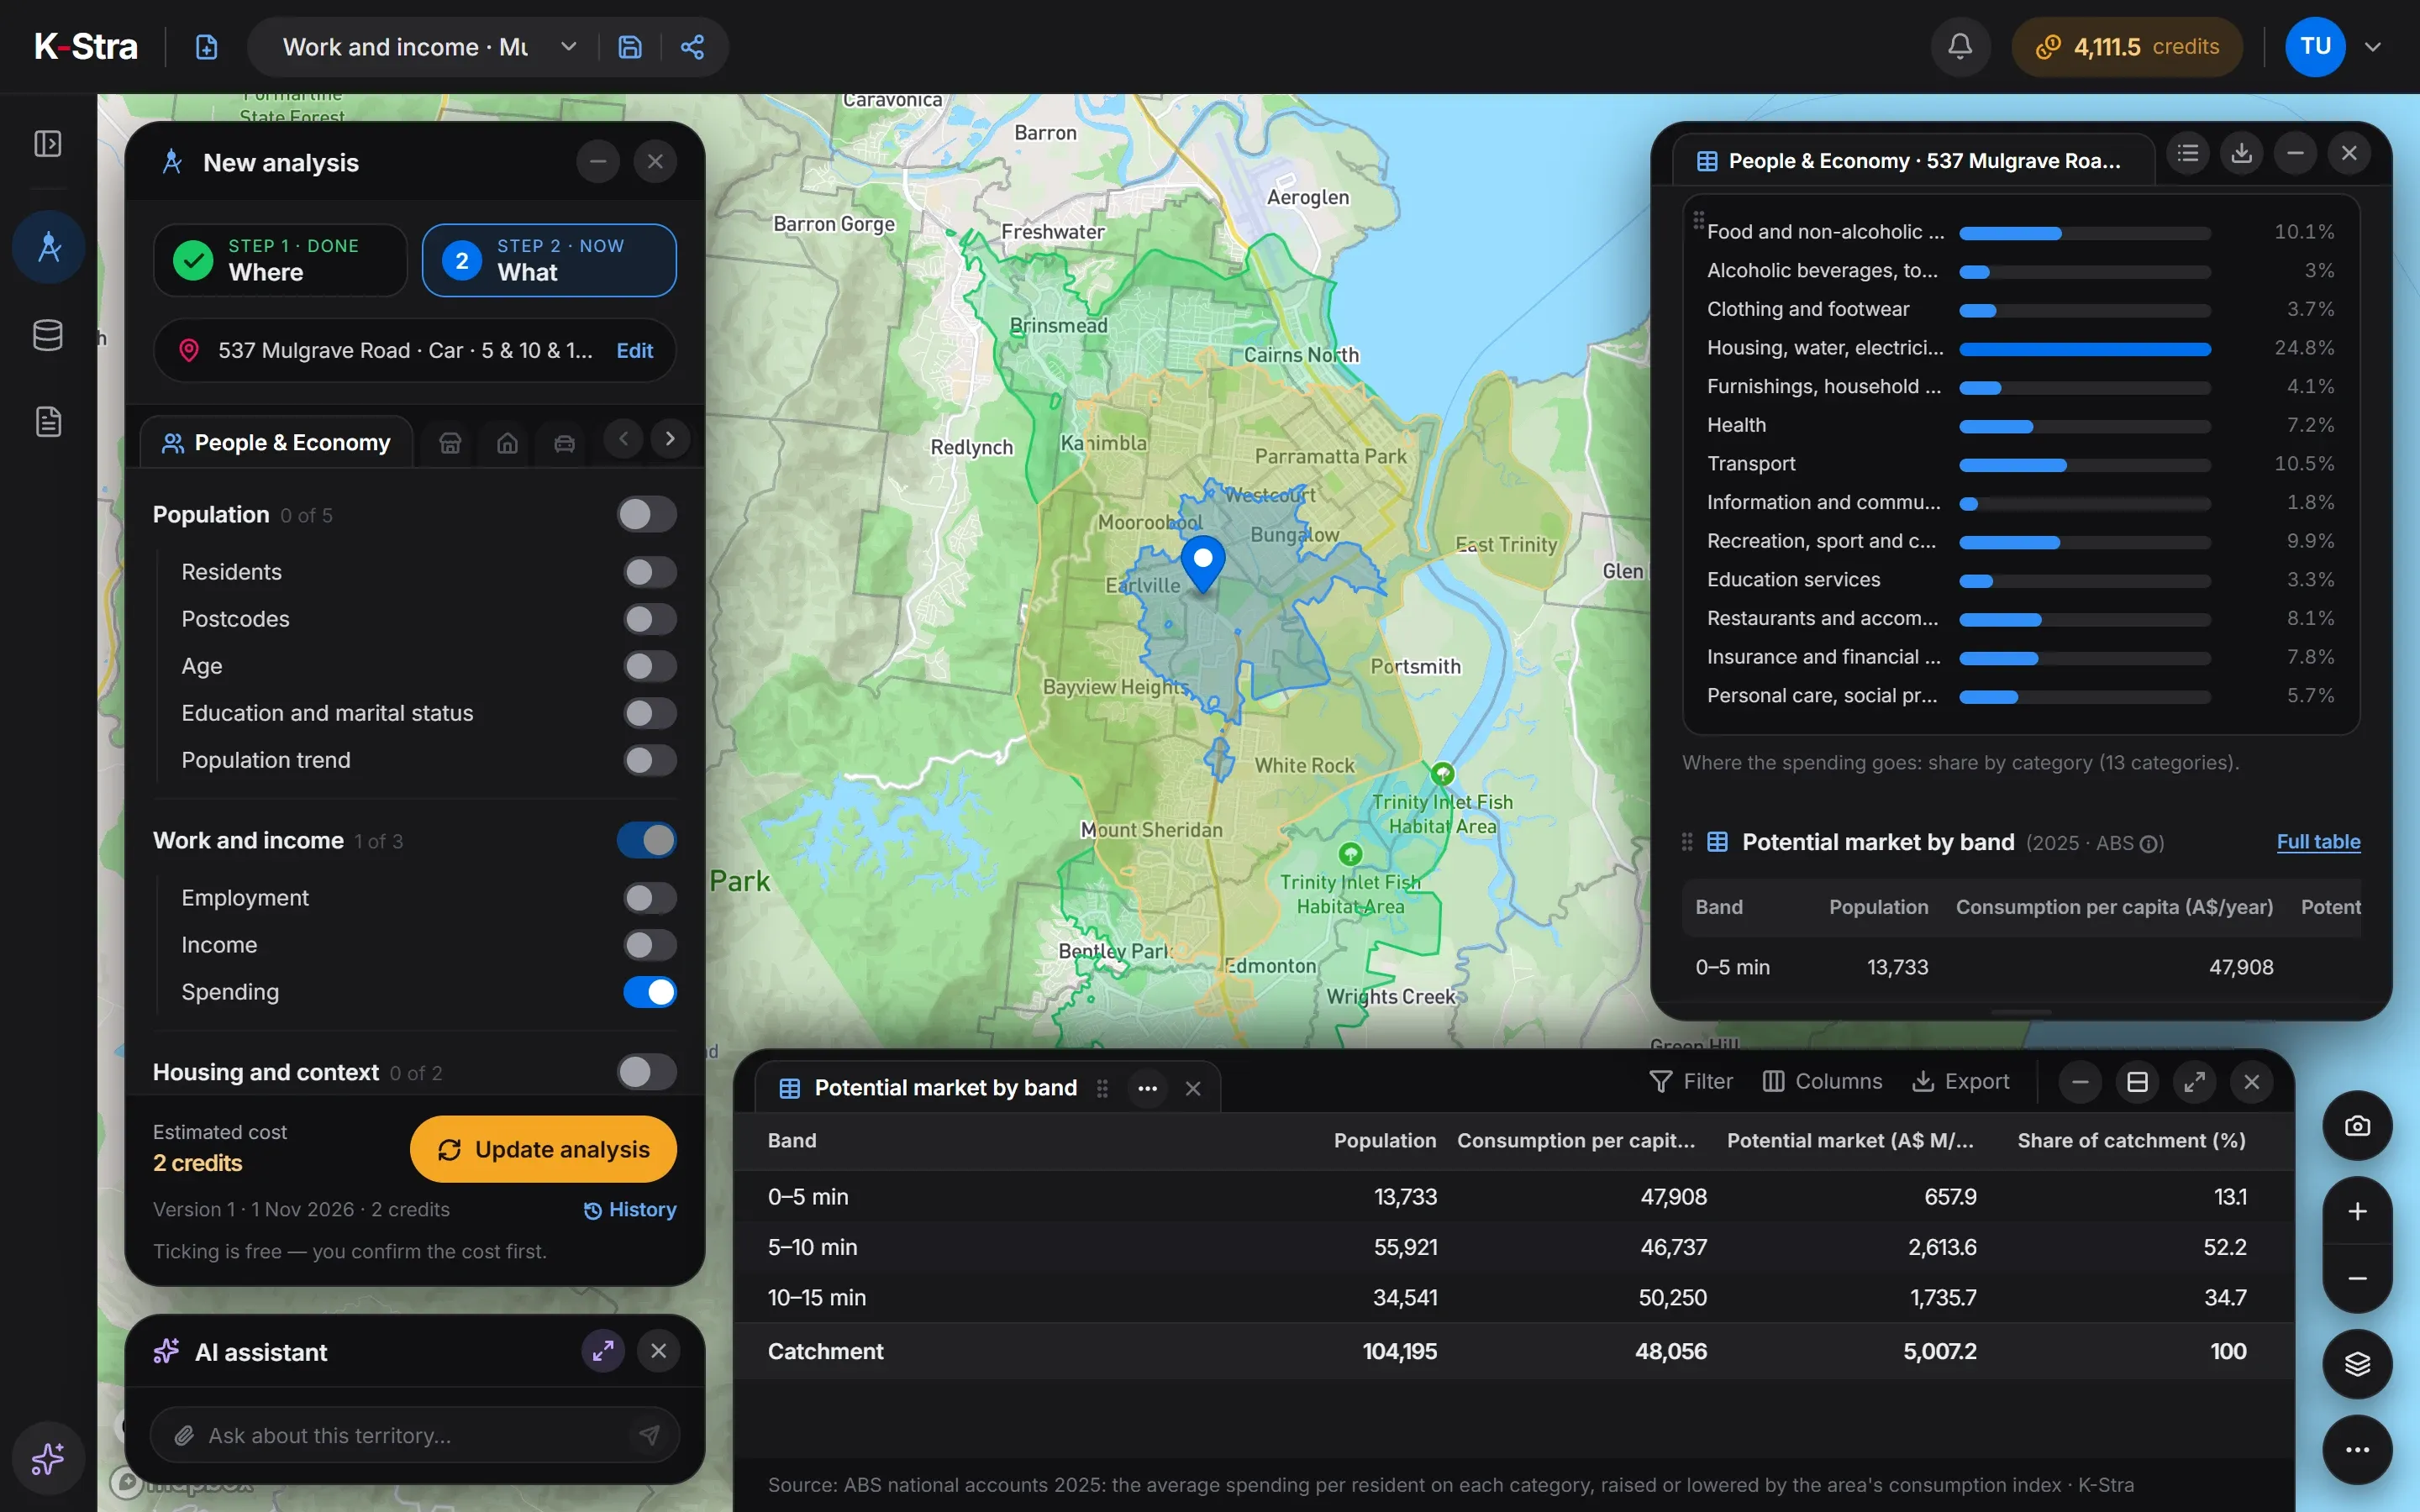
Two analyses on the same drive-time bands: People & Economy sizes the spending, Markets & Brands sets it against the stores of your sector.
- Draw the bandsPick the address and up to six drive, walk or distance bands. Drawing the area is free.
- SpendingIn People & Economy, the Spending topic gives spending per head and in total for 13 categories, and the potential market of each band. 2 credits per topic.
- Your sectorIn Markets & Brands, the whole sector gives demand, competition, stores per 10,000 residents and the five best locations. 40 credits per sector.
- Compare sitesAdd candidate addresses to see what each would capture and from whom, side by side.
The demand of a sector is the spending of the residents, modelled with ABS data. Workers, commuters and visitors are not in it, so in a centre or a tourist area it is a floor, not the whole trade.
What does a market potential analysis look like in the app?
Transcript
Markets & Brands shows who sells what around a place, and how much room is left. Pick an address and its catchment — here, a ten-minute walk from Smith Street, Collingwood — and choose a sector: fast food. You see the residents' yearly spending on fast food within reach, and how hard the outlets already there compete for it. The map shades every block by potential spend captured — the residents' spending a new outlet could win there — and lists the best addresses. Following particular chains instead? Pick up to ten brands and count their stores in each band, and per resident. Exploring and setting up are free. You only spend credits when you run the analysis.
What does a market potential estimate look like in numbers?
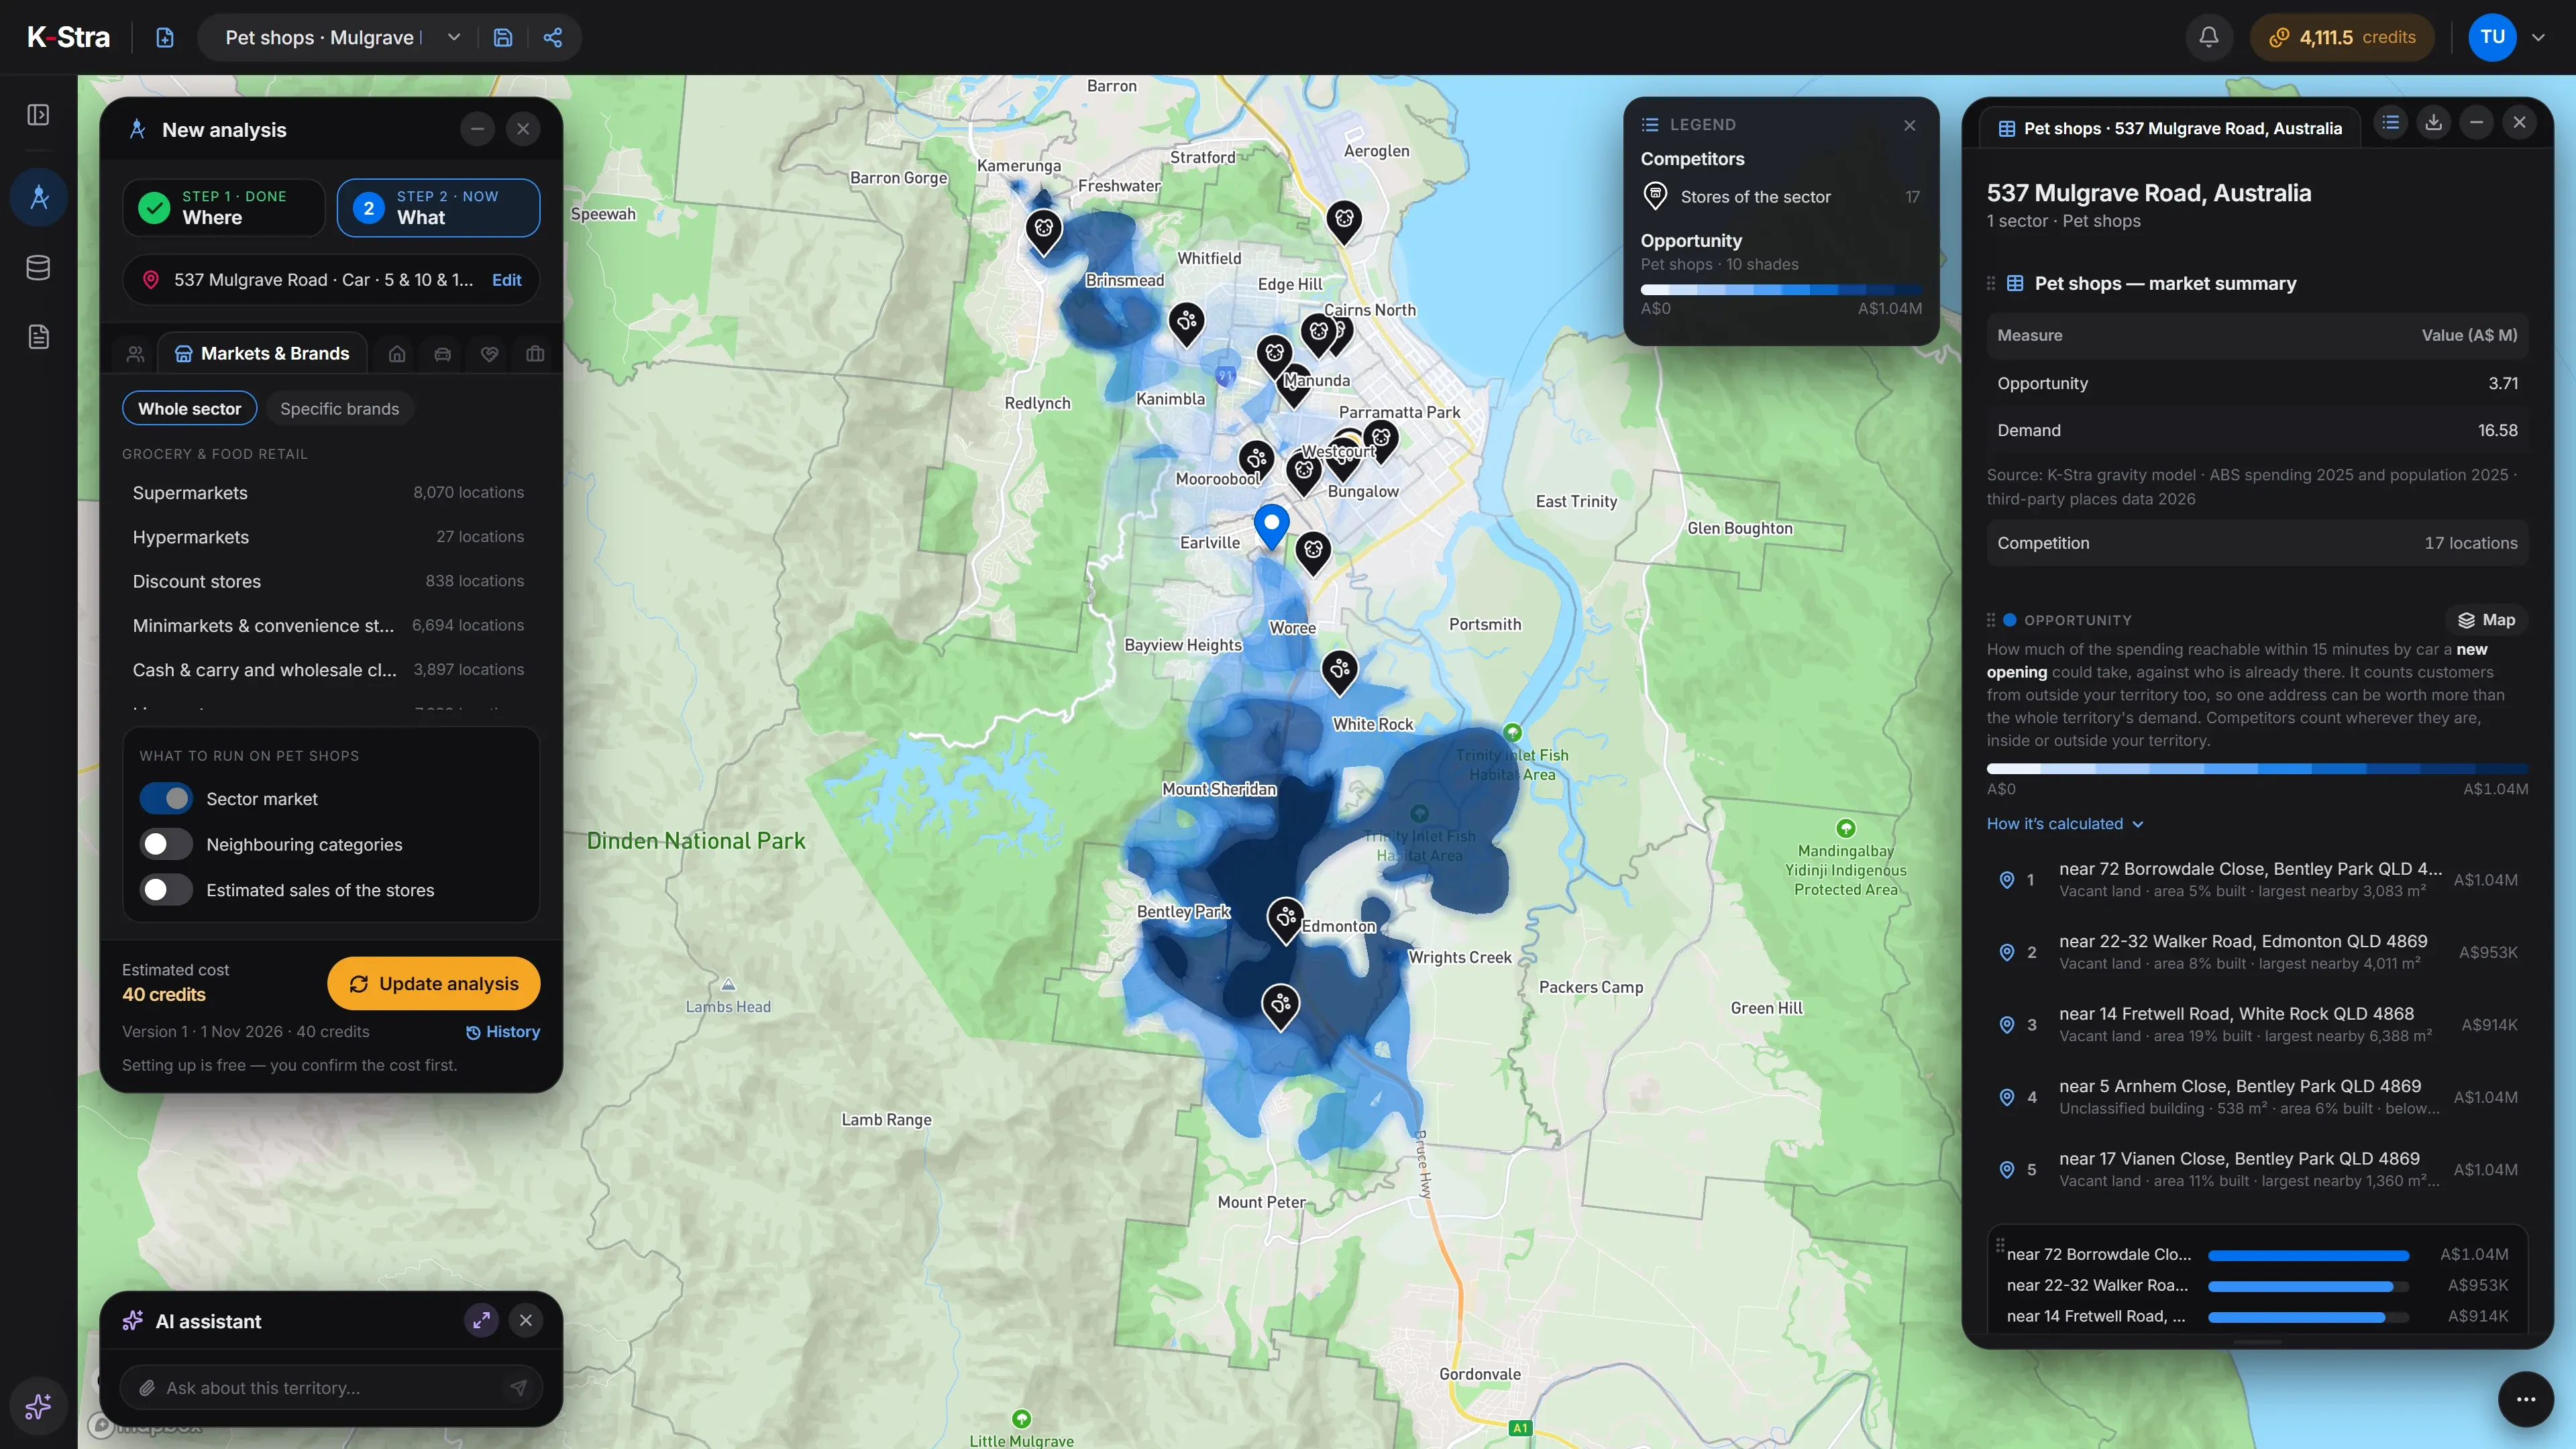
Pet shops within 15 minutes by car of 537 Mulgrave Road, Earlville (Cairns) QLD. 104,195 residents spend A$5,007.2 million a year in all, and A$16.58 million of it in pet shops. 17 stores already share that spending: about A$975,000 each, in an area with more pet shops per head than the state or the country.
| Measure | Value | Scope |
|---|---|---|
| Residents, 0–5 min | 13,733 | A$47,908 spent per head a year |
| Residents, 5–10 min | 55,921 | A$46,737 spent per head a year |
| Residents, 10–15 min | 34,541 | A$50,250 spent per head a year |
| Household spending, all categories | A$5,007.2M a year | 104,195 residents within 15 minutes |
| Of which recreation, sport and culture | A$495M a year | 9.9% of the total |
| Spending in pet shops (demand) | A$16.58M a year | about A$159 per resident |
| Pet shops in the catchment | 17 | A$975,000 of resident spending each |
| Pet shops per 10,000 residents, Catchment | 1.63 | 17 stores, 104,195 residents |
| Pet shops per 10,000 residents, Cairns (council) | 1.39 | 25 stores, 179,334 residents |
| Pet shops per 10,000 residents, Queensland | 1.33 | 752 stores, 5,669,764 residents |
| Pet shops per 10,000 residents, Australia | 1.17 | 3,236 stores, 27,613,654 residents |
Sources: K-Stra analyses of 1 November 2026; ABS national accounts 2025, spending per resident by category adjusted by the area’s consumption index; ABS population at 30 June 2025; public online business listings, 2026; K-Stra spending model for pet shops.
What does the estimate say about pet shops in Cairns?
The market is real but already served. With 1.63 pet shops per 10,000 residents against 1.17 across Australia, the area around Earlville has more stores per head than the country, and many of them cluster north of the site, around Westcourt and Manunda.
A new store near the existing ones would split the same A$16.58 million more ways. The question is not whether there is a market, but where in the catchment the spending is least served.
The opportunity map answers it: the best locations are in the south, near Bentley Park, Edmonton and White Rock. The model puts what an opening near 72 Borrowdale Close, Bentley Park could capture at about A$1.04 million a year of residents’ spending.
The market gap, spending within reach for each unit of competition, peaks at 258 near Mount Sheridan, where 100 is the typical spot of this analysis. These are figures to compare sites with, in the same sector and the same area; their absolute value is an order of magnitude.
How much does a market potential analysis cost?
The size of the area never changes the price: three bands over 127 km² cost the same as one band over a few streets.
Spending on its own, without the sector, costs 2 credits and gives the potential market for all 13 categories.
- People & Economy, Spending topic2 credits per topic2 credits
- Markets & Brands, one sector40 credits per sector40 credits
- Drive-time bands, map, tables and exportsFree
- This estimate= 42 credits
- ≈ A$64 at the Single report pack rate of A$1.53 a credit; less with larger packs and monthly plans.
Each analysis shows its cost before it runs; a failed run costs nothing.
What else do people ask about market potential?
What is the difference between market potential and market share?
Market potential is the whole spending of an area on a category. Market share is the part of it a business actually takes. You need the first to judge a site and your own sales, or loyalty data, to measure the second.
Where does the spending per head come from?
From ABS national accounts for 2025, spending per resident by category, raised or lowered for each area by a local consumption index built from income. For a sector, a spending model assigns the share of each category that goes to that kind of store.
Does market potential include tourists and workers?
No. It is the spending of the people who live in the area. In a city centre, a tourist strip or near a station the real trade is larger, so read the number there as a floor.
Which drive time should I use?
The time your customers will travel for your category: a few minutes on foot for a café, ten to fifteen by car for a supermarket, more for a specialist store. Bands of 5, 10 and 15 minutes show how fast the market grows with distance.
What does captured spending measure, and what does it leave out?
It is the potential spending of the catchment’s residents that a site would capture: a figure for comparing sites of the same sector and area, whose absolute value is an order of magnitude. Workers, commuters, tourists and passing trade are not in it, so CBD, tourist and station sites come out underestimated.
Know the size of the market
before you sign.
Draw the drive times around your site and see what residents spend on your category, and who already serves it.
Open the app — free to exploreSpending 2 credits, a sector 40