
What are income and consumption indices, and how do you read them?
Counting residents tells you how big a market is. Indices tell you how much each of them can spend, on one scale for every area of Australia.
An income index compares the income per head of an area’s residents with the Australian average, set at 100; a consumption index does the same for spending per head. An area at 120 has residents earning or spending a fifth more than the average. Indices make areas of any size comparable, and turn national spending totals into local markets.
Why use an index instead of dollars?
Dollar figures date quickly and depend on the year, the survey and whether they count households or people. An index removes all of that: it only says how an area compares with the country, so a suburb, a catchment and a state can sit in the same table.
Indices also connect national statistics to local ones. The ABS measures household spending for Australia as a whole; multiplying the national figure per head by an area’s consumption index gives an estimate of spending per head in that area.
That is how demand is built in geomarketing. Residents times spending per head gives the money available; shared out by category, it becomes the market for supermarkets, pharmacies or gyms in each catchment.
How are income and consumption indices calculated?
In K-Stra the income index comes from ABS personal income data, drawn from tax returns for 2022–23. Where the ABS publishes it — 543 councils and 2,405 SA2 areas — it is measured; elsewhere it is estimated, and on average the estimate sits about ten points from the measured value where both can be compared.
The consumption index is derived from the income index, because household spending is not measured below state level. The relation used is consumption = 0.937 × income + 5.98: an area at 120 for income sits at about 118.4 for spending, one at 80 at about 80.9.
Spending per head then follows from the national accounts. With Australian spending of A$52,583 per resident for 2024–25, an area with a consumption index of 110 spends about A$57,841 per resident a year.
Both indices are weighted by population, so 100 is the average Australian, not the average area. A remote area with few residents counts for little in the average, a populous suburb for a lot.
How do the indices compare across Australia?
Income and consumption indices from K-Stra analyses of different places. Where an analysis showed spending per resident instead of the index, the index is worked out from it.
| Area | Income index | Consumption index | Analysis |
|---|---|---|---|
| 482 Auburn Road, Boroondara (VIC), 10 minutes by car | 120.9 | 119.6 | 7 October 2026 |
| Victoria Street, Mackay (QLD), 20 minutes by car | 108.9 | 108.3 | 1 November 2026 |
| Elizabeth Street, Hobart (TAS), 10 minutes by car | 97.2 | 97.3 | 31 October 2026 |
| Tasmania | 90.3 | 90.6 | 31 October 2026 |
| City of Palmerston (NT) | — | 123 | 31 October 2026 |
| Australia | 100.0 | 100.0 | — |
Sources: K-Stra analyses of the dates shown. Income index from ABS Personal Income 2022–23, measured or estimated; consumption from the index and ABS national accounts (5204.0) for 2024–25. Mackay’s consumption index is its spending per resident, A$56,965, against A$52,583; Tasmania’s is calculated from its income index with the relation above. Palmerston’s comes from the free area dashboard.
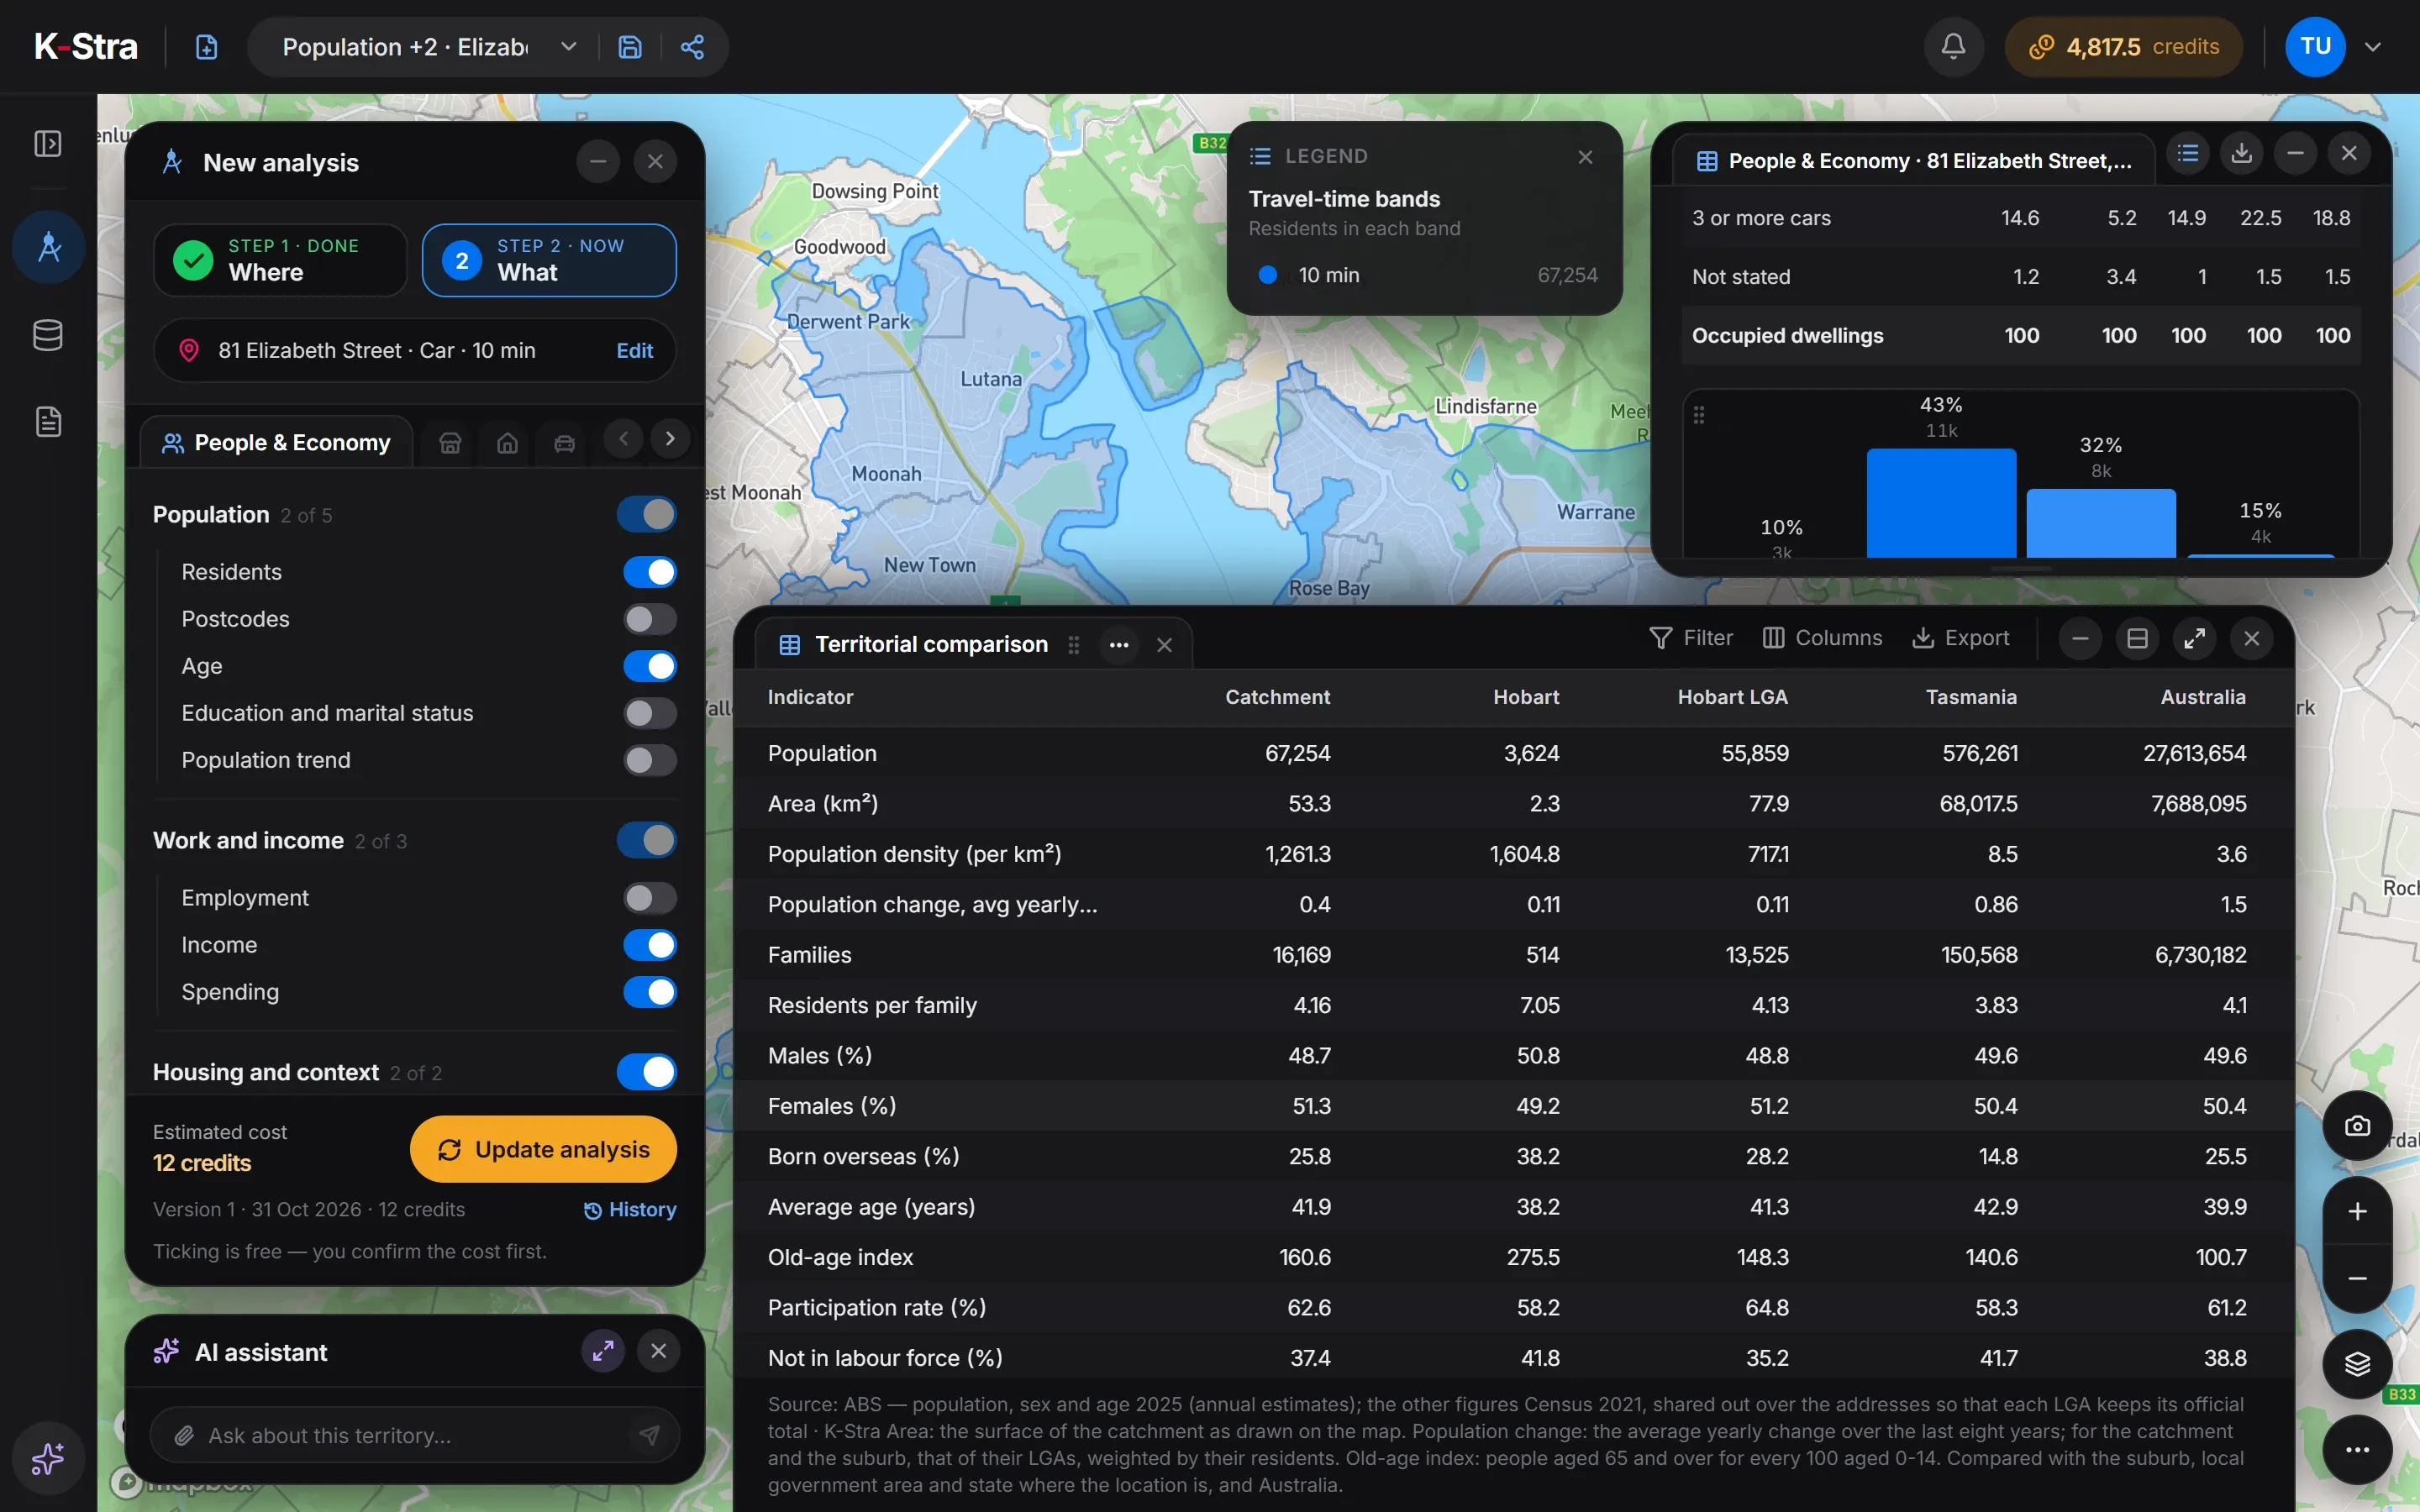 Compare with the area · Hobart
What do these indices say about each market?
The eastern Melbourne catchment earns a fifth above the average and spends about the same margin above it. Hobart’s centre sits just below 100 although Tasmania as a whole is at 90.3: capital cities lift their surroundings, and a state average hides that.
Palmerston, near Darwin, shows the other use of the index: at 123, a young population of 43,193 spends well above the national average per head. For a business, the same number of residents is worth more money there than in most regional towns.
What else do people ask about income and consumption indices?
What does an income index of 100 mean?
That residents of the area have the same income per head as the average Australian, weighted by population. 110 means ten per cent above, 90 ten per cent below. The index says nothing about how income is spread within the area.
Why is the consumption index closer to 100 than the income index?
Because spending varies less than income: households with higher incomes save a larger part of them, and households with lower incomes spend most of theirs. In K-Stra a 10-point gap in income becomes a gap of about 9.4 points in spending.
Where does the income data come from?
From ABS personal income statistics based on tax returns, for 2022–23. They are published for 543 councils and 2,405 SA2 areas; elsewhere the value is estimated, and the estimate is rougher.
Can I see income bands, such as households earning over A$150,000?
Not in K-Stra: it works with income per head as an index, not with income classes. The ABS Census publishes household income bands for areas, which can be loaded as your own data if you need them.
See how much
an area can spend.
Draw a catchment and read its income and consumption indices beside the council, the state and Australia.
Open the app — free to exploreExploring the map is free; you pay only for the analyses you run