
Demand
Who lives there, and how much they spend
Residents, families, ages, income and spending power from ABS data, counted on 14.5 million address points.
Sources and yearsA catchment area is where most of your customers come from. Here is how to measure it properly, and how to do it in K-Stra.
A catchment area is the territory from which a store draws most of its customers, measured as drive-time or walk-time bands on the real road network rather than as a radius. Count what each band holds — residents, families, income, spending potential and competitors — and compare the bands to see where demand thins out.
A 3 km circle ignores rivers, motorways and one-way streets. Two addresses the same distance away can be a few minutes or a long detour from your door, and the circle treats them the same.
People decide on time, not kilometres. The band that matters for a supermarket is often around ten minutes by car; for a café it may be five minutes on foot.
A circle also counts land, not homes. Methods that slice census areas by their surface give a park, a business estate or a stretch of water the same residents per square metre as the streets around it.
Get the shape wrong and every number inside it is wrong too: population, spending and the competitors you think you face.
of Australia’s 14.5 million address points have at least one resident (8.9 million). The rest are shops, offices, warehouses and other non-residential addresses.
Address points from Overture Maps; residents spread with ABS data (K-Stra territory v5, 30 September 2026).
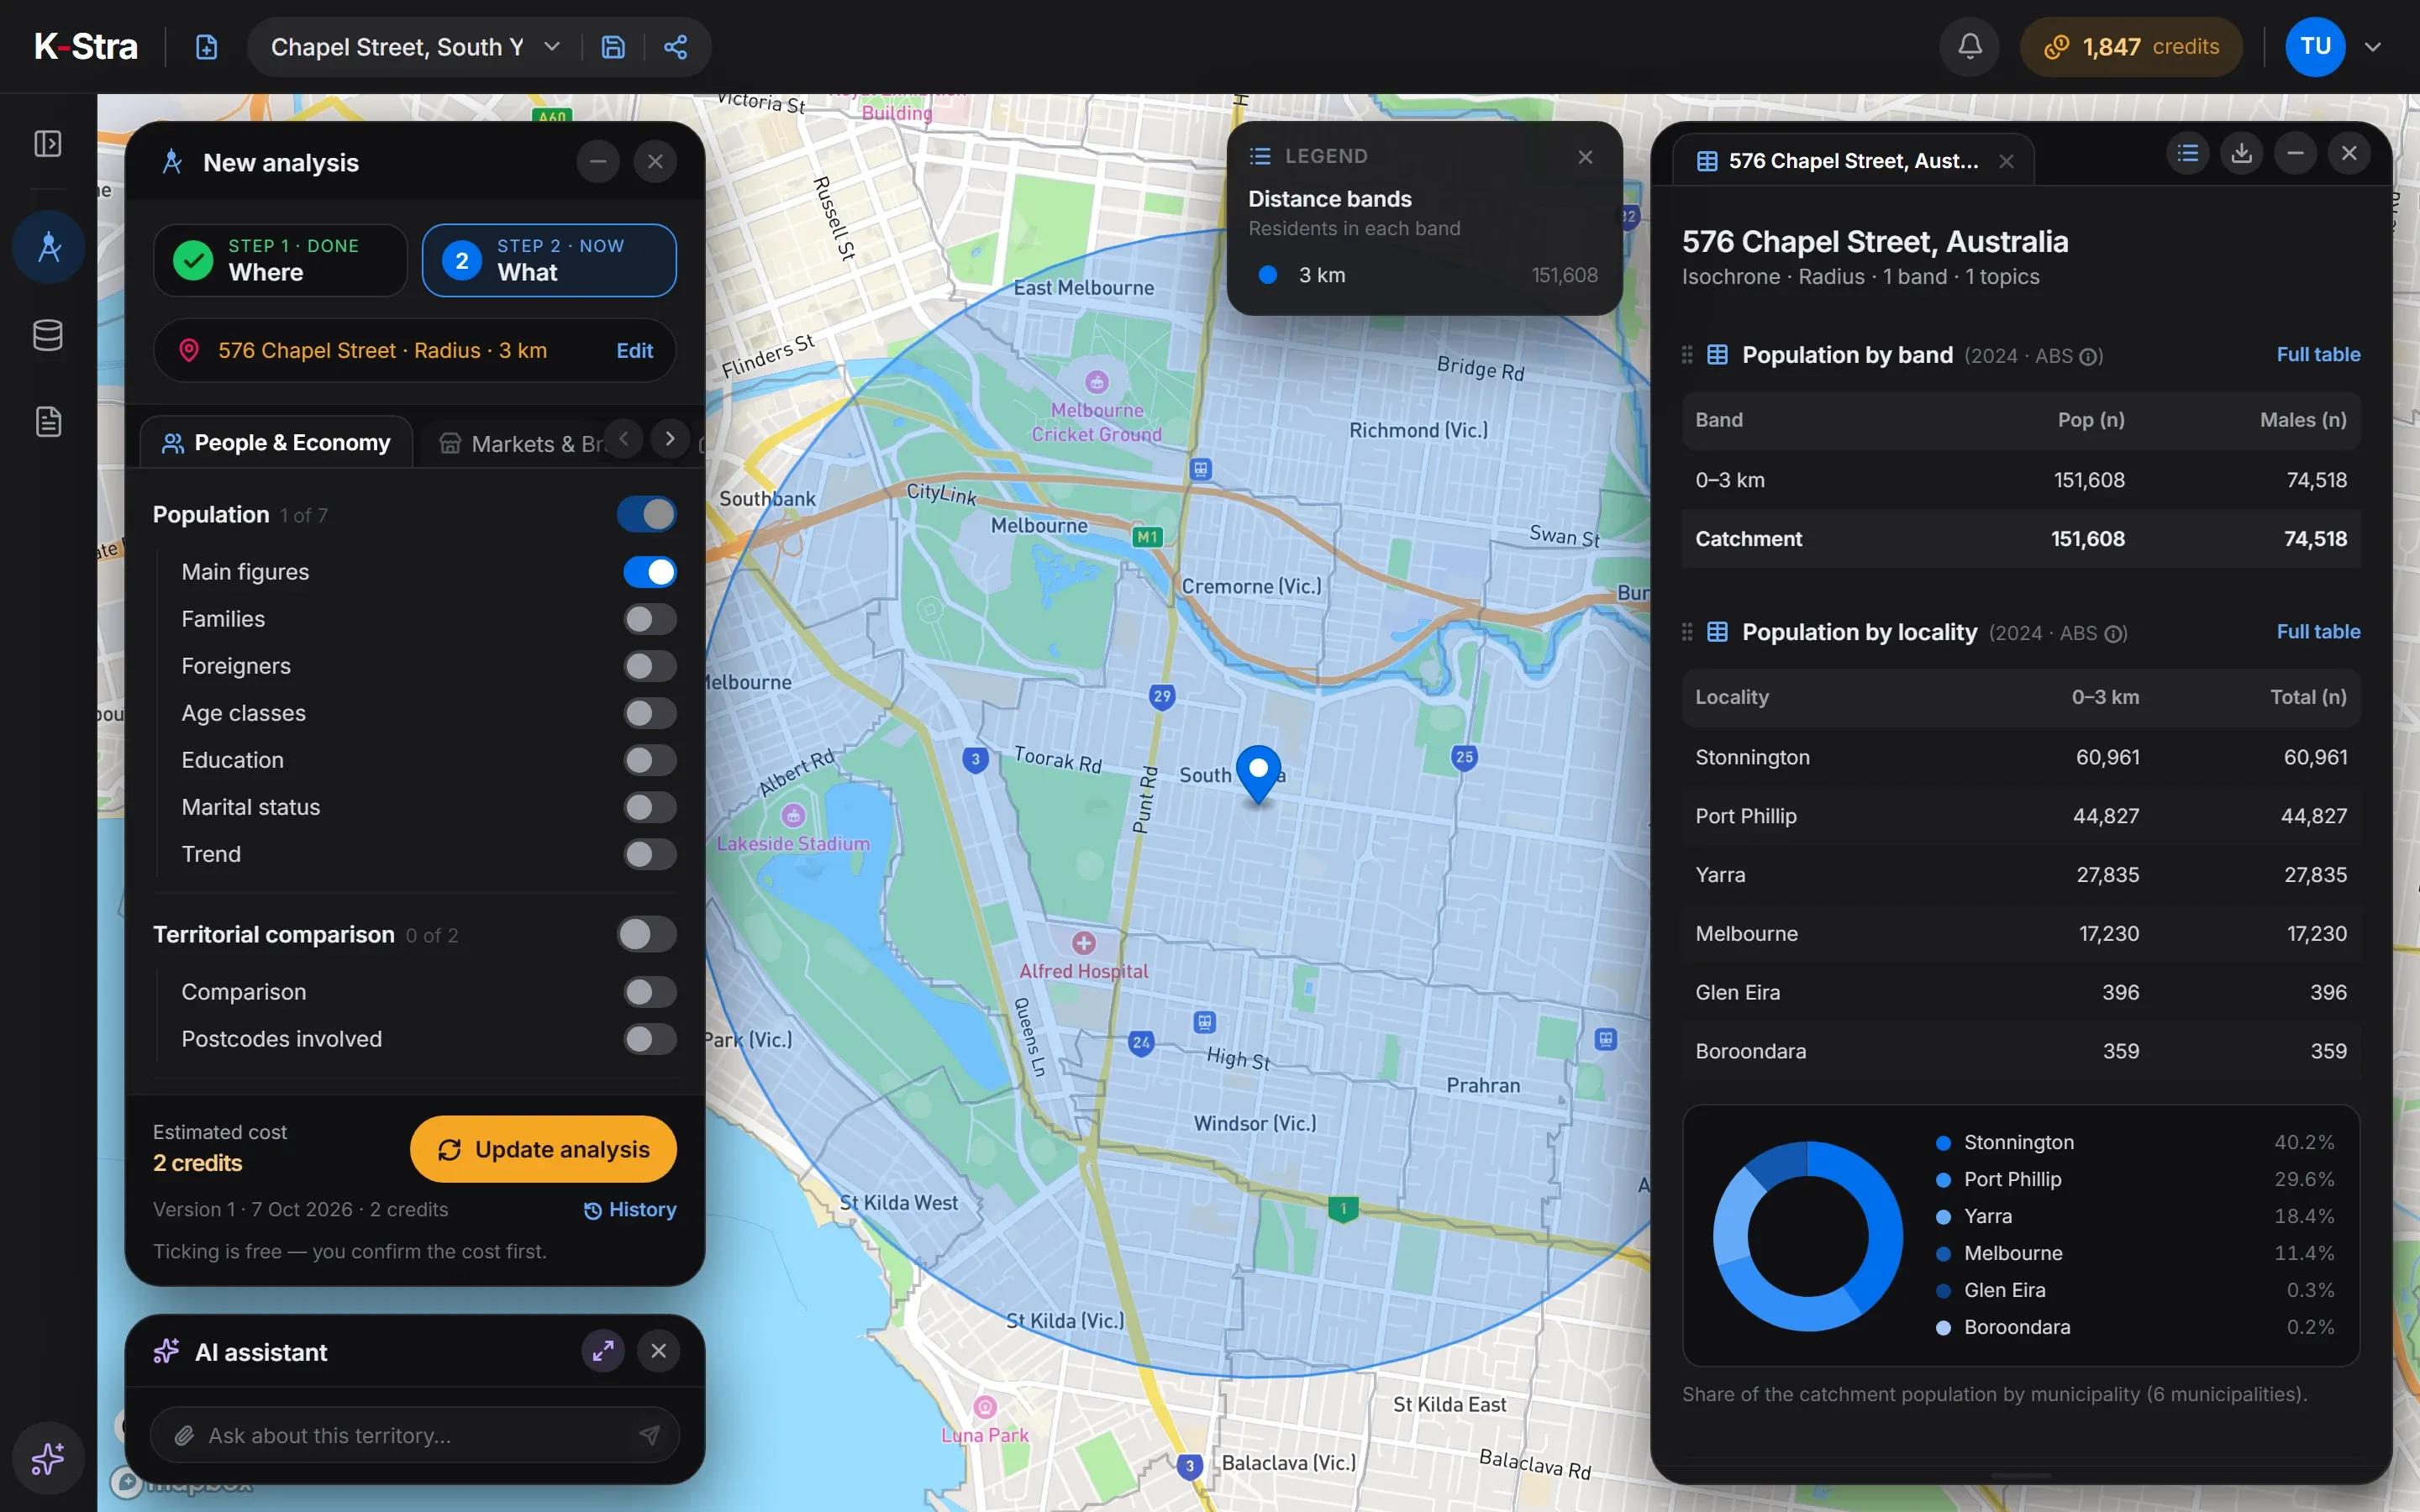 The guess
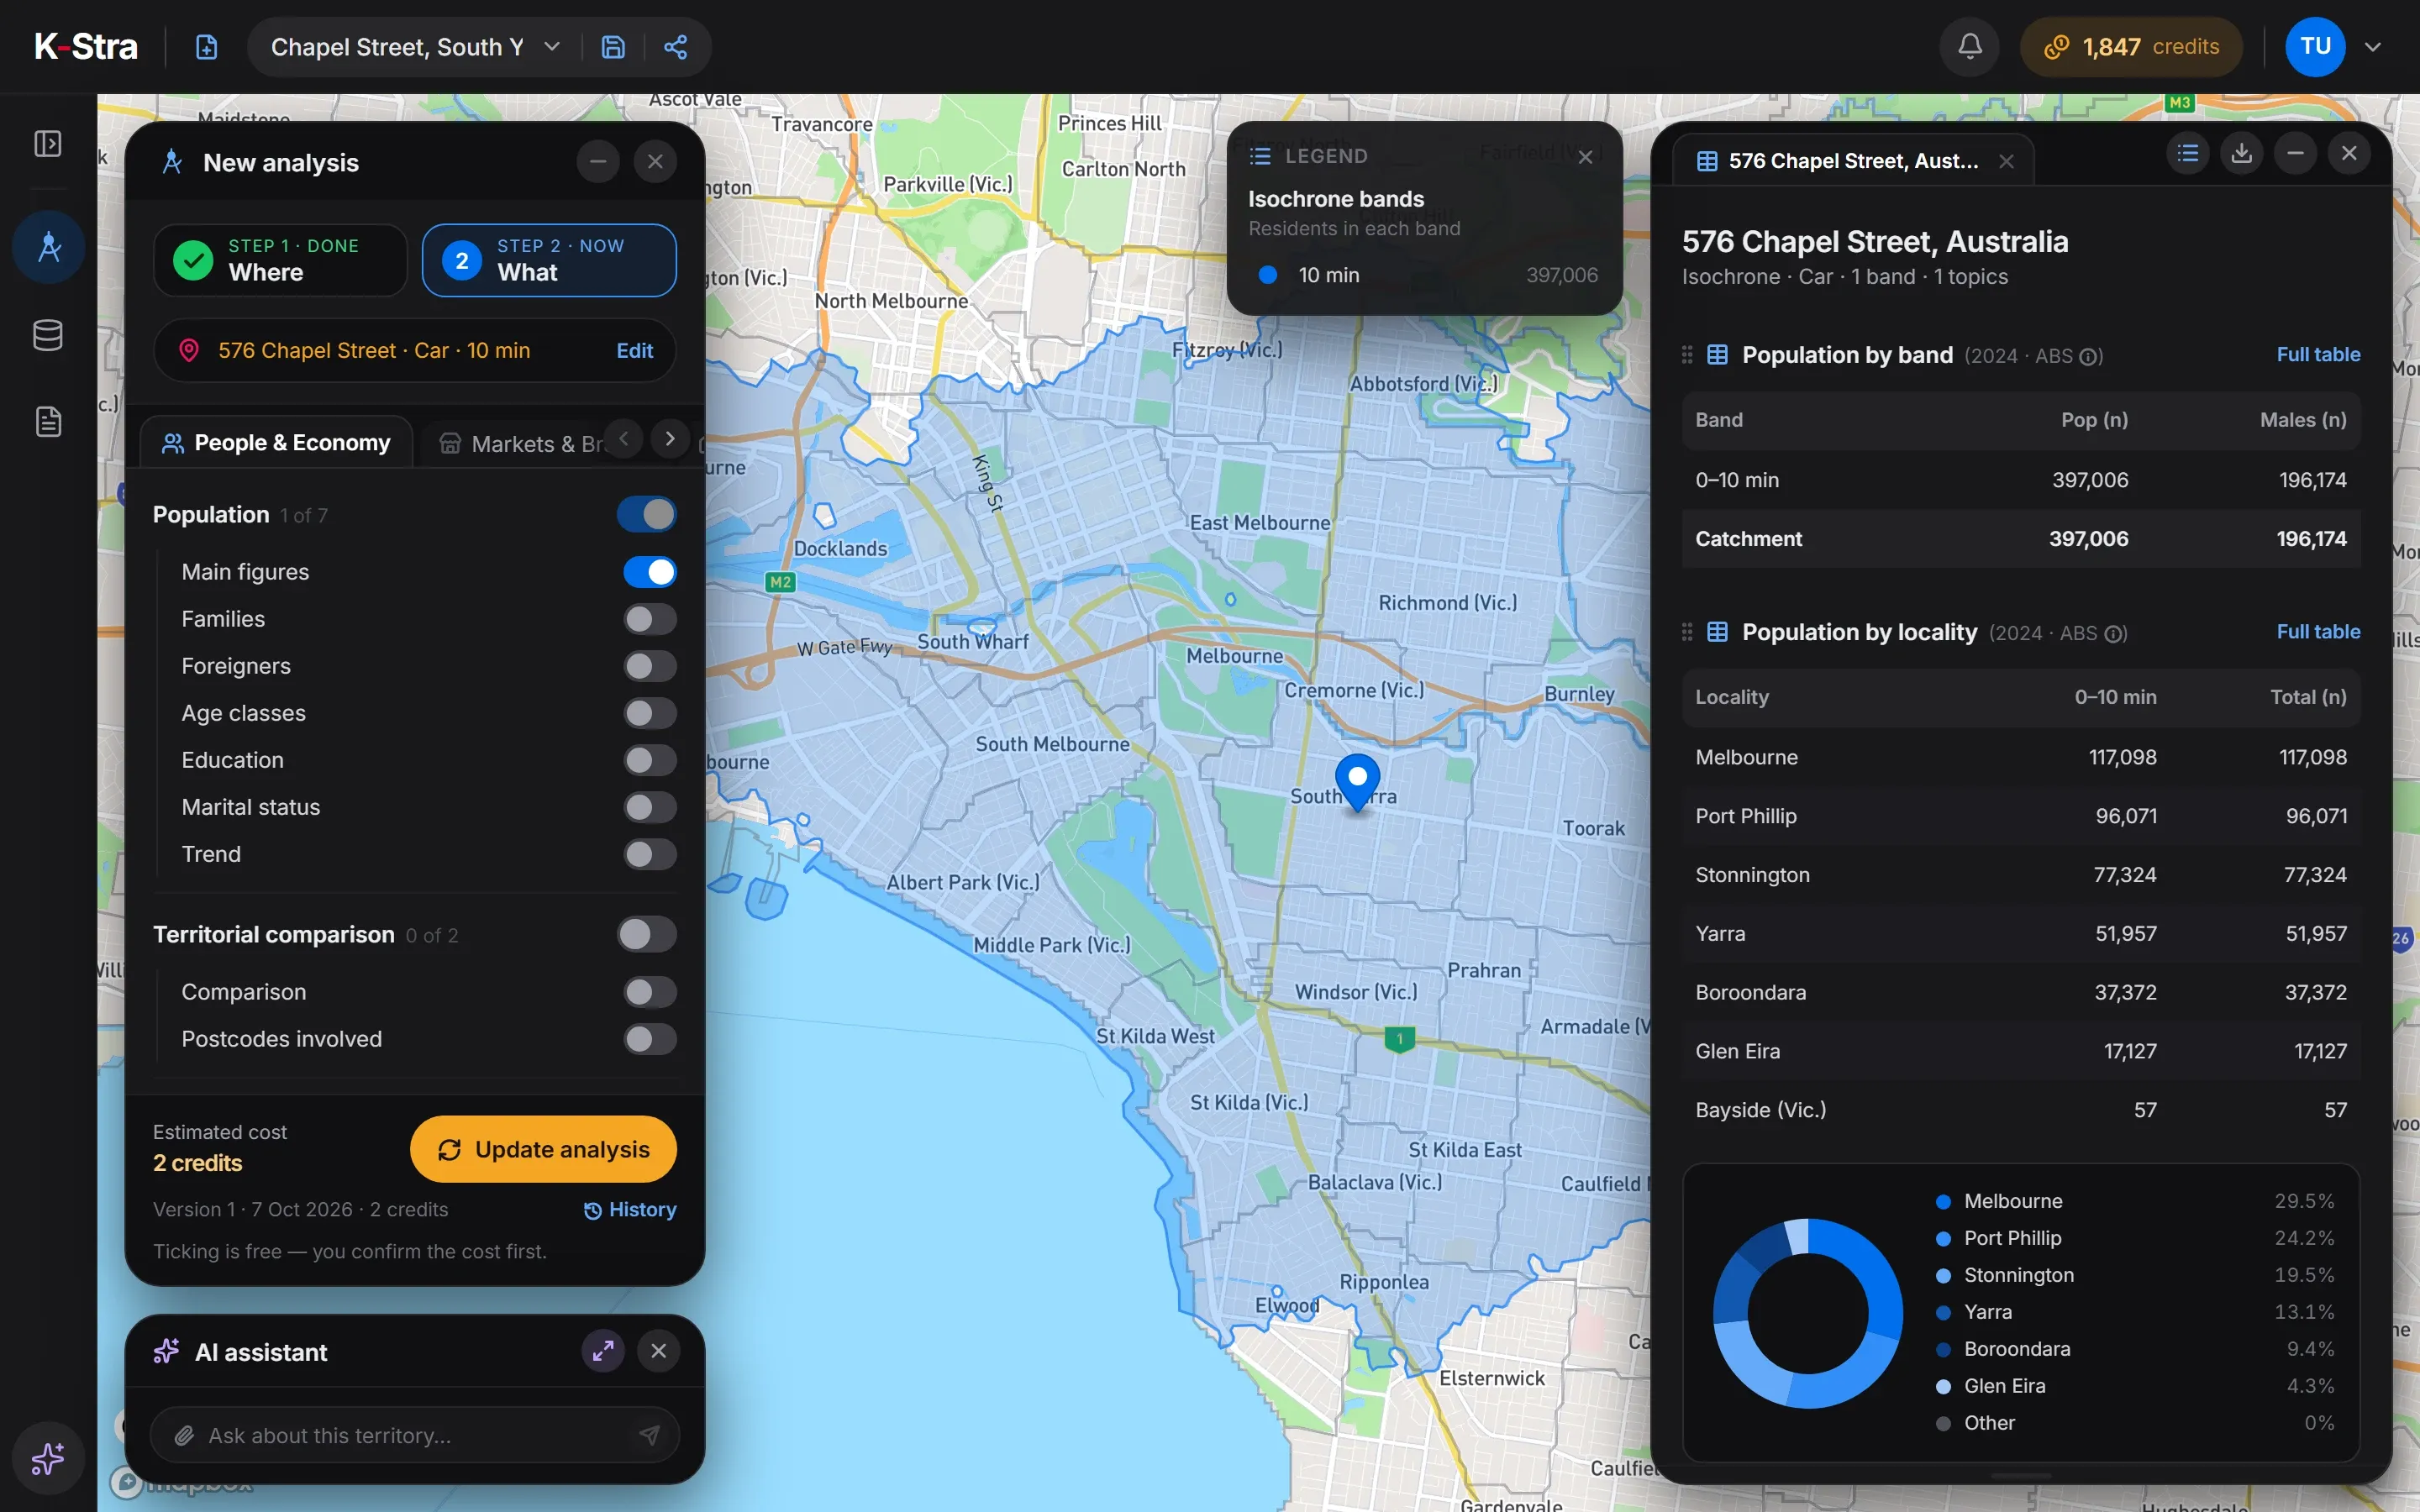 Road network
The exact address of the store or of the site you are considering, not the centre of the suburb.
Car with or without motorways, or walking; normal or heavy traffic for cars. Five, ten and fifteen minutes are a good start.
Bands that follow real roads and travel times, not straight lines drawn with a compass.
Residents and families for each band, added up address by address rather than estimated from a share of the surface.
Income and spending indices tell you how much the people inside each band can actually spend.
Count competitors band by band and see where the market is already crowded.
Where residents and spending stop growing from one band to the next, your realistic catchment ends.
Inside each band you measure two things: the demand of the people who live there and the supply of the stores already competing for them. Each number you see should carry its source and its year.
Residents, families, ages, income and spending power from ABS data, counted on 14.5 million address points.
Sources and yearsMore than 2 million Australian businesses and stores, searchable by sector or by brand and updated every month.
Sources and yearsOpportunity is where demand outweighs supply: for each consumer sector, a spending model sets the two against each other, colours the gap on the map and lists the five best locations.
The bands themselves come from road-network travel times: by car, by car avoiding motorways or on foot, with normal or heavy traffic for cars, in up to six bands from 0 to 120 minutes.
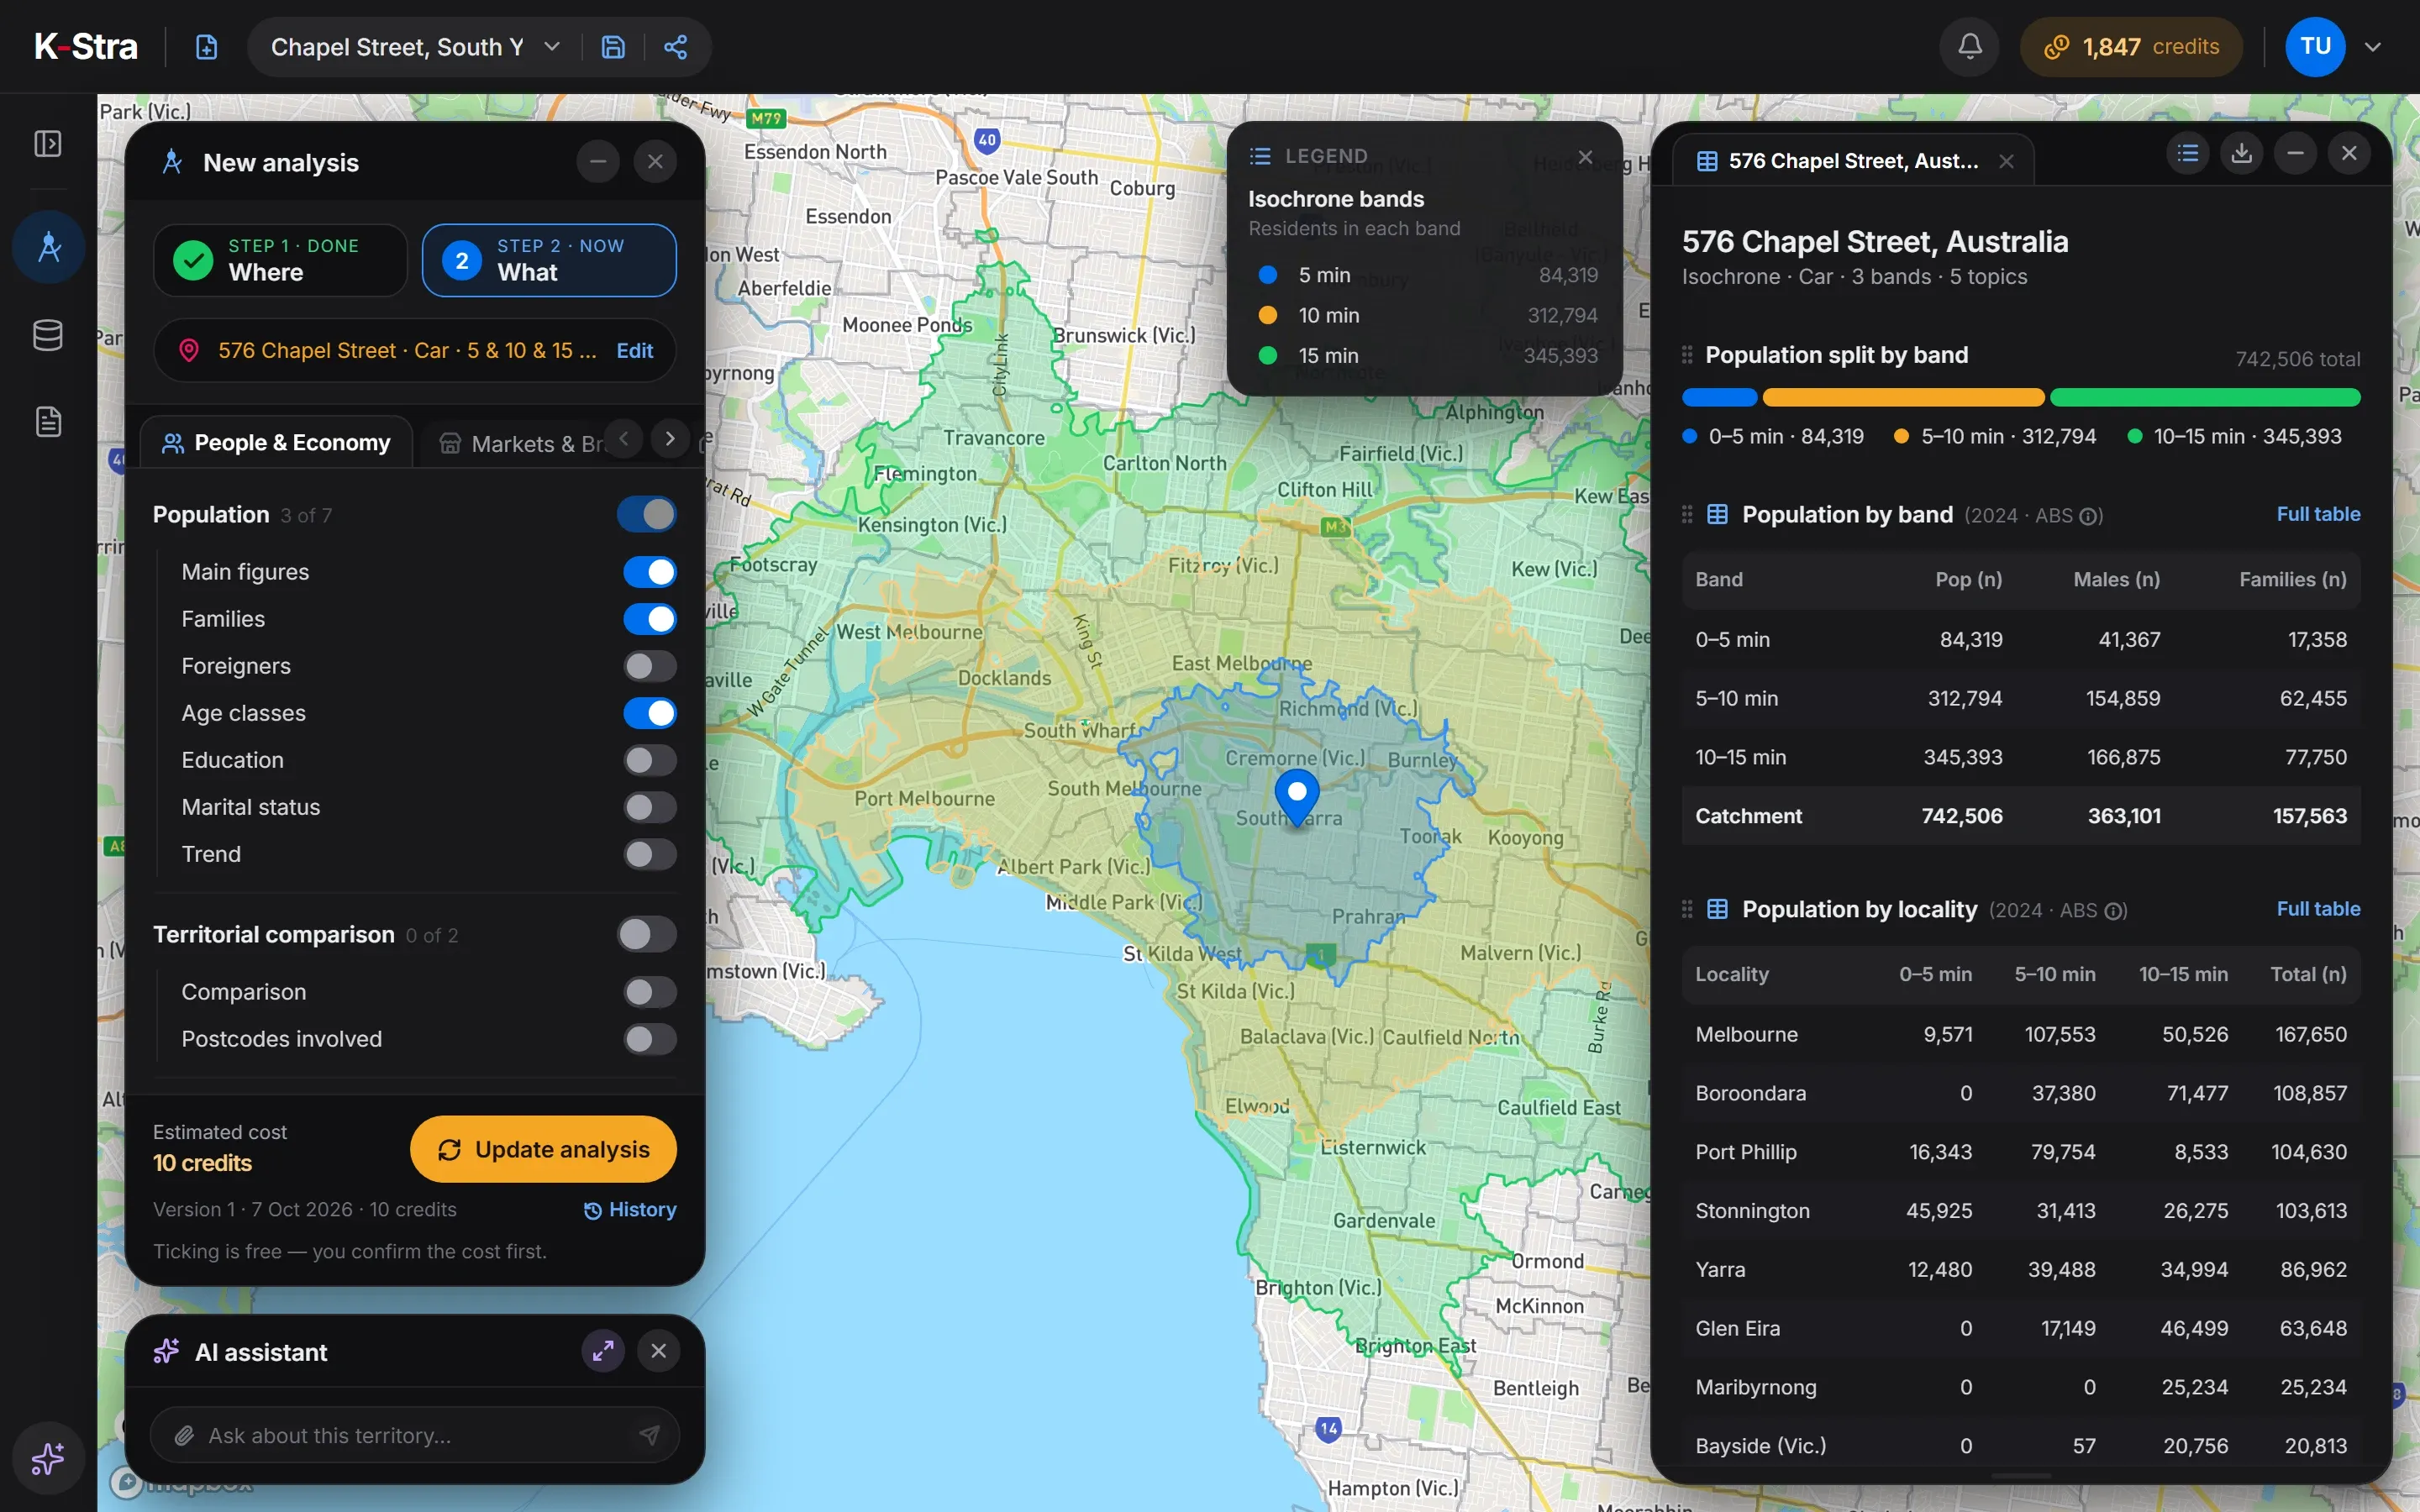
The method above maps onto the three steps of the app. Exploring the map and drawing the bands needs no account; running the analysis needs a free one.
Add a Markets & Brands sector to count competitors in each band, or bring your own customer file to compare the catchment with your real trade area.
A retail site at 576 Chapel Street, South Yarra, Melbourne VIC, with three drive-time bands by car in normal traffic. Most residents live in the outer bands: the first five minutes hold about one in nine.
| Band | Residents | Families | Dwellings | Area (km²) |
|---|---|---|---|---|
| 0–5 min | 84,319 | 17,358 | 47,174 | 18.73 |
| 5–10 min | 312,794 | 62,455 | 160,116 | 65.59 |
| 10–15 min | 345,393 | 77,750 | 145,209 | 110.32 |
| Catchment | 742,506 | 157,563 | 352,499 | 194.64 |
Sources: ABS population, sex and age 2024 (annual estimates); families and dwellings from the 2021 Census. Spread onto addresses with the 2021 SA1 mesh. K-Stra analysis of 7 October 2026.
Browsing the map and drawing the bands is free. The analysis above costs 10 credits: 5 People & Economy topics at 2credits each. Adding one Markets & Brands sector costs 40 credits.
The size of the catchment never changes the price: you pay for what you ask, not for the square kilometres. The 40 credits of a free account cover this analysis 4 times.
Optional, not in the total
Before you confirm, the app shows the estimate and your balance after the run.
The two terms are often used as synonyms. A catchment usually describes where people can reach you from; a trade area describes where your customers actually come from, which you can measure by uploading your own customer data.
Start from how your customers travel and how often they buy. Everyday shopping usually works on short drives or a short walk, while a destination store draws from much further away. K-Stra lets you set up to six bands between 0 and 120 minutes and compare them in the same run.
Yes. You can draw one or more polygons by hand, or pick administrative areas — suburbs, postcodes, councils and the ABS statistical areas — and run the same indicators on them. A polygon helps when the boundary is already known, such as a shopping strip or a delivery zone.
No. Bands are built for driving, with or without motorways, and for walking on the street network. Public transport timetables are not part of the travel-time model, so for a site that lives on train commuters read the walking band around the station.
Residents are counted address by address: ABS estimates are spread onto 14.5 million address points, and the edge of a band passes between one street number and the next. Totals remain estimates, with the source and year printed under every table.
Yes, with your own data. Upload a customer or loyalty-card file and Customer Loyalty measures how much of each store’s business comes from each band. The cannibalisation guide shows how to read it across a network.
Type the address, keep the default bands and read who lives in each one.
Open the app — free to exploreBrowsing and drawing bands is free