
How do I assess the catchment of a shopping centre?
A shopping centre sells a catchment to its tenants. Here is how to measure that catchment — who lives in it, what they spend, and which centres compete for them.
Assess a shopping centre catchment by drawing the drive time shoppers will make, usually 15 minutes or more, then counting the residents inside it and what they spend each year on food, clothing, homewares and leisure. Set that against the competing centres and department stores per 10,000 residents, compared with the council, the state and Australia.
Which large structures does K-Stra map?
K-Stra groups five kinds of large structure: shopping centres, outlet villages, food halls, transport terminals and exhibition centres. The shopping centre sector also holds department stores, so a regional centre and the anchor inside it both appear.
Shopping centres, outlets and food halls are containers: K-Stra maps where they are and how strongly they pull, but gives them no spending model. The spending their catchment can offer comes from People & Economy, which splits it into thirteen categories.
| Sector in the app | Locations | What it counts |
|---|---|---|
| Shopping centers | 5,154 | Shopping centres and malls, and department stores. A container: supply and competition only, no spending model. |
| Factory outlets & outlet villages | 552 | Factory outlets and outlet centres. A container: supply and competition only, no spending model. |
| Covered markets & food halls | 1,674 | Covered markets and food halls. A container: supply and competition only, no spending model. |
| Airports, stations & terminals | 3,534 | Airports, railway and bus stations. |
| Exhibition & convention centers | 253 | Exhibition and convention centres. |
Source: the Large structures group in the sector list of the K-Stra app on 1 November 2026, with the names the app uses; business catalogue of 23 October 2026, built from public online business listings. The counts here are the whole catalogue, as on the Australia pages; the national figure in the per 10,000 table of the example below counts only the locations K-Stra can place on an Australian address, so it can be a few places lower, which moves its rate by at most a hundredth.
Which numbers matter most for a shopping centre?
Residents within a wide drive
People drive further to a centre than to a single shop. The Penrith example uses a 15-minute drive, which holds 209,625 residents; bands of 5, 10 and 20 minutes show how the catchment thins out.
In the app: the Where step, with up to six drive-time bands, and People & Economy, Residents.
Spending by category
Tenants rent a share of the catchment’s spending on their category. Food, clothing, homewares, eating out and leisure each have their own figure per head and in total.
In the app: People & Economy, Spending: thirteen categories per head and in A$ million a year.
Competing centres per 10,000 residents
Australia has 1.87 shopping centres and department stores per 10,000. Above it, centres share the same shoppers; below it, a catchment may be under-served.
In the app: Markets & Brands, Shopping centers: the density table and the competition map.
Which councils the catchment draws on
A catchment rarely follows council lines. Knowing that 95% of the Penrith catchment lives in one council tells you which planning data and which growth figures to read.
In the app: People & Economy, Residents: population of the catchment by council.
Households and family size
Families with children fill car parks at weekends and spend on food, clothing and leisure in one trip. The number of families and their size describe the trade a centre can expect.
In the app: People & Economy, Residents: families and residents per family, band by band.
What data do you need to assess a shopping centre?
Centres, residents and their spending by category, already loaded. Your own properties can be added from a spreadsheet.
Centres and department stores
5,154 shopping centre and department store locations, outlets and food halls, from public online business listings.
Business and competition dataSpending in 13 categories
Household spending from the ABS national accounts for 2024–25, per head and in total, for every catchment.
Work, income and spendingResidents and families
ABS population estimates at 30 June 2025, spread address by address, with families and councils.
Population dataCommercial property
Commercial listings for lease and sale from property portals, with asking rents and prices.
Real estate data
K-Stra runs on a dedicated server in Sydney: your datasets, your analyses and your results stay in Australia. Map tiles, payments and sign-in never see your files. Three steps can: geocoding sends only the address text, and only after you confirm; the AI assistant reads column names and values when you ask it about a dataset; email notifications carry figures from your analysis.Where your data lives. Mark a dataset “session only” and it is deleted 24 hours after upload.
How do you analyse a shopping centre catchment in K-Stra?
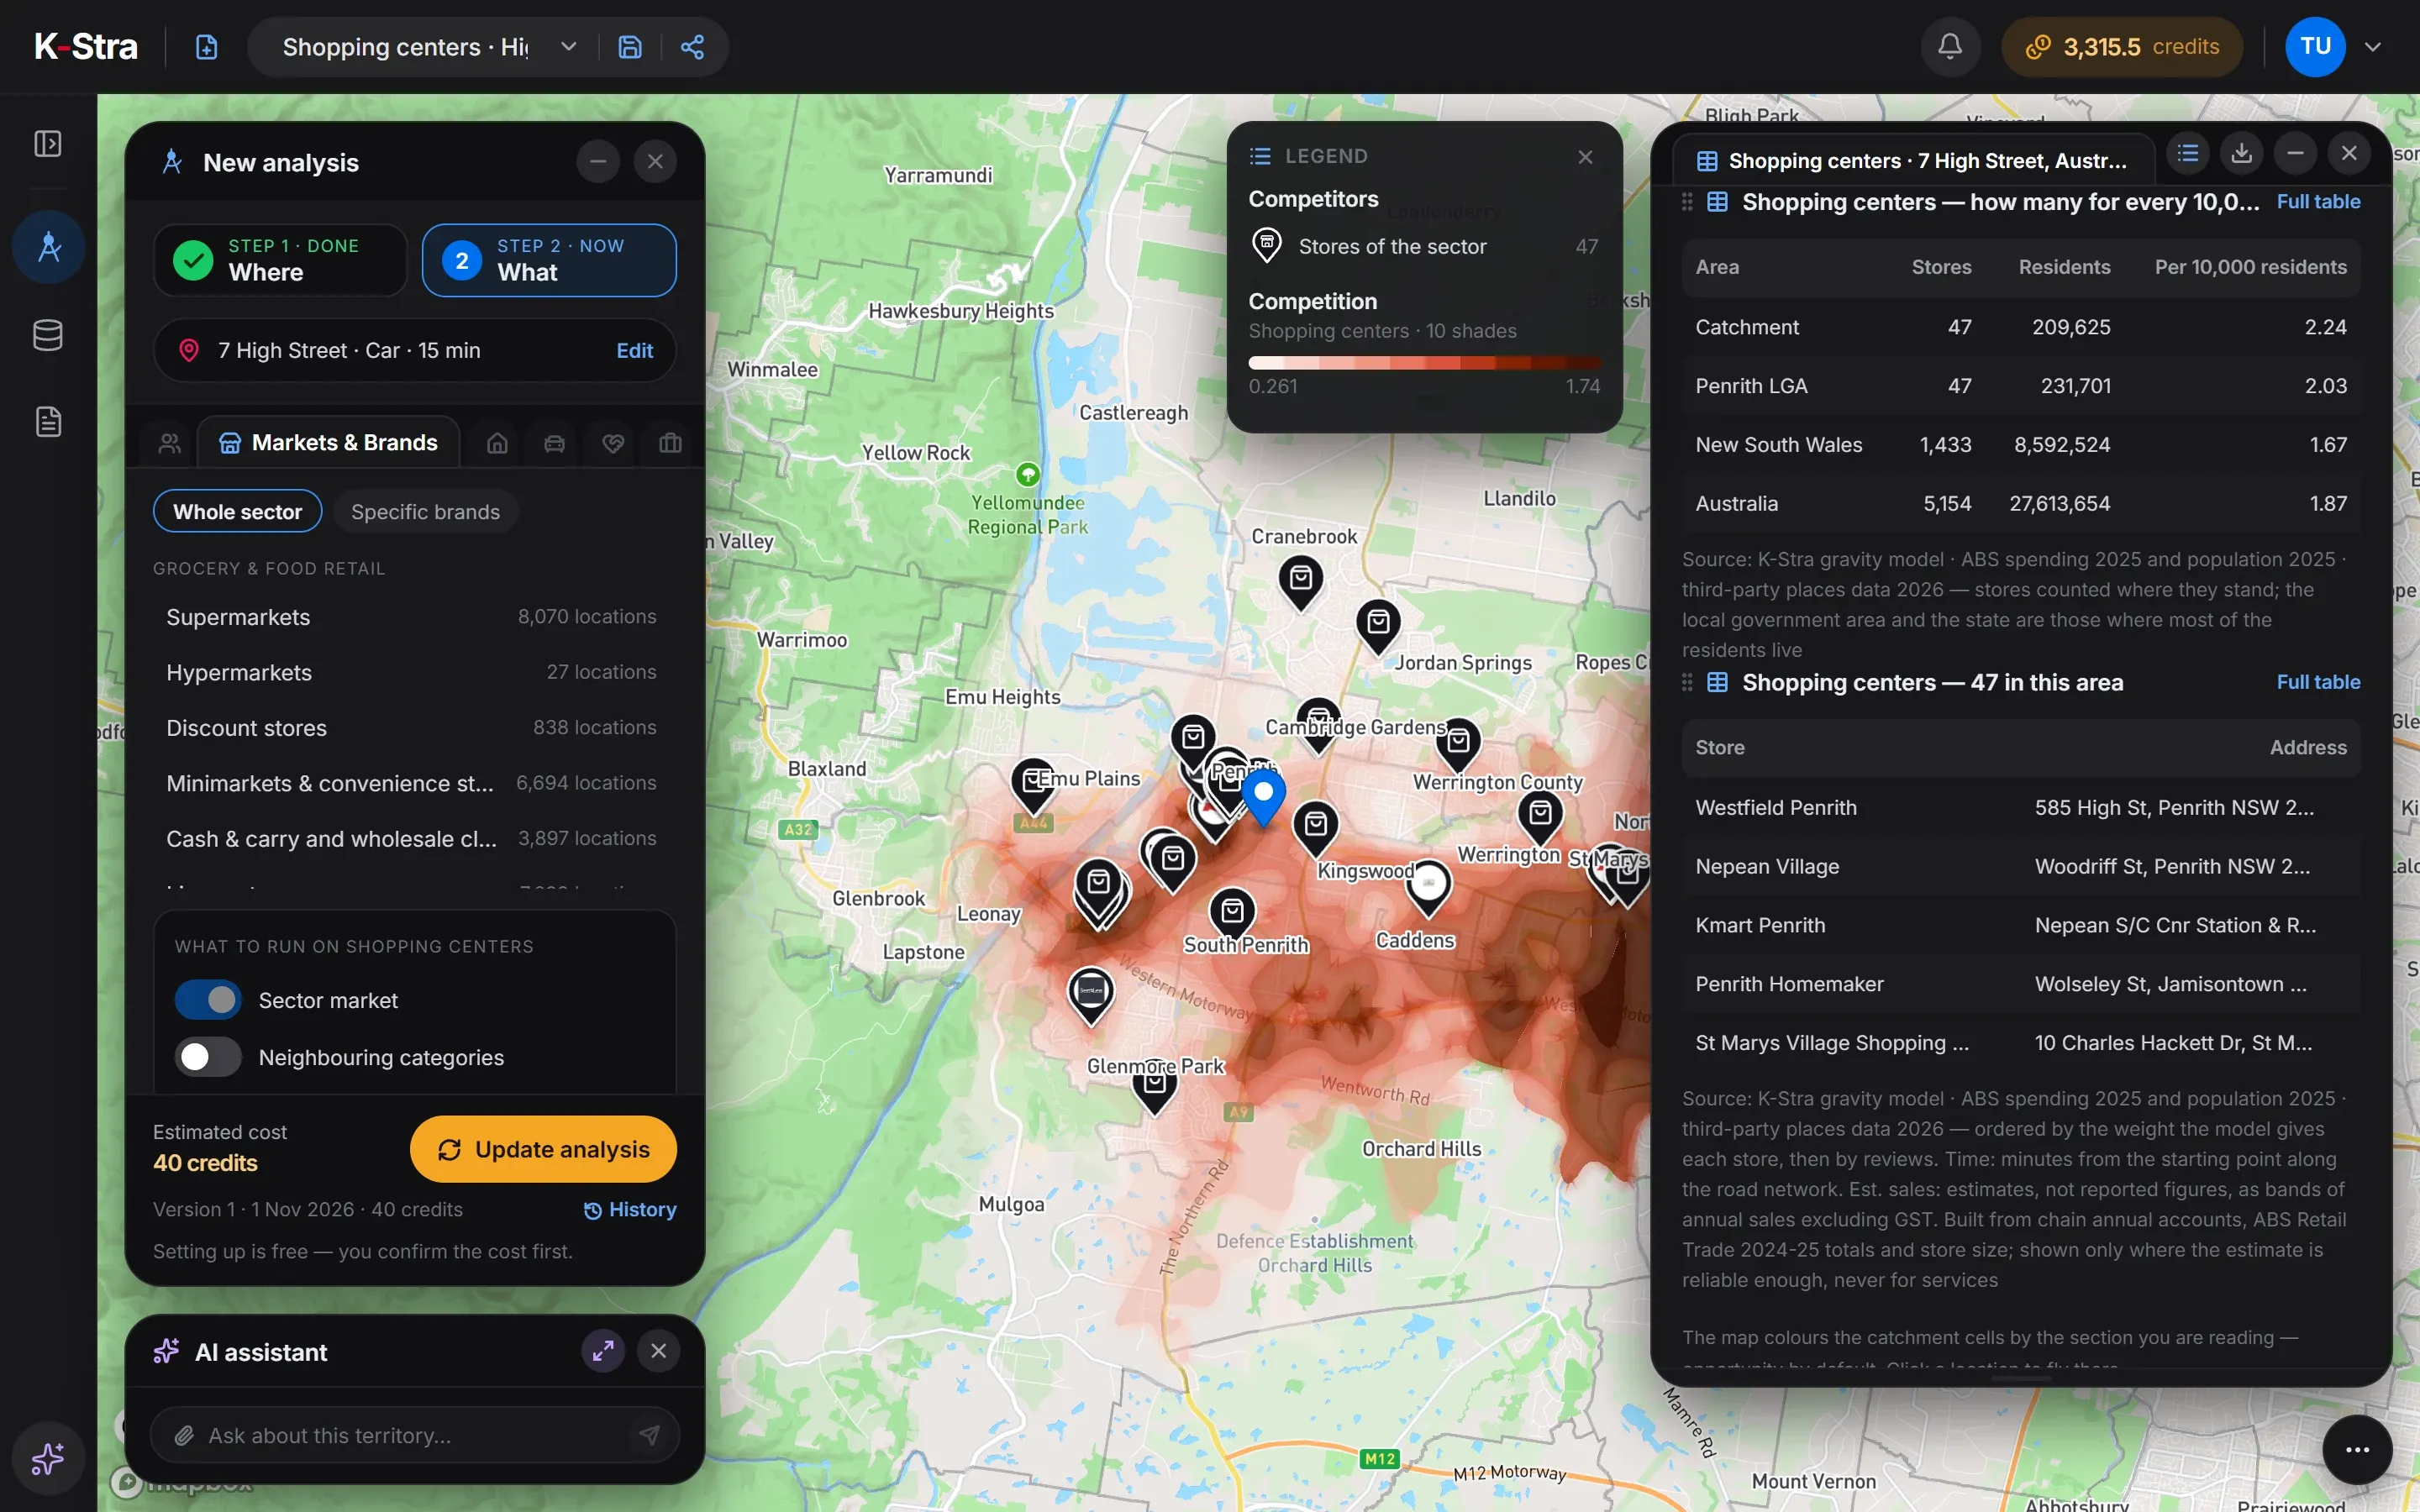
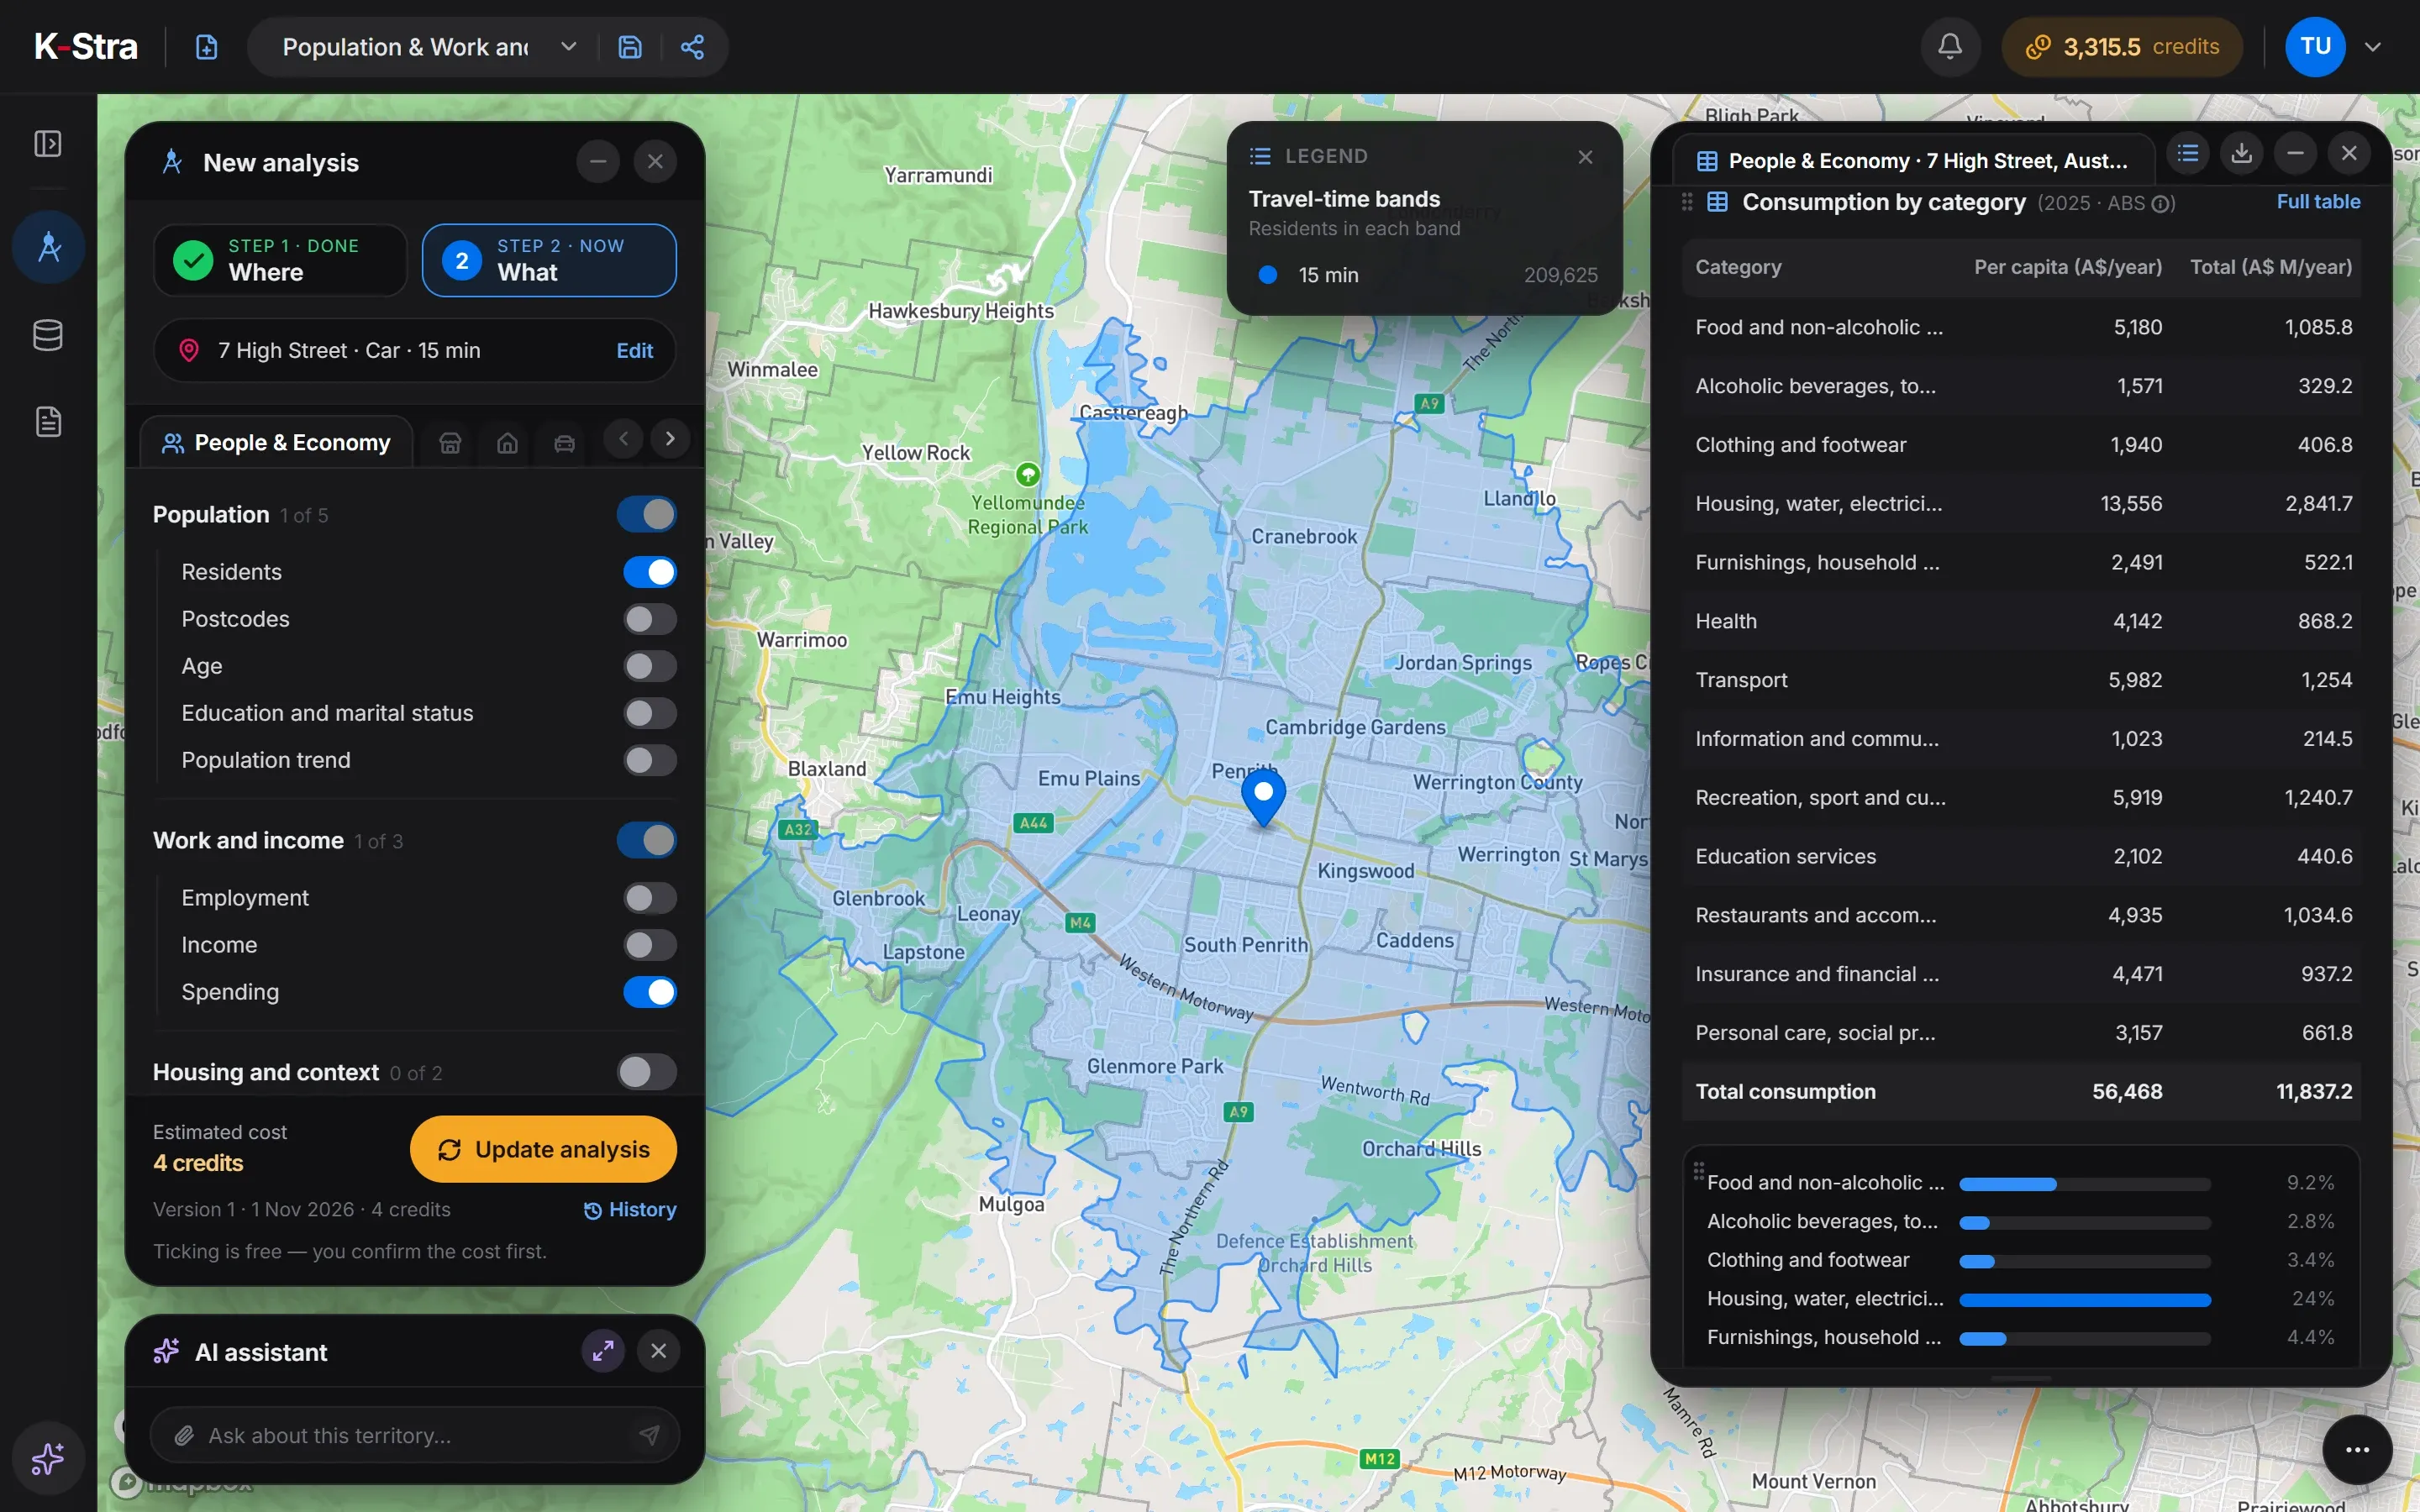
Two analyses of the same area: People & Economy with Residents and Spending, and Markets & Brands with Shopping centers as a whole sector.
- WhereThe address and one or more drive-time bands. The size of the area does not change the price.
- People & EconomyResidents and Spending, 2 credits each: who lives in the catchment and what they spend, category by category.
- Markets & BrandsShopping centers as a whole sector, 40 credits: every competing centre and department store, with the density.
What does a shopping centre analysis show?
Within 15 minutes by car of 7 High Street, Penrith NSW live 209,625 people in 52,508 families, and they spend about A$11.8 billion a year — A$56,468 a head. The same area holds 47 locations of the shopping centre sector: 35 shopping centres and 12 department stores, 2.24 per 10,000 residents against 1.87 in Australia.
| Area | Locations | Residents | Per 10,000 residents |
|---|---|---|---|
| Catchment | 47 | 209,625 | 2.24 |
| Penrith (council) | 47 | 231,701 | 2.03 |
| New South Wales | 1,433 | 8,592,524 | 1.67 |
| Australia | 5,154 | 27,613,654 | 1.87 |
Sources: K-Stra analysis of 1 November 2026: shopping centres, and residents and their spending, within a 15-minute drive in average traffic of 7 High Street, Penrith. Businesses: K-Stra places catalogue, October 2026. Residents: ABS population estimates at 30 June 2025. Spending: ABS national accounts, 2024–25.
What can the Penrith catchment support?
A great deal of spending: A$5,180 a head a year on food and groceries, A$4,935 on eating out and A$1,940 on clothing and footwear — about A$1,086 million, A$1,035 million and A$407 million in total. Almost all of the catchment, 198,369 people, lives in the Penrith council area.
It is also well served: 2.24 centres and department stores per 10,000 residents, above New South Wales at 1.67, and 7 of them within two minutes of the starting point. A new centre here would compete head-on; the question is which category of spending the existing ones leave unserved.
 Spending · Penrith
How much does a shopping centre analysis cost?
The Penrith example cost 44 credits for 209,625 residents. A larger catchment costs the same: you pay for the questions, not the size of the area.
- People & Economy, Residents and Spending2 per topic4 credits
- Markets & Brands, Shopping centersper sector, any area40 credits
- Maps, tables and exports of the resultsFree
- Total= 44 credits
- ≈ A$67 at the Single report pack rate of A$1.53 a credit; less with larger packs and monthly plans.
Optional, not in the total
- Coverage of several centresper store or candidate+ 5 credits
The estimate appears before each run starts, and a run that fails costs nothing.
What do people assessing a centre ask next?
How far does the catchment reach?
Draw several drive-time bands on real roads and read residents and spending band by band.
Catchment area analysisWhat is the property worth?
Commercial listings, asking rents and prices, and the services within a short drive.
Real estate location analysisHow big is the market for one category?
Residents within a drive time, what they spend on a category each year and how many shops already share it.
Market potential analysis
What else do people ask about shopping centre catchments?
Why is there no demand or opportunity map for shopping centres?
Because a shopping centre is a container of other businesses, not a category of household spending. K-Stra maps shopping centres, outlet villages and food halls with their locations and competition; the spending of the catchment comes from People & Economy, category by category.
Does K-Stra show the estimated annual sales of a shopping centre?
No. A shopping centre has no estimated annual sales. Department stores, which K-Stra counts in the same sector, show an estimated annual sales band with its confidence — in the Penrith example, run on 1 November 2026, when only high and medium estimates were shown, 8 of the 12. They are estimates, not reported figures.
How many shopping centres are there per resident in Australia?
5,154 shopping centre and department store locations for 27,613,654 residents, or 1.87 per 10,000, in the K-Stra catalogue of October 2026. Outlet villages and food halls are counted separately.
How large should a shopping centre catchment be?
It depends on the centre: a neighbourhood centre with a supermarket serves a few minutes’ drive, a regional centre with department stores 15 to 30 minutes. Draw bands — for example 5, 10 and 20 minutes — and read residents and spending in each.
Can I compare several centres?
Yes. Coverage takes up to 500 points — centres from the catalogue, your own properties or points on the map — with a drive time for each, and counts the residents each covers and shares, for 5 credits per point.
Measure the catchment
of your centre.
Type an address, draw the drive times and read residents, spending and competing centres on one map.
Open the app — free to exploreExploring the map is free; you pay only for the analyses you run