
How do I choose a location for a specialty shop?
A fashion boutique, a hardware store and a phone shop live on different trips. Here is how to measure the market for your category, not for retail in general. The worked example is clothing in Bunbury; the same method applies to the other 15 retail sectors.
Choose a location for a specialty shop by measuring what residents within a 15-minute drive spend on your category, then counting the shops of the same kind per 10,000 residents against the council, the state and Australia. Shopping strips and regional centres pull from far beyond their residents, so read density next to the market gap.
Which kinds of shop does K-Stra map?
K-Stra splits specialty retail into 16 sectors, each with its own slice of ABS household spending: clothing is measured against clothing, furniture against furniture. That matters, because a shoe shop and an electronics store draw customers from very different distances.
Inside a sector, every shop keeps the category its listing gives it. The clothing sector of the Bunbury example holds op shops, boutiques, workwear, bridal and children’s wear side by side, and the table lets you filter them.
| Sector in the app | Locations | What it counts |
|---|---|---|
| Sporting goods | 3,920 | Sports equipment and sportswear stores. |
| Clothing | 27,231 | Clothing stores, boutiques, op shops, workwear, bridal. |
| Footwear | 5,105 | Shoe shops. |
| Jewelry | 5,992 | Jewellers and watch shops. |
| Fashion accessories | 998 | Bags, accessories, sunglasses. |
| Perfumeries | 2,950 | Perfume and cosmetics stores. |
| Furniture & home decor | 6,834 | Furniture, beds, home decor. |
| DIY & hardware | 11,880 | Hardware stores and DIY centres. |
| Housewares | 3,705 | Kitchenware and household goods. |
| Consumer electronics | 3,250 | Electronics and appliance stores. |
| Computer stores | 2,457 | Computer stores and repairs. |
| Phone stores | 4,006 | Mobile phone stores. |
| Bookshops & stationery | 3,814 | Bookshops, newsagents and stationers. |
| Toys & kids stores | 3,208 | Toy stores and children’s shops. |
| Outdoor clothing & equipment | 260 | Camping and outdoor clothing. |
| Tool stores | 236 | Tool and trade supply stores. |
Source: the Retail stores group in the sector list of the K-Stra app on 1 November 2026, with the names the app uses; business catalogue of 23 October 2026, built from public online business listings. The counts here are the whole catalogue, as on the Australia pages; the national figure in the per 10,000 table of the example below counts only the locations K-Stra can place on an Australian address, so it can be a few places lower, which moves its rate by at most a hundredth.
Which numbers matter most for a specialty shop?
Spending on your category within reach
Residents of the Bunbury example spend about A$1,010 a head a year on clothing, from ABS household spending for 2024–25. Each sector has its own figure, and that, not the number of residents, sizes the market.
In the app: the Demand map and its table of resident spending by band.
Residents within the trip your customers make
The K-Stra model measures clothing on a 15-minute drive: people travel further for fashion than for groceries. Other sectors use their own reach. The 15-minute drive is how far K-Stra assumes customers usually travel to a clothing shop when it models demand and competition; the 10-minute drive of the example is the area chosen to look at. The first sets the model, the second sets what is counted.
In the app: the Where step, and the note on each Demand map that states the reach of the model.
Shops per 10,000 residents
Australia has 9.86 clothing shops per 10,000. Regional centres sit far above it because they serve a whole region; a suburb far below it may be served by the centre next door.
In the app: the density table: catchment, council, state and Australia side by side.
The mix of the competition
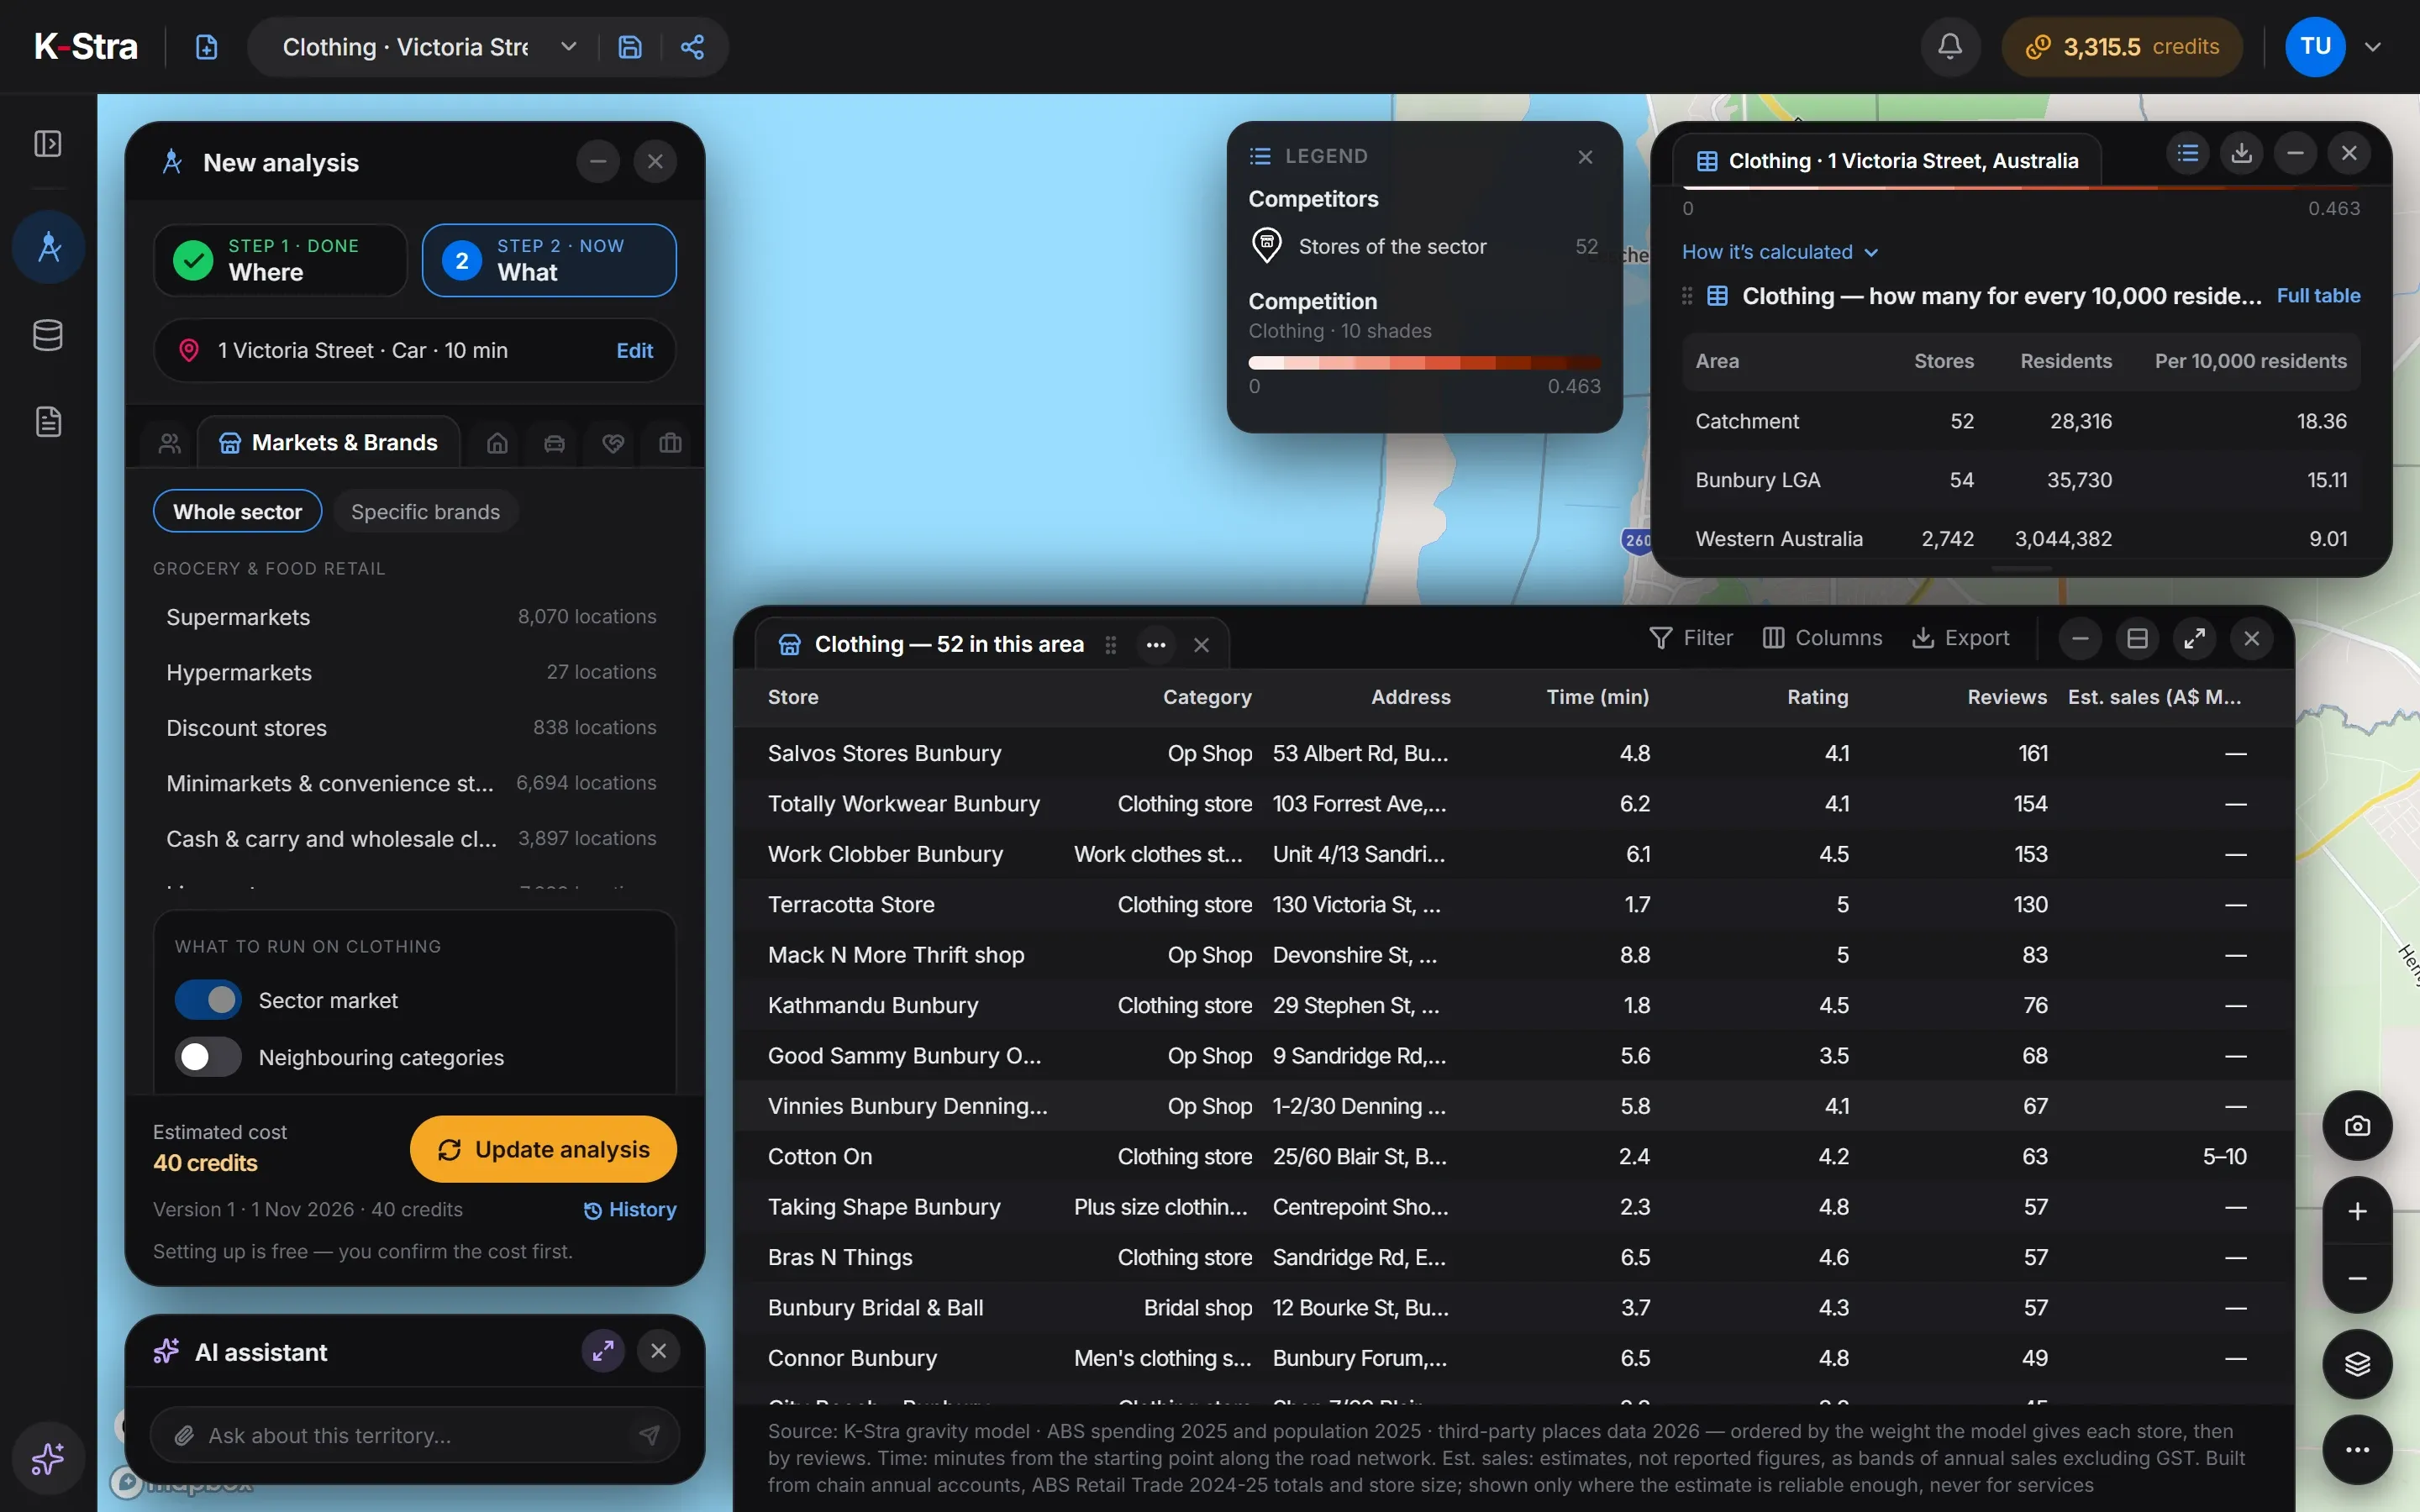
Op shops, boutiques and chain stores compete for different customers. The category of each listing shows what really surrounds a site, and estimated sales bands show which chain stores carry the market.
In the app: the store table, with categories, ratings, reviews and estimated sales.
Neighbours that bring shoppers
Specialty shops do better next to shops that draw the same people: fashion near footwear, cafés and a shopping centre, homewares near furniture and DIY.
In the app: the neighbouring categories option, counted per 10,000 residents in the same area.
What data do you need to assess a shop location?
Shops, residents and spending by category, already loaded. Your own stores can be imported to sit on the same map.
Every shop of the sector
27,231 clothing locations and 15 more retail sectors, each with category, rating and reviews, from public online business listings.
Business and competition dataSpending by category
Household spending from the ABS national accounts for 2024–25, split into the categories K-Stra sectors use.
Work, income and spendingResidents and households
ABS population estimates at 30 June 2025, spread address by address, with age, households and income in People & Economy.
Population dataEstimated annual sales
Sales bands for existing shops with their confidence, low for most independents. Estimates, not reported figures.
Competitor analysis
K-Stra runs on a dedicated server in Sydney: your datasets, your analyses and your results stay in Australia. Map tiles, payments and sign-in never see your files. Three steps can: geocoding sends only the address text, and only after you confirm; the AI assistant reads column names and values when you ask it about a dataset; email notifications carry figures from your analysis.Where your data lives. Mark a dataset “session only” and it is deleted 24 hours after upload.
How do you analyse a shop location in K-Stra?
Type the address, keep a 10-minute drive or widen it, open Markets & Brands and pick your sector — Clothing in this example — as a whole sector, with estimated sales switched on.
- WhereAn address and a drive time. The model reads demand on the reach of the sector, whatever area you draw.
- WhatMarkets & Brands, whole sector, your category, with estimated sales switched on and the neighbouring categories if you want the context.
- ReadDemand, competition, opportunity and market gap on the map, every shop with its category, and five best locations.
What does a clothing analysis show?
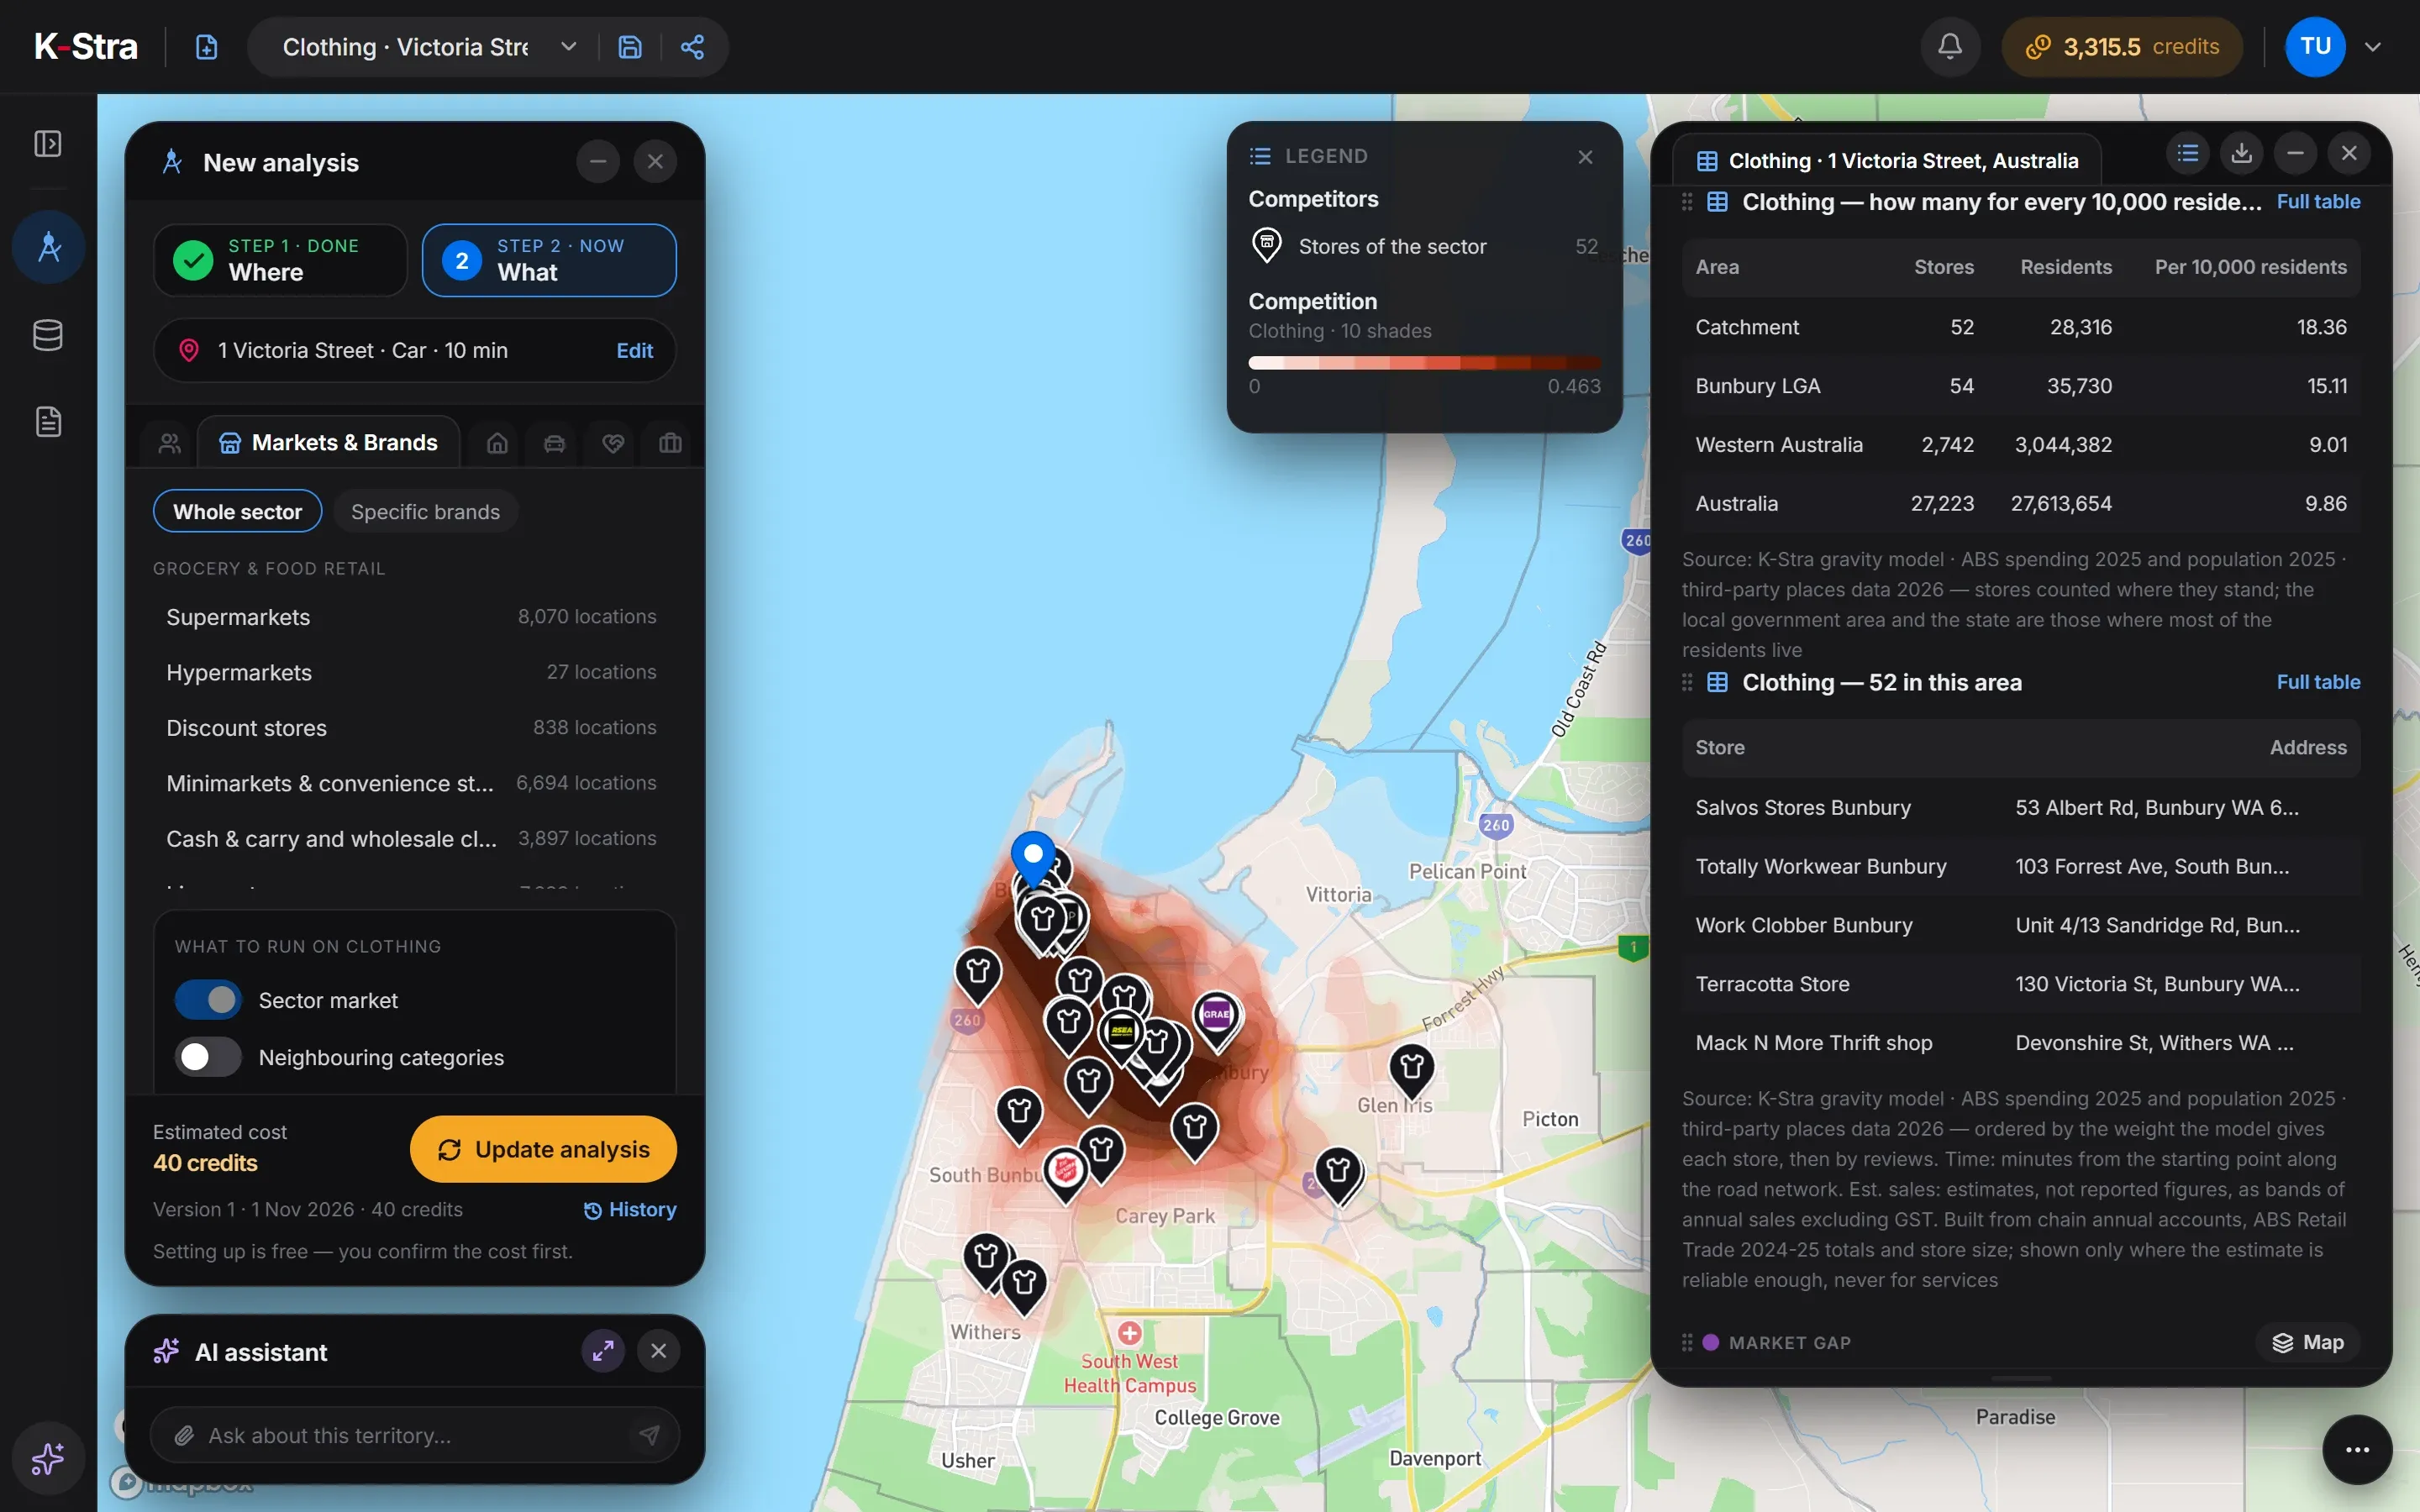
Clothing within 10 minutes by car of 1 Victoria Street, Bunbury WA: 52 shops for 28,316 residents, 18.36 per 10,000 against 9.86 in Australia. 16 of them stand within two minutes of the starting point. The mix is wide: 20 clothing stores, 8 op shops, 6 women’s clothing stores, 4 men’s clothing stores, 3 boutiques and others.
| Area | Shops | Residents | Per 10,000 residents |
|---|---|---|---|
| Catchment | 52 | 28,316 | 18.36 |
| Bunbury (council) | 54 | 35,730 | 15.11 |
| Western Australia | 2,742 | 3,044,382 | 9.01 |
| Australia | 27,223 | 27,613,654 | 9.86 |
Sources: K-Stra analysis of 1 November 2026: clothing shops within a 10-minute drive in average traffic of 1 Victoria Street, Bunbury. Businesses: K-Stra places catalogue, October 2026. Residents: ABS population estimates at 30 June 2025. Spending: ABS national accounts, 2024–25. Estimated annual sales: estimates, not reported figures, from chain annual accounts, store size and ABS Retail Trade totals.
Does Bunbury have too many clothing shops?
Measured against its own residents it looks crowded; measured against the region it serves, it may not be. The catchment has almost twice the Australian density, and the Bunbury council area 15.11, against 9.01 in Western Australia. Bunbury is the shopping centre of a wider region, and its shops sell to people who drive in.
The model points away from the centre. The best locations for opportunity lie near Bussell Highway, Withers; 66 Frankel Street, Carey Park; and 1 Sandridge Road, South Bunbury; the highest market gap among buildings of the right size is near 10 Mistletoe Court, Glen Iris, at 152 against 100 for the typical spot.
 Shops · Bunbury
How much does a shop location analysis cost?
The Bunbury example cost 40 credits. The same analysis on a whole city costs the same: you pay for the sector, not the size of the area.
- Markets & Brands, one retail sectorper sector, any area40 credits
- Estimated annual sales of the shopsFree for nowFree
- Maps, tables and exports of the resultsFree
- Total= 40 credits
- ≈ A$61 at the Single report pack rate of A$1.53 a credit; less with larger packs and monthly plans. A new free account’s 40 welcome credits cover it.
Optional, not in the total
- Neighbouring categoriesper set+ 2 credits
- Compare candidate sitesper candidate site+ 20 credits
The estimate appears before the run starts, and a run that fails costs nothing.
What do people opening a shop ask next?
How big is the market for my category here?
Residents within a drive time, what they spend on your category each year and how many shops already share it.
Market potential analysisWho am I really up against?
Every competing shop with its category, rating, reviews and, for chain stores, an estimated sales band.
Competitor analysisShould I move to a better spot?
Compare the current shop with candidate sites on the same catchment, competitors and spending model.
Store relocation
What else do people ask about shop locations?
How many clothing shops are there per resident in Australia?
27,223 clothing locations for 27,613,654 residents: 9.86 per 10,000, or one for every 1,014 Australians. The count includes op shops, boutiques, workwear and bridal stores, so read it against the category you actually run.
Do independent clothing shops have estimated sales?
Since 7 November 2026, yes, where their group passes the model’s checks: a low-confidence band, estimated from the typical size of the type of shop, from reviews or from ABS counts of businesses by turnover band. Chain stores with published accounts or a measured floor area have high or medium confidence. The Bunbury example was run on 1 November 2026, when only those were shown: 3 of 52 shops showed a band and 49 a dash.
Can I analyse footwear, jewellery or homewares instead of clothing?
Yes. Each of the 16 retail sectors has its own demand, competition and best locations, from sporting goods and footwear to furniture, DIY, electronics, books and toys. One analysis runs one sector; the neighbouring categories add the others around it for 2 credits.
Is a regional centre a good place for a specialty shop?
Often, because it draws shoppers from towns that have no shops of their own. But the density of competitors is high there too, and residents alone understate the market. Compare the market gap of the centre with that of the growing suburbs around it before choosing.
Does online shopping change the numbers?
Only implicitly. Demand comes from ABS household spending on the category, which already includes what people buy online, and the model shares it among the physical shops within reach. A category that sells mostly online will look larger in the model than on the high street.
See the market for
your category.
Type an address, pick your retail sector and read spending, competition and the gaps on one map.
Open the app — free to exploreEstimated sales are free for now; you pay only for the analyses you run