
How do I choose a location for a childcare centre?
Parents choose childcare on the way to work, close to home. Here is how to count the children within reach and the services already caring for them. The worked example is childcare in Oran Park; the same method applies to schools.
Choose a childcare centre location by counting the children under five and the young families within about a ten-minute drive, then the childcare centres, family day care and kindergartens already serving them, per 10,000 residents against the council, the state and Australia. Growing estates fill with young children years before services catch up.
Which childcare and education services does K-Stra map?
K-Stra has two sectors in this group: childcare and early learning, and schools. Each has its own share of ABS household spending on education and its own reach, and each is analysed on its own.
The childcare sector holds every kind of service parents compare: long day care centres, family day care, kindergartens and preschools. What K-Stra counts is services, not licensed places, so the size of each centre stays outside the numbers.
| Sector in the app | Locations | What it counts |
|---|---|---|
| Childcare & early learning | 14,460 | Childcare centres, family day care, kindergartens and preschools. |
| Schools | 10,532 | Primary and secondary schools. |
Source: the Education & Childcare group in the sector list of the K-Stra app on 1 November 2026, with the names the app uses; business catalogue of 23 October 2026, built from public online business listings. The counts here are the whole catalogue, as on the Australia pages; the national figure in the per 10,000 table of the example below counts only the locations K-Stra can place on an Australian address, so it can be a few places lower, which moves its rate by at most a hundredth.
Which numbers matter most for a childcare centre?
Children under five within reach
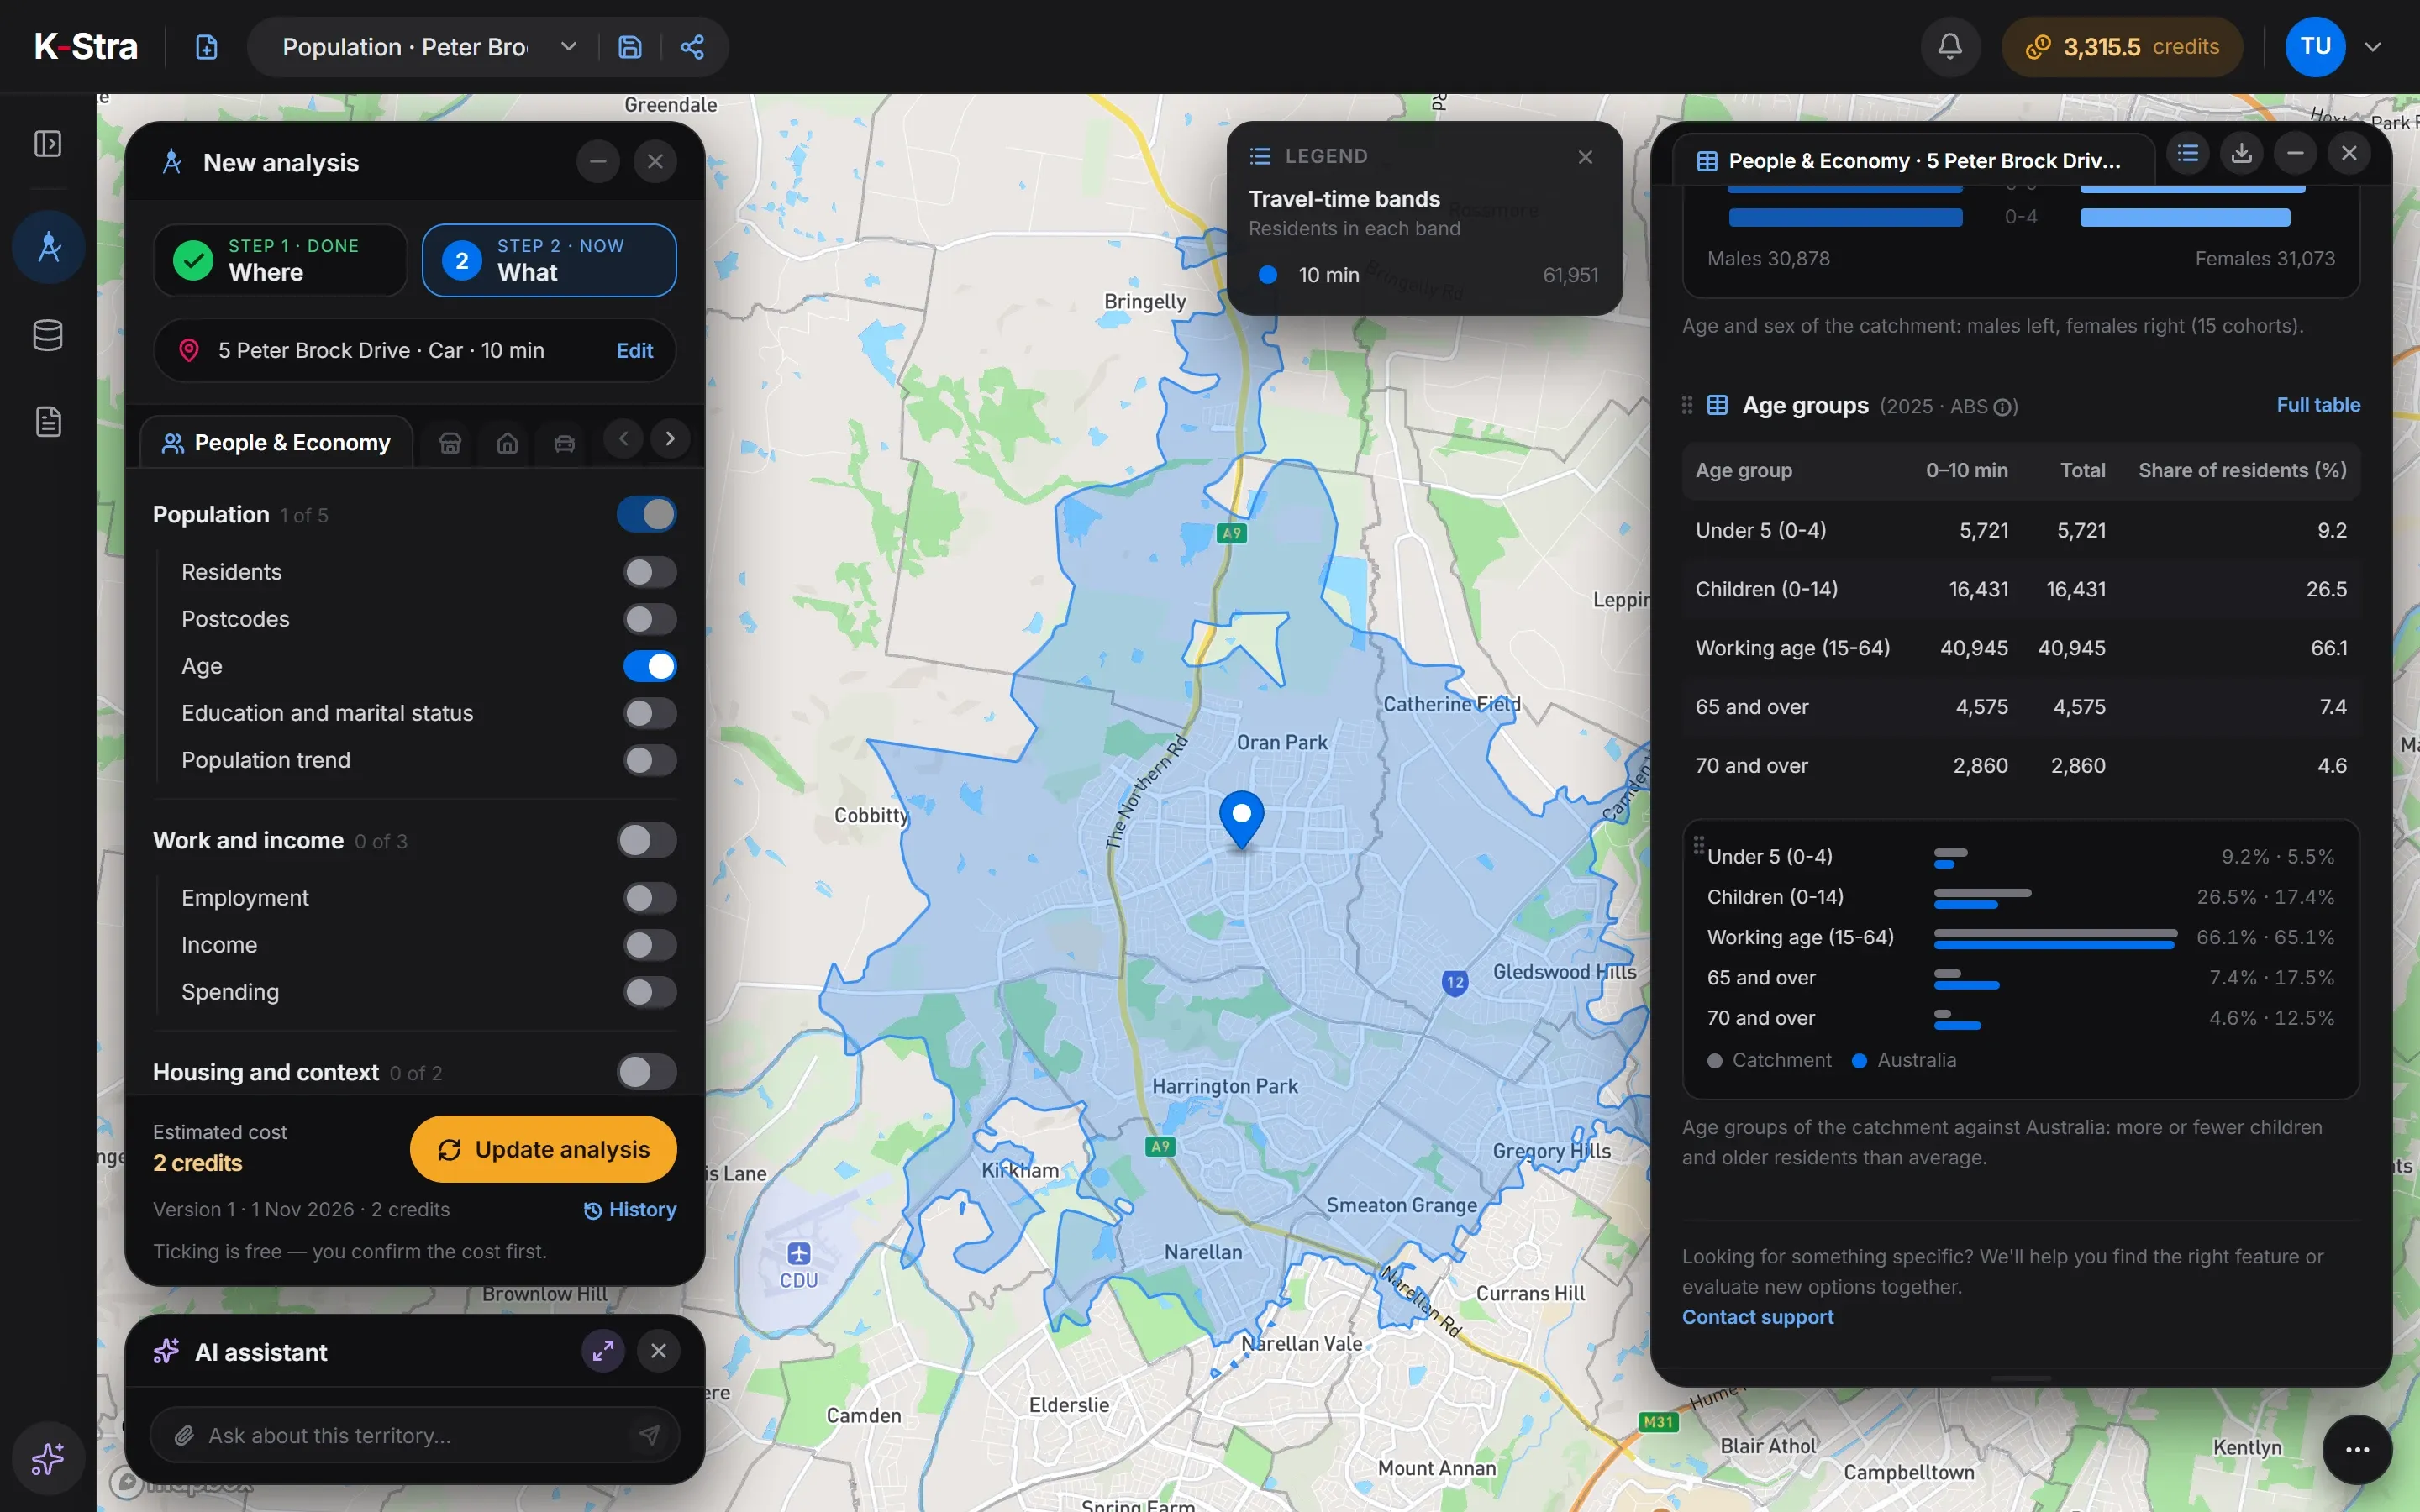
They are the market. Around Oran Park 9.2% of residents are under five, against 5.5% in Australia: 5,721 children within ten minutes.
In the app: People & Economy, Age: five-year groups and age groups against Australia.
Residents within a 10-minute drive
The K-Stra model measures childcare on a 10-minute drive. Parents fit the drop-off into the trip to work, so a centre on the way out of the suburb has an edge.
In the app: the Where step and the Demand map, which counts the spending reachable from each point.
Services per 10,000 residents
Australia has 5.24. A young suburb needs more than that, because a far larger share of its residents are small children.
In the app: the density table: catchment, council, state and Australia side by side.
Population growth
New estates add families every year, and services follow with a lag. Residents year by year show whether a catchment is still filling up.
In the app: People & Economy, Population trend: residents from 2019 to 2025.
Opportunity in new estates
Where spending within reach is high against the services already there, the opportunity map is darkest — often in the estates that were paddocks a few years ago.
In the app: the Opportunity and Market gap maps, and the five best locations at least 500 m apart.
What data do you need to assess a childcare site?
Services, children by age, growth and spending, already loaded. Nothing needs uploading.
Children by age
ABS population estimates at 30 June 2025 by age and sex, in five-year groups, spread address by address.
Population dataEvery childcare service
14,460 childcare and early learning locations and 10,532 schools, from public online business listings.
Business and competition dataPopulation trend
Residents year by year from 2019 to 2025 for any catchment, to see which suburbs are still growing.
Population dataSpending on education
Household spending from the ABS national accounts for 2024–25, assigned to the childcare sector.
Work, income and spending
How do you analyse a childcare site in K-Stra?
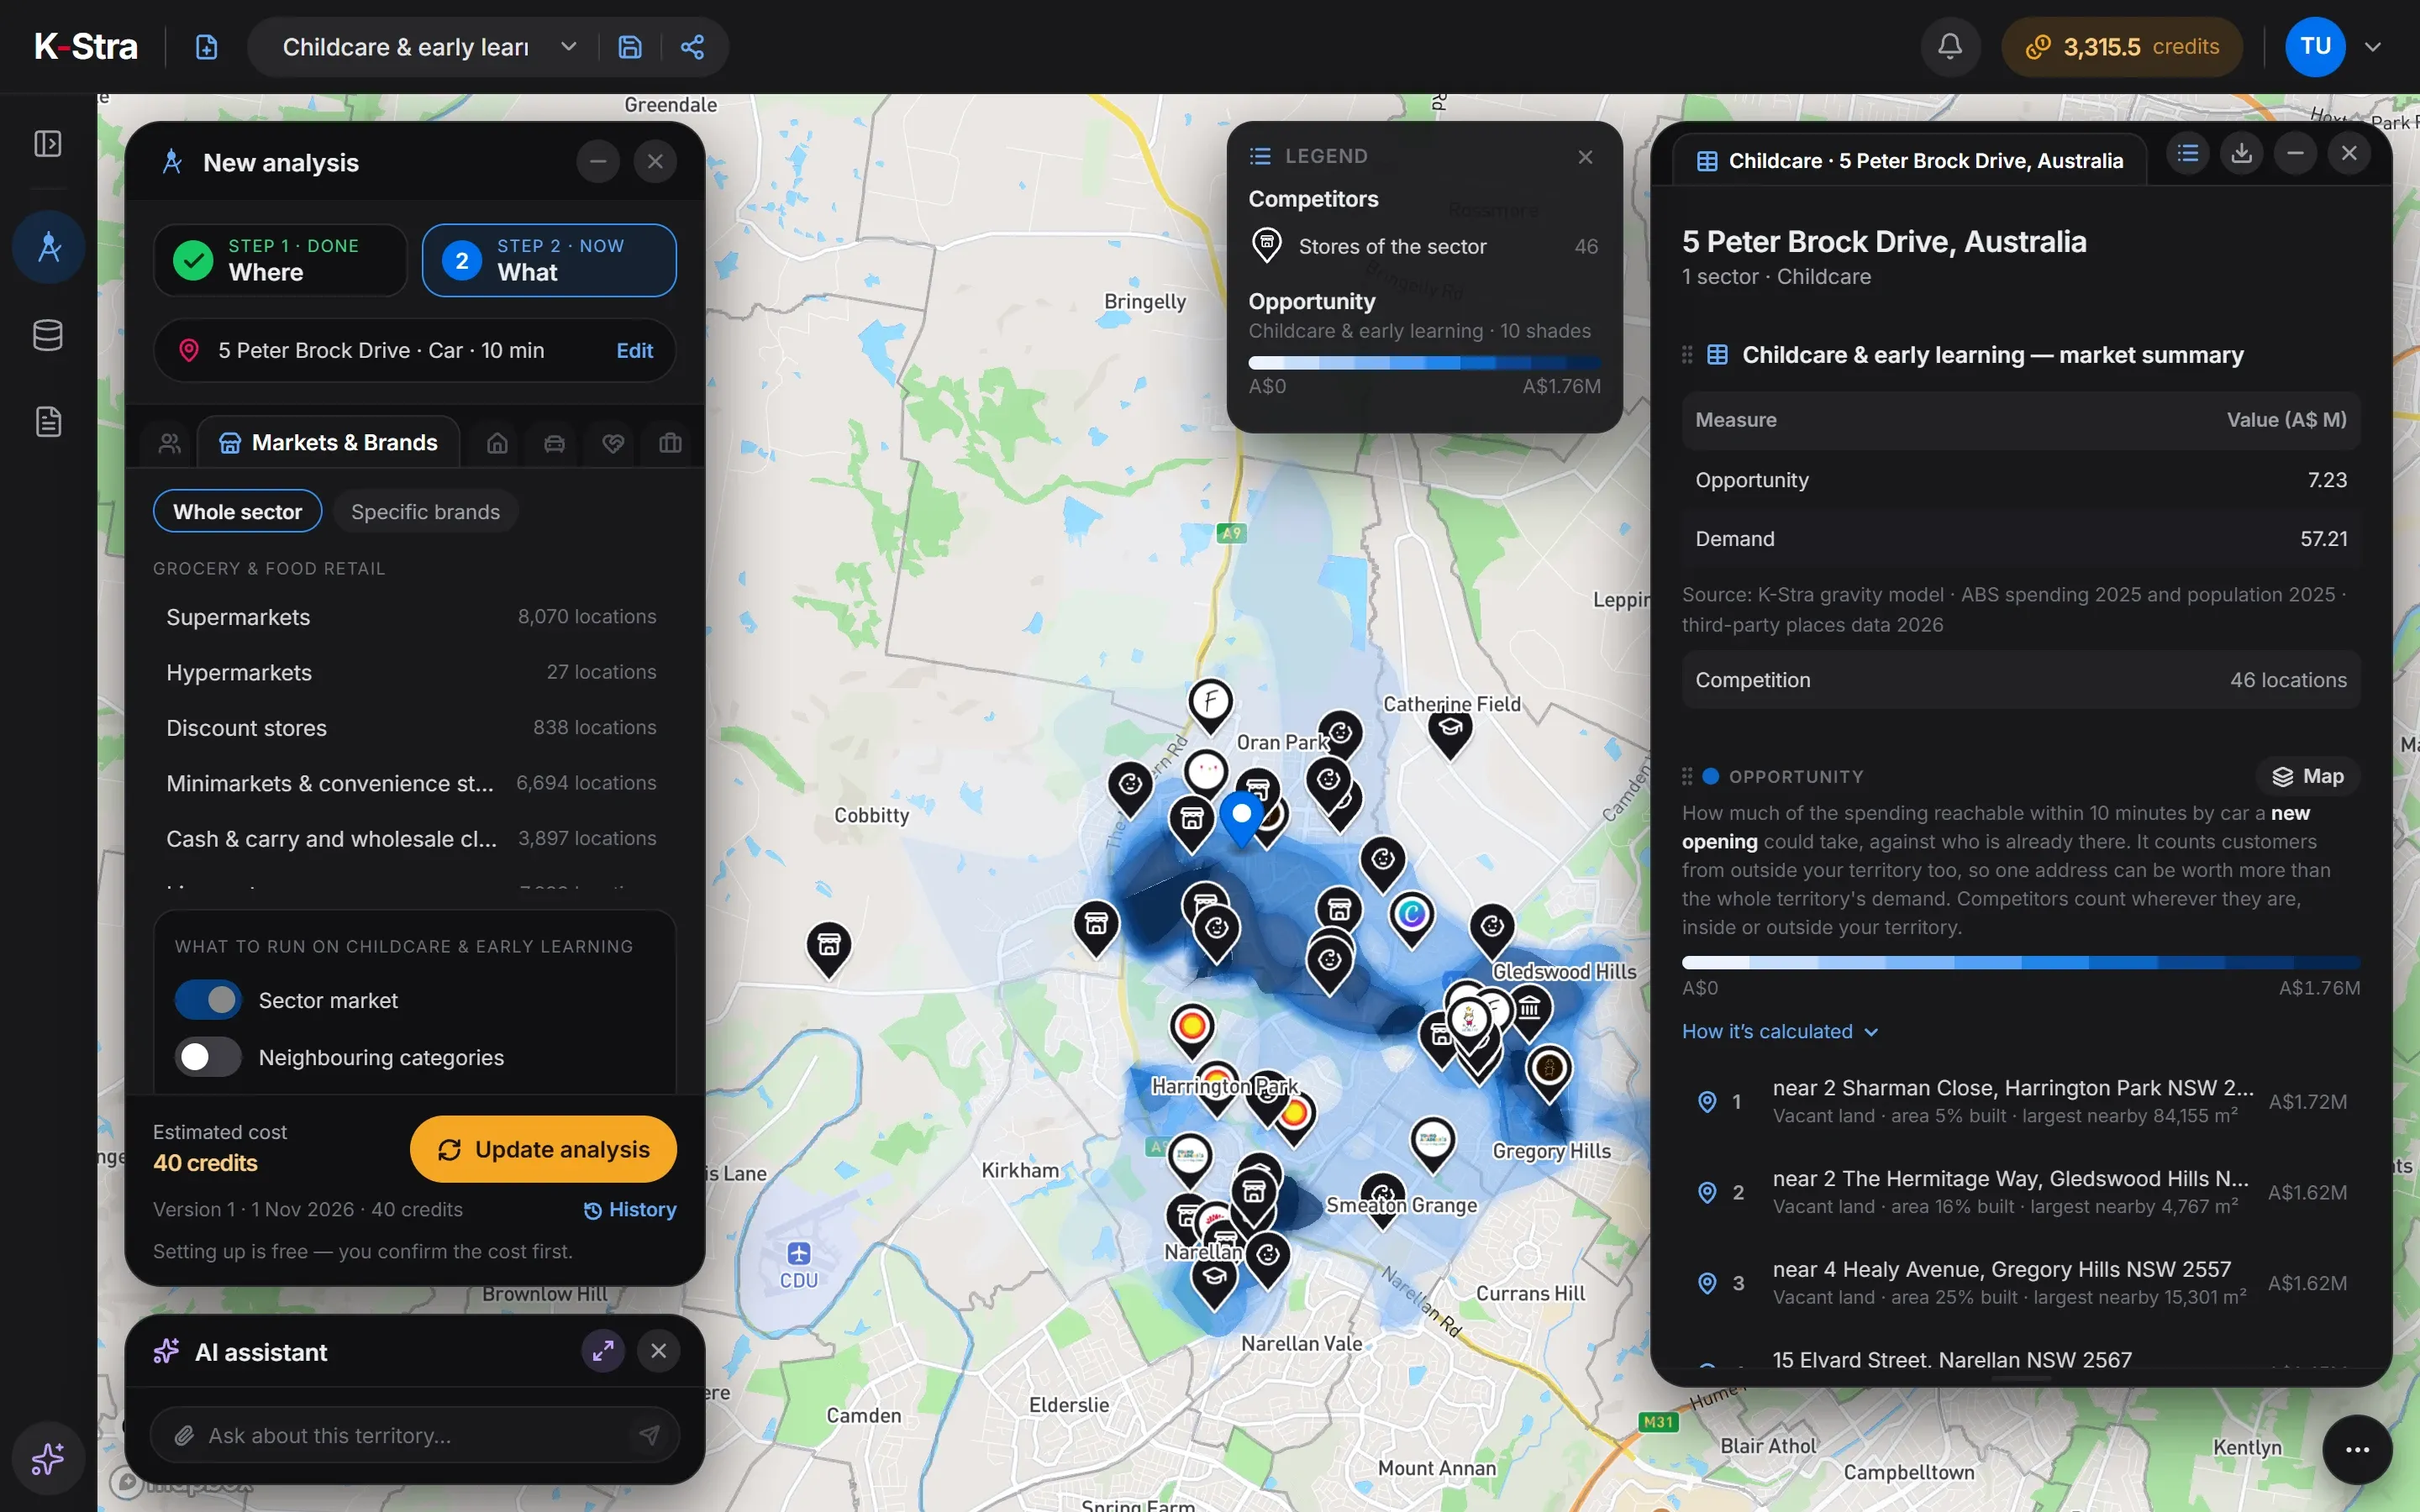
Two analyses of the same area: Markets & Brands with Childcare & early learning as a whole sector, and People & Economy with Age.
- WhereThe address and a 10-minute drive. The size of the area does not change the price.
- Markets & BrandsChildcare & early learning as a whole sector, 40 credits: every service, density and best locations.
- People & EconomyAge, 2 credits: children under five and age groups against Australia.
What does a childcare analysis show?
Childcare within 10 minutes by car of 5 Peter Brock Drive, Oran Park NSW: 46 services for 61,951 residents, 7.43 per 10,000 against 5.24 in Australia. 26.5% of residents are under 15, against 17.4% in Australia, and the average age is 32.2.
| Area | Services | Residents | Per 10,000 residents |
|---|---|---|---|
| Catchment | 46 | 61,951 | 7.43 |
| Camden (council) | 102 | 146,483 | 6.96 |
| New South Wales | 4,693 | 8,592,524 | 5.46 |
| Australia | 14,457 | 27,613,654 | 5.24 |
Sources: K-Stra analysis of 1 November 2026: childcare and early learning services, and the age of residents, within a 10-minute drive in average traffic of 5 Peter Brock Drive, Oran Park. Businesses: K-Stra places catalogue, October 2026. Residents: ABS population estimates at 30 June 2025. Spending: ABS national accounts, 2024–25.
Does Oran Park have enough childcare?
Per resident it looks well served: 7.43 services per 10,000, above the Camden council area at 6.96 and New South Wales at 5.46. Per child it is tighter: with 5,721 children under five, there are about 124 for every service, against about 105 across Australia (5.5% of residents under five, over the national count of services), and 11 of the 46 services are family day care, which takes only a few children each.
The opportunity map points to the newer estates, near 2 Sharman Close, Harrington Park; 2 The Hermitage Way, Gledswood Hills; and 4 Healy Avenue, Gregory Hills. The highest market gap is near 50 Centenary Place, Catherine Field, at 189 against 100 for the typical spot.
 Age · Oran Park
How much does a childcare analysis cost?
The Oran Park example cost 42 credits. A whole growth corridor costs the same: you pay for the questions, not the size of the area.
- Markets & Brands, Childcare & early learningper sector, any area40 credits
- People & Economy, Ageper topic2 credits
- Maps, tables and exports of the resultsFree
- Total= 42 credits
- ≈ A$64 at the Single report pack rate of A$1.53 a credit; less with larger packs and monthly plans.
Optional, not in the total
- People & Economy, Population trendper topic+ 2 credits
- Compare candidate sitesper candidate site+ 20 credits
The estimate appears before each run starts, and a run that fails costs nothing.
What do people opening a childcare centre ask next?
Who lives around the site?
Families, children, income and housing of the residents, against the council, the state and Australia.
Demographic analysisWhich of my candidate sites is stronger?
Run the same model on one to five addresses and compare the residents’ spending each could capture, and from which services. It counts residents’ spending only, so use it to compare sites in the same sector and area: the absolute value is an order of magnitude, and workers, commuters, tourists and passing trade are not in it.
Retail site selectionWhere should the next centre in my group go?
Rank candidate sites by the new residents they would add to your network, one step at a time.
Store network planning
What else do people ask about childcare locations?
Does K-Stra know how many licensed places a centre has?
No. K-Stra counts childcare services and their locations from public online listings, not licensed places, occupancy or quality ratings. A large centre and a family day care educator count as one service each; check capacity with the official registers.
How many childcare services are there per resident in Australia?
14,457 childcare and early learning locations for 27,613,654 residents, or 5.24 per 10,000, in the K-Stra catalogue of October 2026. Schools are a separate sector.
Which childcare businesses are in the sector?
Long day care centres, family day care services, kindergartens, preschools and childcare agencies, each with the category of its listing. In the Oran Park example: 24 child care centres, 11 family day care services, 7 kindergartens, 2 preschools, 2 child care agencies.
Can I see how fast the number of children is growing?
The Population trend topic of People & Economy shows residents year by year from 2019 to 2025 for any catchment, and Age splits them into five-year groups. Each costs 2 credits.
Can I analyse schools?
Yes. Schools are a sector of their own, with locations, density and competition. A childcare analysis can add schools, GPs, pharmacies, supermarkets, toy stores, gyms and pools as neighbouring categories for 2 credits.
Count the children
around your centre.
Type an address, pick Childcare and read children, services and the gaps on one map.
Open the app — free to exploreExploring the map is free; you pay only for the analyses you run