
What is a catchment area, and how is it measured?
Every store, clinic and gym draws its customers from a limited area. Knowing its shape and who lives in it is the first number of any location decision.
A catchment area is the territory where most of a business’s customers live, usually drawn where about three quarters of them come from. It is measured by travel time from the site on the road network, split into bands such as 5, 10 and 15 minutes, and described by the residents, households and spending inside each band.
This guide explains what a catchment is, how to draw one and, in the trade area analysis section, what to read inside it: spending, competitors and your own customers.
Where does a catchment area end?
Customers do not stop at a line. Some come from next door every day, others from across town once a month. A catchment draws the line where most of them are: a common rule of thumb is the area where about 75% of customers live.
The idea of a sharp border is itself a simplification. In 1963 David Huff proposed replacing it with probabilities: each home has a chance of choosing each store, falling with distance and rising with the size of the store. The bands most analysts draw today are a practical version of that gradient.
Sources: Pesch and Ryan (2022), “Trade Area Analysis”, University of Wisconsin–Madison Division of Extension; Huff (1963), “A probabilistic analysis of shopping center trade areas”, Land Economics 39(1).
Primary zone
The closest band, where customers come most often.
Newcastle example · 0–5 minutes: 20,475 residents, 17.5% of the catchment
Secondary zone
Customers who come less often or for a reason.
Newcastle example · 5–10 minutes: 43,955 residents, 37.6%
Tertiary zone
Occasional customers and those passing through.
Newcastle example · 10–15 minutes: 52,436 residents, 44.9%
What are the ways to draw a catchment area?
Five methods are in common use. They differ in what they assume about how people choose where to shop.
| Method | How it works | Good for | Watch out |
|---|---|---|---|
| Circle | A fixed radius around the site | Quick, and the only option when a rule is set in straight-line distance | Ignores roads, rivers and rail lines; counts people who cannot reach you |
| Drive or walk time | Everyone who can reach the site within a time on the road network | Follows how people actually travel | Needs a road network and a choice of traffic and mode |
| Nearest store | Each home assigned to the closest store (Thiessen polygons) | Simple way to split an area between stores | Assumes everyone goes to the nearest one |
| Gravity model | A probability for each home and each store, from size and distance | Handles competition and overlapping areas | Needs a model of each store’s pull |
| Customer spotting | Plot real customers from a loyalty or delivery file | Shows the catchment you actually have | Only exists for stores already open |
Drive and walk times are the usual starting point, because they follow the road network and need no customer data. The difference between a circle and a travel time is explained, with four maps of the same address, in isochrone, isodistance or radius.
What does a catchment look like in practice?
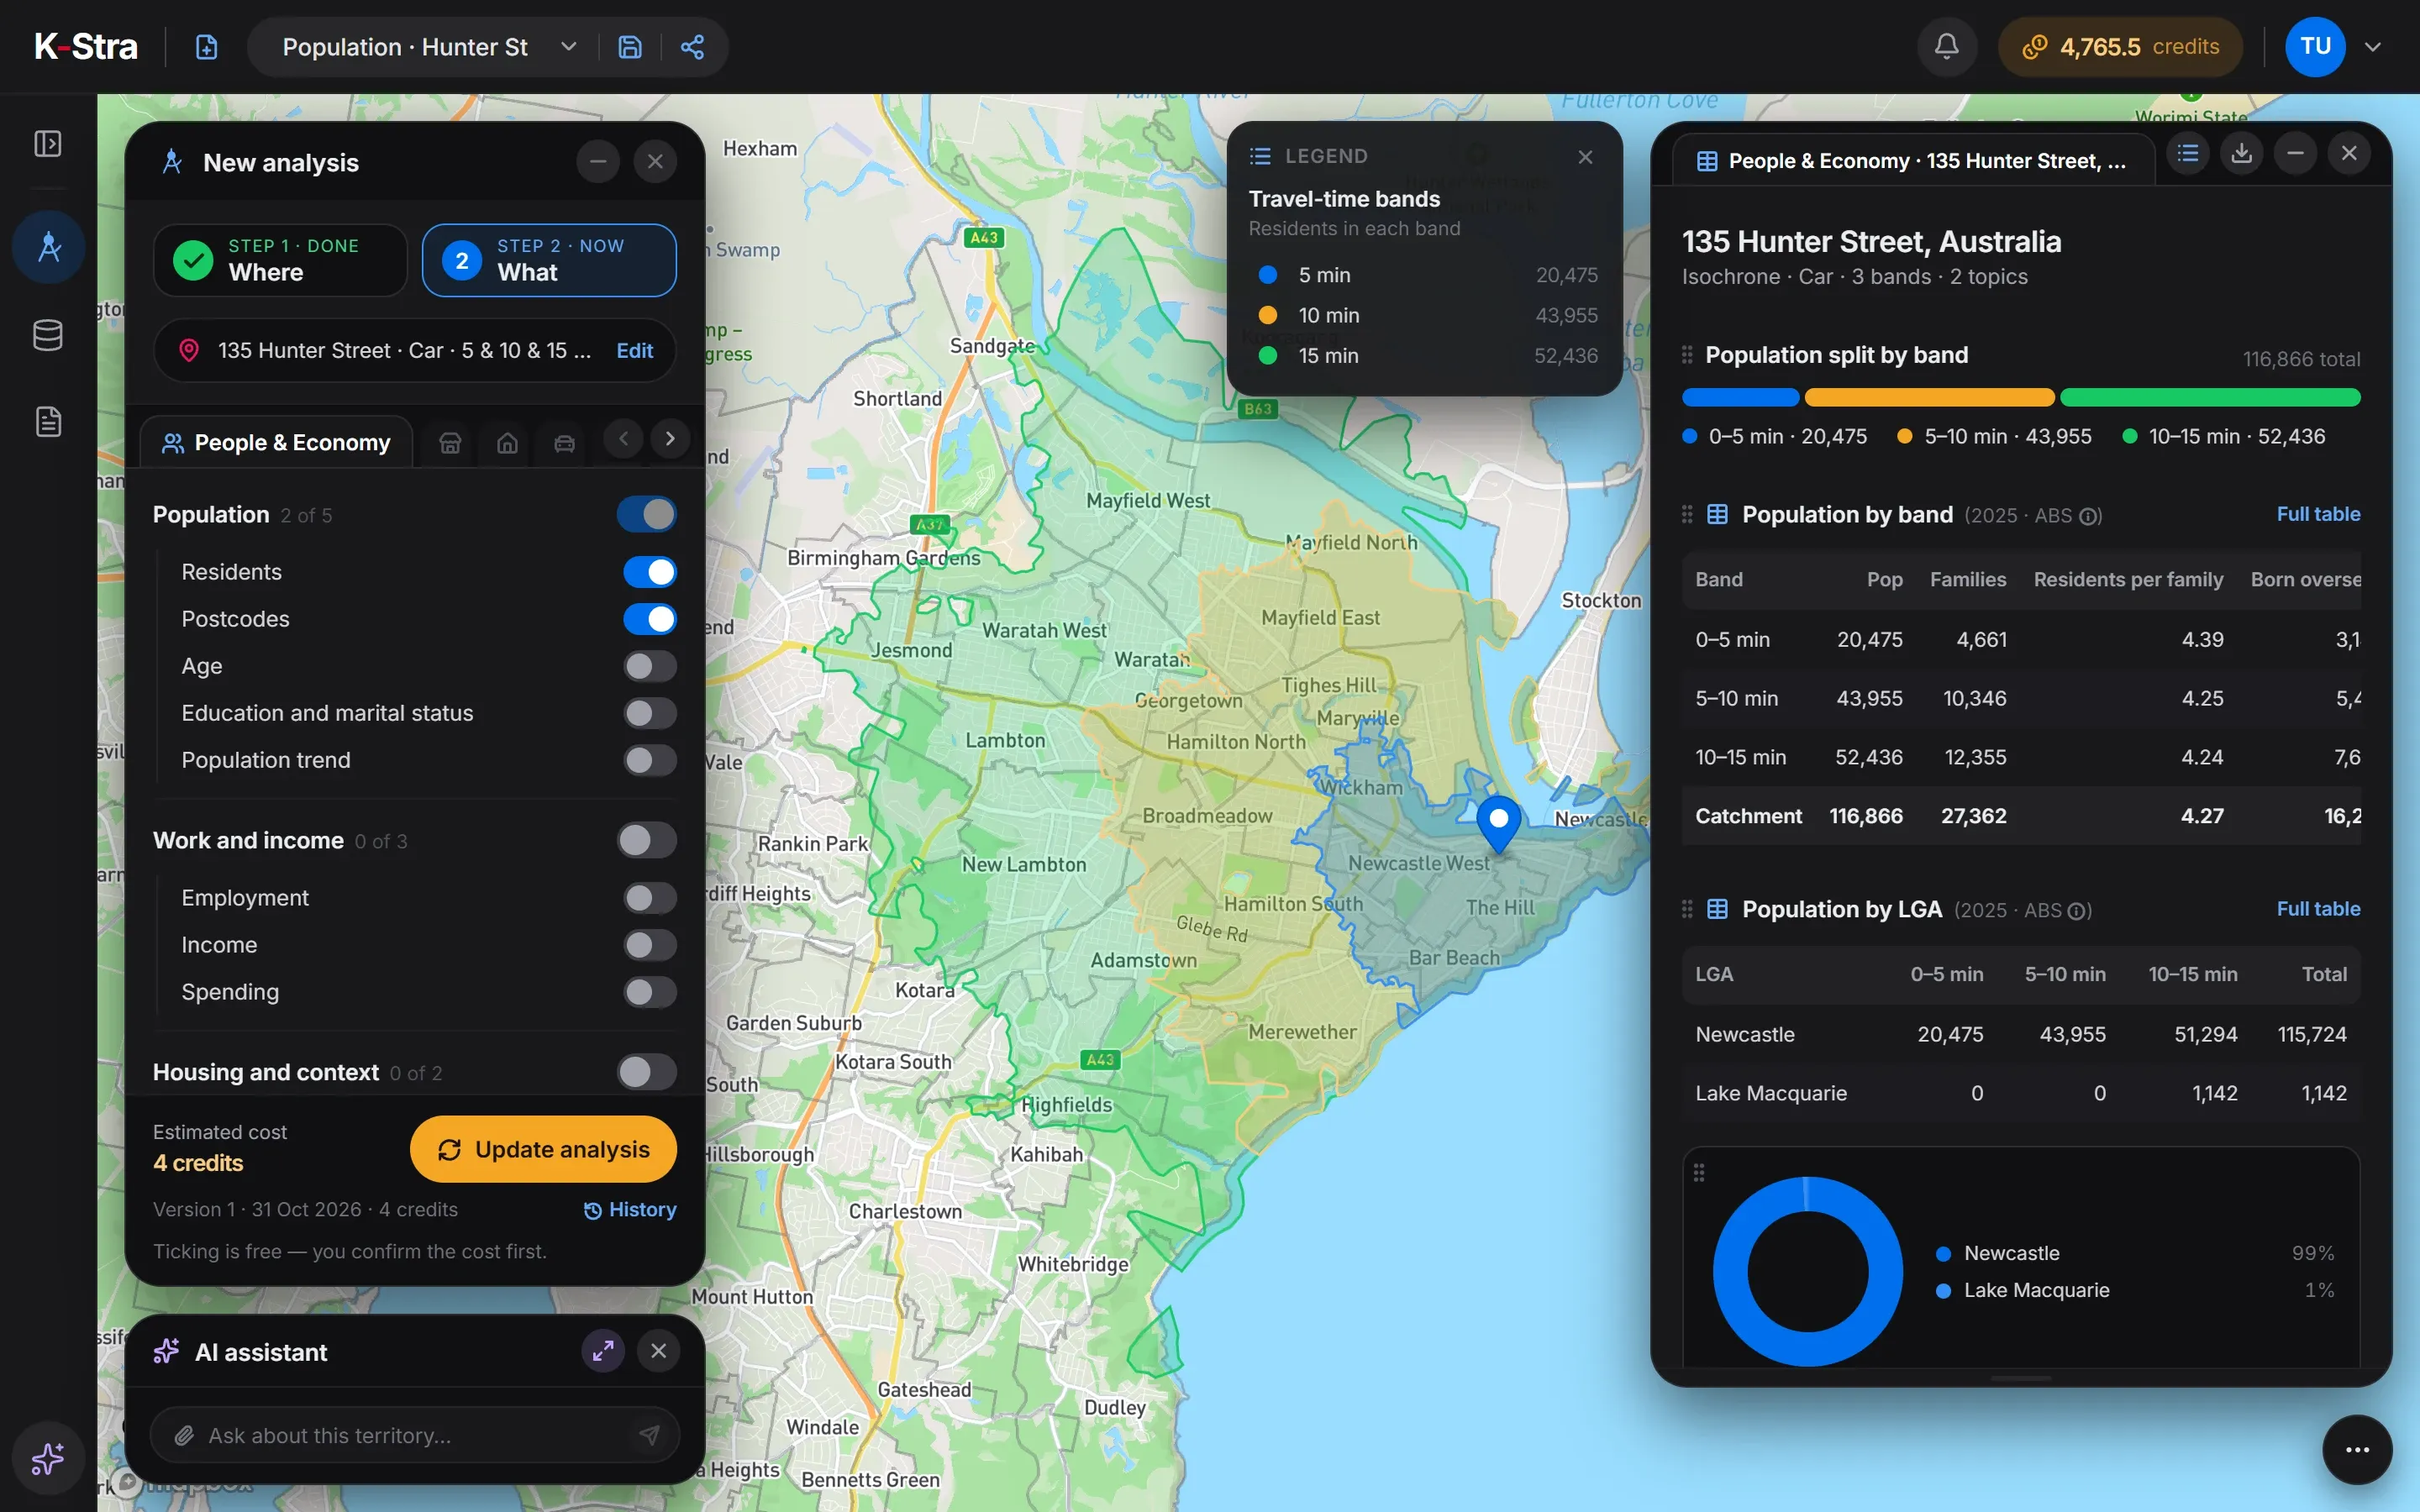 Newcastle, NSW
From 135 Hunter Street, Newcastle NSW, the first five minutes by car reach 20,475 residents, only 17.5% of the catchment. Each band is larger than the one before it, because the ring of streets grows with distance: 52,436 people live 10 to 15 minutes away.
Nearly all of them, 115,724, live in the City of Newcastle; 1,142 are across the border in Lake Macquarie. For a business that relies on regular visits, the primary zone is small here, and the case for the site rests on the secondary and tertiary bands.
On-screen text
Where · Catchment area. Your catchment, drawn on the real road network. 5, 10 and 15 minutes by car from Darby Street, Cooks Hill, Newcastle. Type an address. 5 and 10 minutes by car, street by street. Add a band: 15 minutes. Bands follow the roads, not a circle. Residents in each band. 122,078 residents within 15 minutes. Know who lives within reach. Residents: ABS 2025 estimates. Drive times along the road network, average traffic.
Why do postcodes not match a catchment?
The Newcastle catchment touches 18 postcodes, and few of them sit inside one band. Postcode 2291 has residents in all three: 2,505 within five minutes, 11,885 within ten and 922 within fifteen.
The central postcode 2300 is the opposite case: 12,609 of its 12,762 residents are within five minutes. Counting residents address by address, and only then adding them up by postcode, keeps both cases right.
Source: K-Stra analysis of 31 October 2026: 5, 10 and 15 minutes by car in average traffic from 135 Hunter Street, Newcastle. Population: ABS estimates at 30 June 2025, counted address by address; postcodes are the ABS Postal Areas.
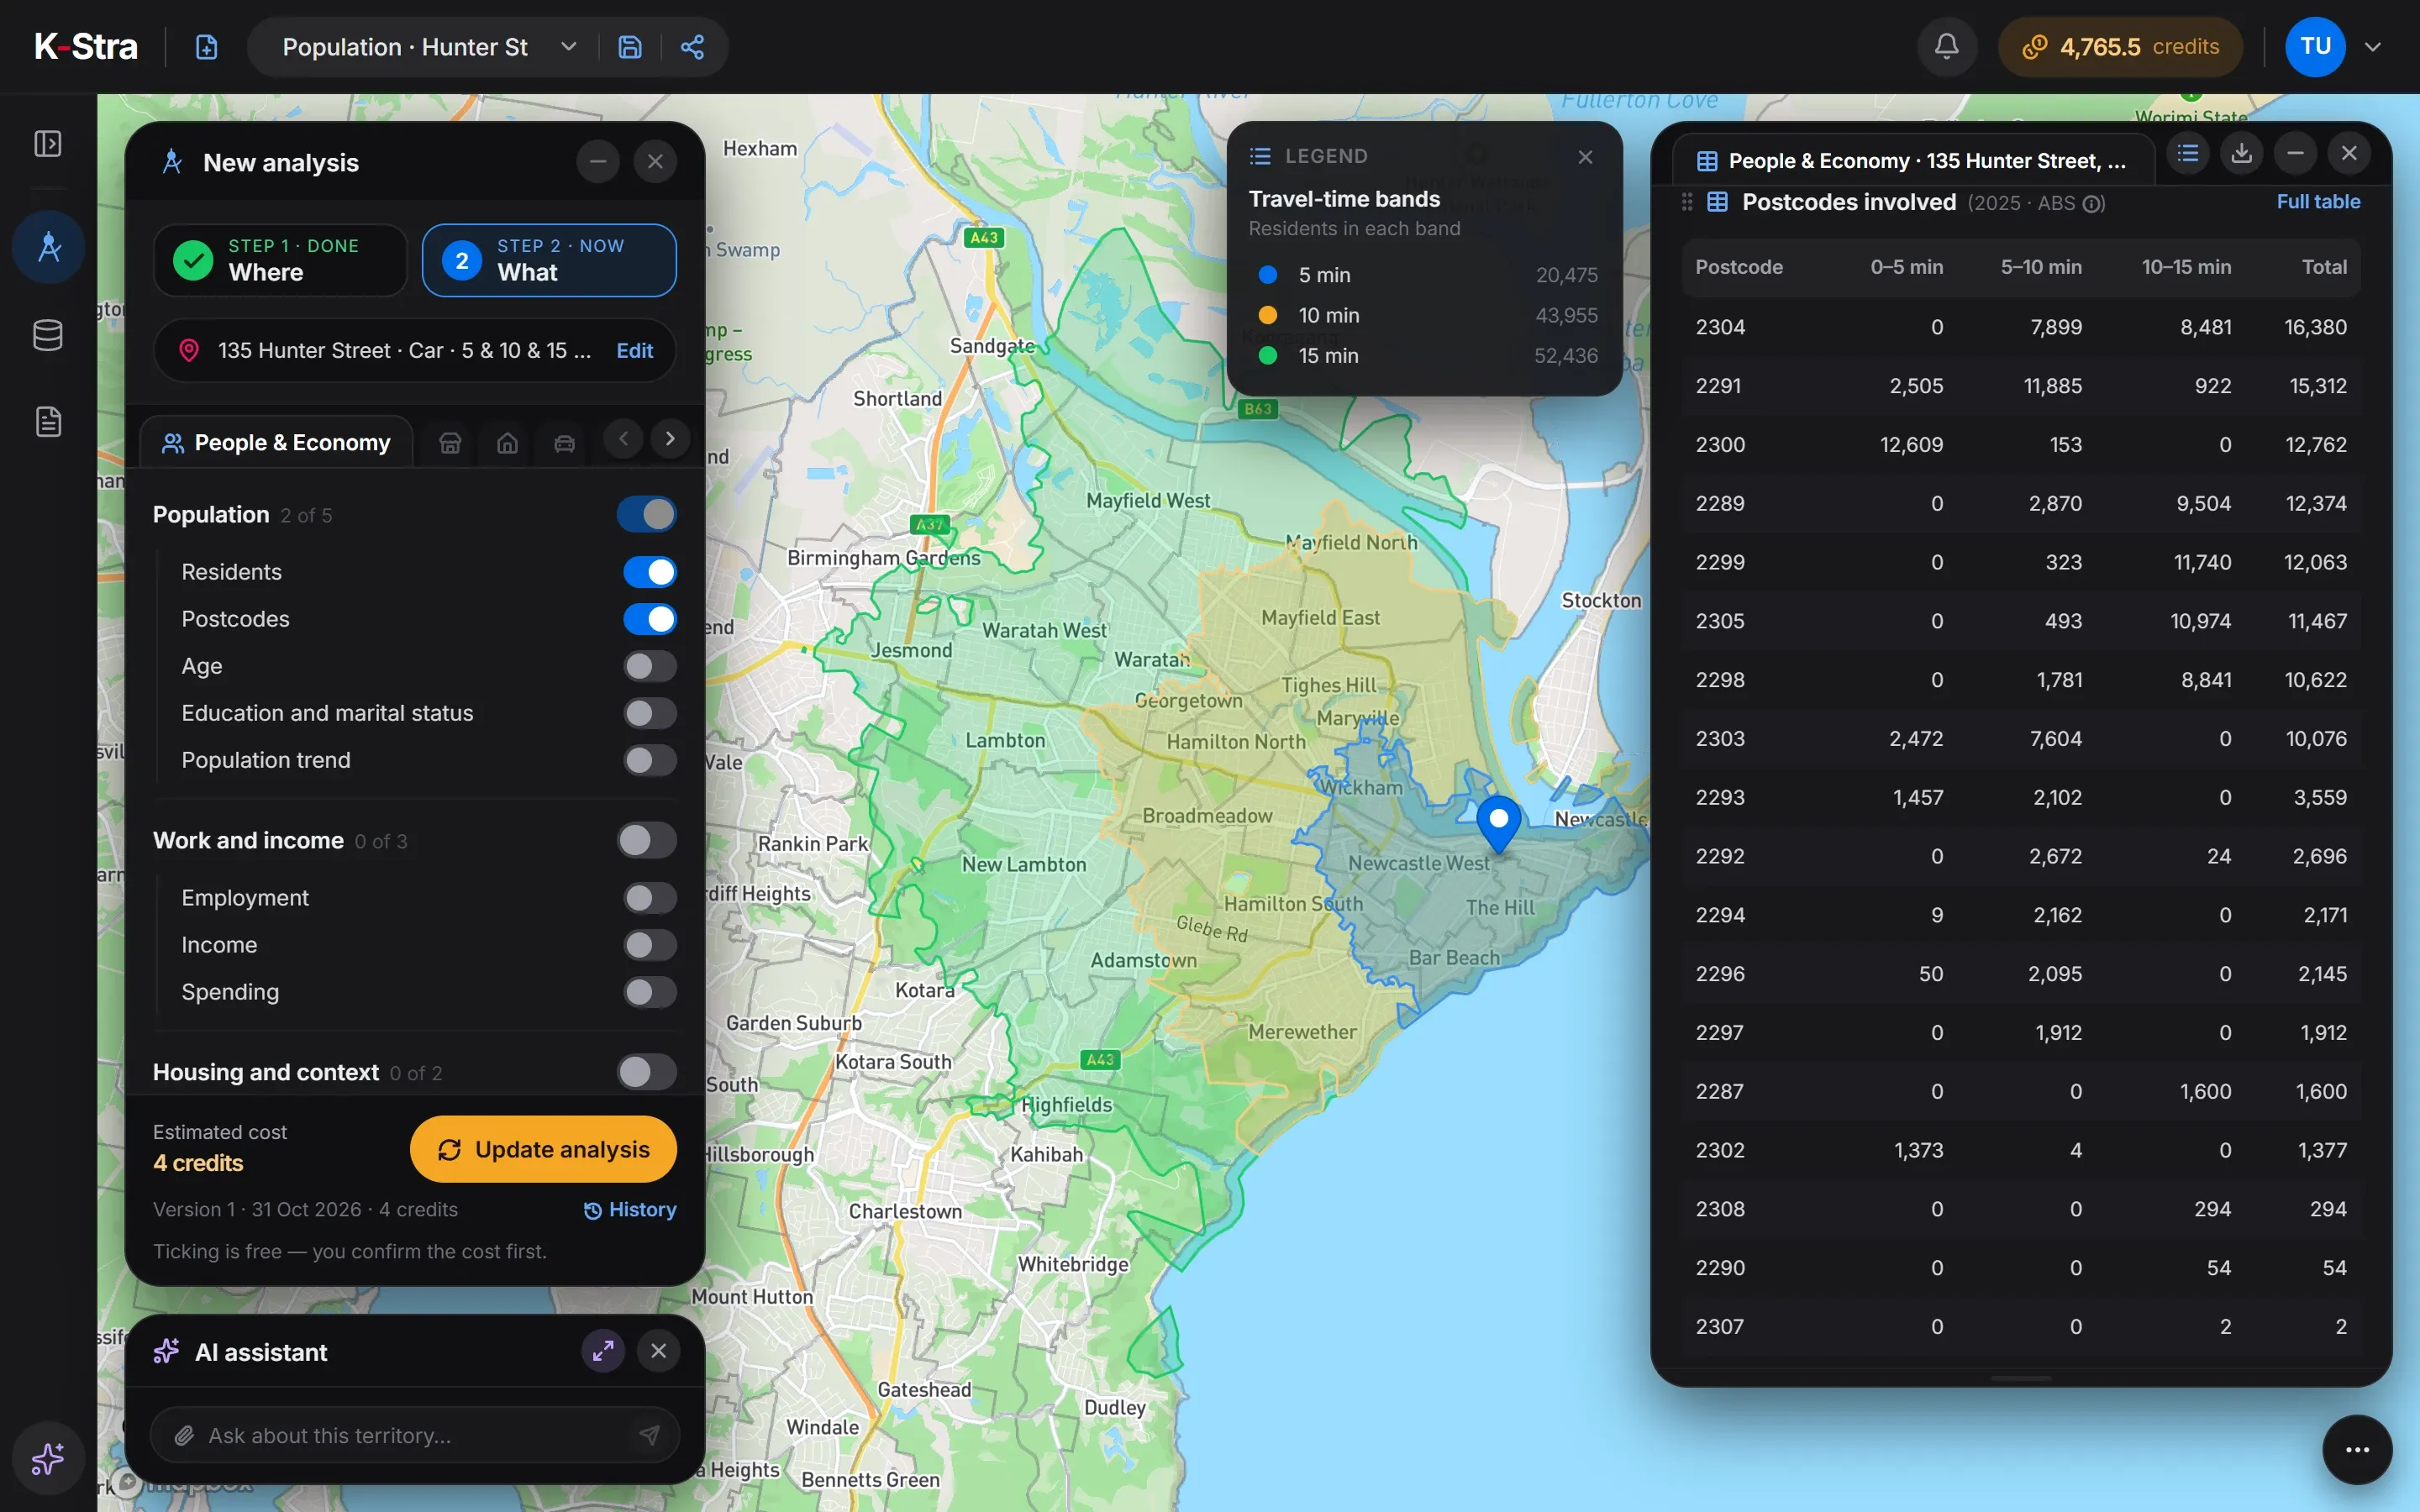 Postcodes involved
What do you read inside a catchment or trade area?
Drawing the area is the first step; the analysis is what you read inside it. A trade area analysis answers whether a place has enough customers, with enough money, for the businesses that serve it: shopping centre owners use it to choose tenants, retailers to size a store, councils to plan activity centres and lenders to check a business plan.
Its methods go back to the 1960s, when Applebaum set out ways of determining store trade areas and market penetration, and Huff replaced fixed borders with the probability that each household chooses each centre. The modern version keeps both ideas: the area follows the roads, and the spending inside it is shared among competing stores by their pull and distance.
Draw the area
Use the drive or walk your customers make, or, if you have customer addresses, the area that holds about 75% of them. Split it into two or three bands.
Count who lives there
Residents, households, age and origin, band by band, with the councils the area falls in.
Measure spending by category
What residents spend each year on food, clothing, furnishings, recreation and the rest, from household spending statistics.
Map the competition
Every competing business or centre in the area, with how many there are per 10,000 residents against the region and the country.
Map your customers
Where existing customers live, from loyalty cards or postcodes collected at the till, against the residents of each area.
Read the gaps
Areas with high spending and low supply, and areas inside the trade area where few residents are your customers yet.
Sources: Applebaum (1966), Journal of Marketing Research 3(2); Huff (1963), Land Economics 39(1); Pesch and Ryan (2022), “Trade Area Analysis”, University of Wisconsin–Madison.
What does the trade area of a regional centre hold?
Take the centre of Penrith, on the western edge of Sydney. Within a 15-minute drive of 7 High Street, Penrith NSW live 209,625 people in 52,508 families. Most are in the City of Penrith, but 11,256 come from the Blue Mountains and Blacktown: a trade area rarely respects council borders.
Those residents spend about A$56,468 a head a year, A$11.8 billion in all. Recreation, sport and culture is a bigger budget than food, A$5,919 a head against A$5,180, which favours centres with cinemas, gyms and dining. With 47 shopping centres and department stores, 2.24 per 10,000 residents against 1.87 in Australia, a new centre would have to win spending from existing ones.
| Category | Per resident (A$ a year) | All residents (A$ M a year) |
|---|---|---|
| Recreation, sport and culture | 5,919 | 1,241 |
| Food and non-alcoholic beverages | 5,180 | 1,086 |
| Restaurants and accommodation | 4,935 | 1,035 |
| Furnishings and household equipment | 2,491 | 522 |
| Clothing and footwear | 1,940 | 407 |
Source: K-Stra analysis of 1 November 2026: shopping centres, and residents and their spending, within a 15-minute drive in average traffic of 7 High Street, Penrith. Businesses: K-Stra places catalogue, October 2026. Residents: ABS population estimates at 30 June 2025. Spending: ABS national accounts, 2024–25.
What else do people ask about catchment areas?
How big should a catchment area be?
It depends on the business and the place. A convenience store lives on a few minutes’ walk; a hardware store or a specialist clinic on 15 to 30 minutes’ drive. Distance tolerance also grows outside cities: in a study of rural Victoria and New South Wales, residents accepted up to 54 minutes of travel to see a doctor in sparse areas and 32 in denser ones (McGrail, Humphreys and Ward, BMC Health Services Research, 2015).
Why not use postcodes as the catchment?
Because travel time ignores postcode borders. Around Hunter Street, Newcastle, postcode 2291 falls in all three bands at once, so treating it as one block would count 922 people 10 to 15 minutes away as if they were next door. Postcodes are useful to report the catchment, not to draw it.
Do two stores of the same brand share a catchment?
They can. Where their catchments overlap, the same residents are within reach of both, and a new store draws partly on customers the other already has. Measuring that overlap before opening is called a cannibalisation analysis.
Does a catchment change with traffic?
Yes. Ten minutes in heavy traffic reach fewer streets than ten minutes in average traffic. Choose the traffic that matches your opening hours and keep it the same when comparing sites.
Is a catchment the same as a trade area?
Yes, they mean the same thing: the area a store or centre draws most of its customers from. Retail planners and shopping centre owners tend to say “trade area”; geographers and public services say “catchment area”. What to read inside the area is in the trade area analysis section of this guide.
Does a trade area analysis count tourists and workers?
Not if it is built on residents, as most are. In city centres, tourist towns and around stations the real market is larger than the residents’ spending suggests, and the figures are a floor.
Draw the catchment
of any address.
Type an address, keep 5, 10 and 15 minutes by car, and see the bands follow the roads.
Open the app — free to exploreDrawing catchments is free