
How do I judge the location and value of a property?
Before buying, leasing or lending against a property, put its price and its location next to the evidence: what similar properties sold for, what is within reach, and how fast the market moves.
Judge a property’s location and value on three kinds of evidence. Comparable properties nearby, sold and on the market, give a price range. Services within a short drive, such as schools, health, shops and transport, show how well served the location is. And how similar properties leave the market shows how easily it would sell.
Why is a property’s value hard to read from listings alone?
Advertised prices are not sale prices. Agents list the low end of a range or an “offers over”, so an asking figure is a floor rather than a target, and a price search returns a mix of both.
Comparables are also chosen loosely. A radius on a map takes in properties across a river or a highway that no buyer would weigh against each other, while a short drive away the right ones are left out.
And location is more than a suburb name. What matters is what can be reached from the door, and whether similar properties sell readily or sit while their prices are cut.
of 53 house sales within 10 minutes of central Launceston, with an earlier advertised figure on record, closed above it. An asking price is a starting point, not the price.
K-Stra Real Estate analysis of 1 November 2026, 10 minutes by car from 100 Brisbane Street, Launceston TAS: property portal listings to 19 October 2026, sold properties with the sale price the portal published.
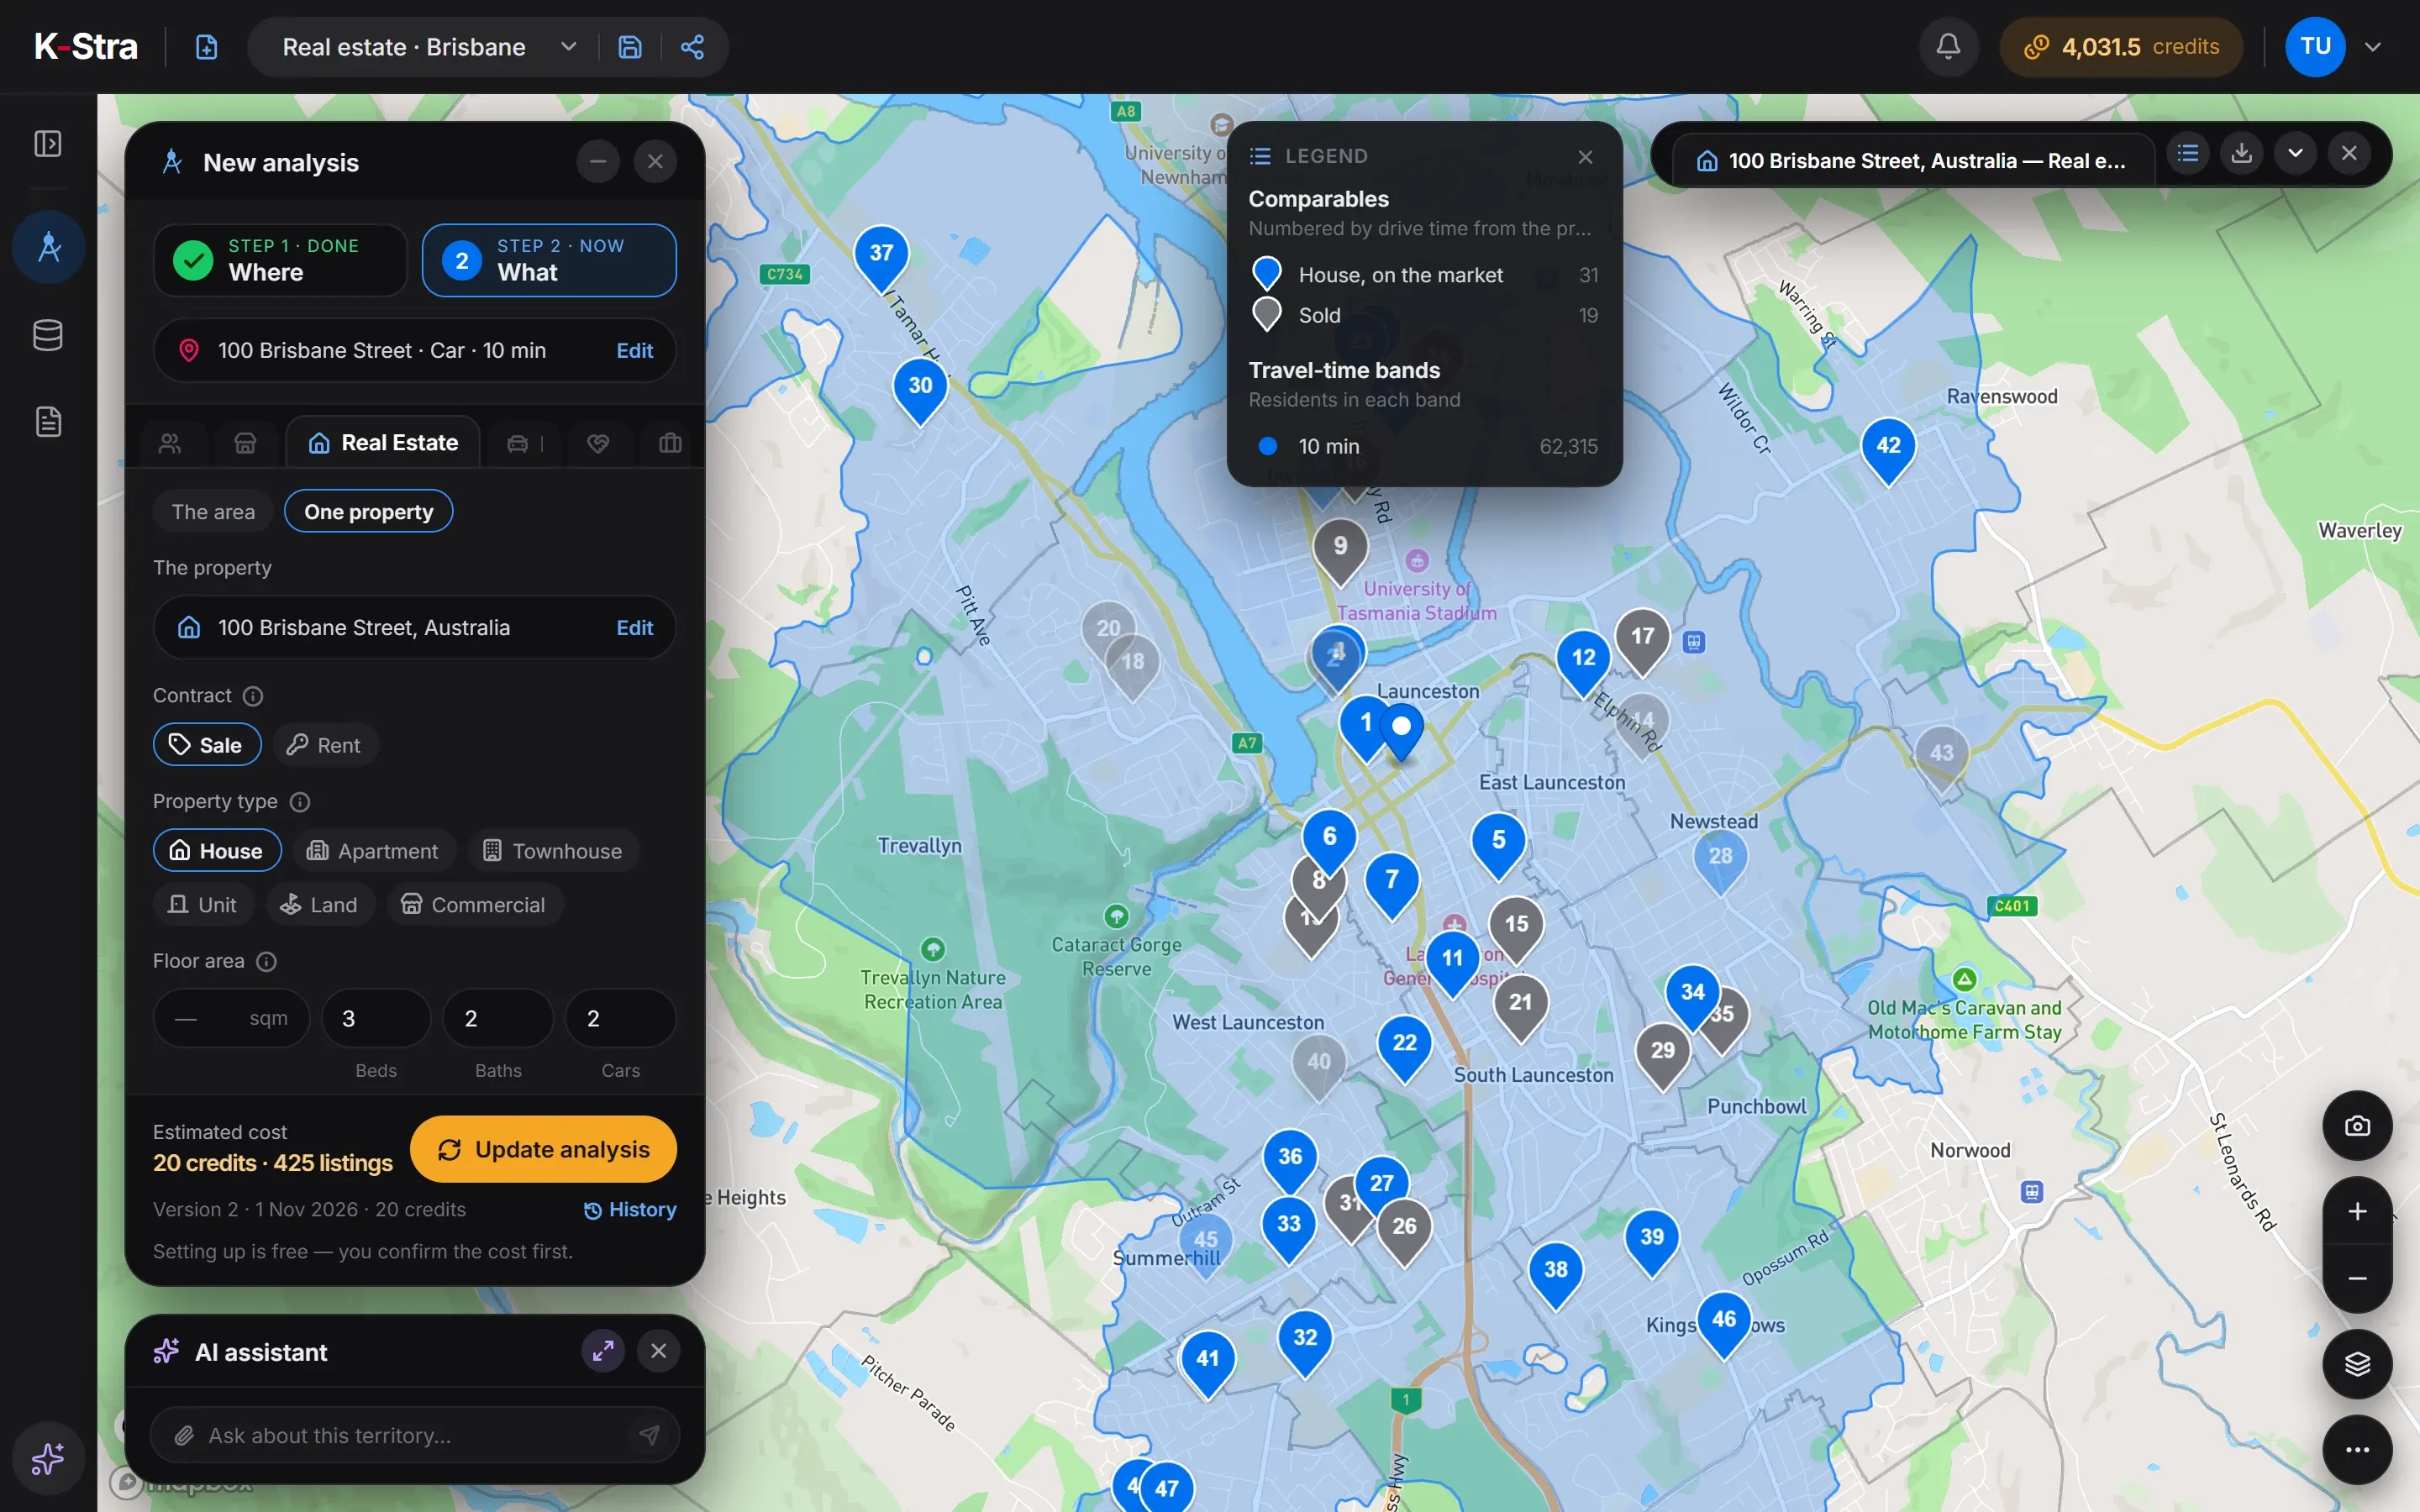 One property · Launceston
How do you analyse a property’s location and value, step by step?
Describe the property
Sale or rent, type, floor area if known, bedrooms, bathrooms and car spaces.
Set the comparison area
A drive time from the property, so comparables are where a buyer would also look, not across a river or a highway.
Collect comparables
Similar properties sold and on the market in the last twelve months, with outliers left out and the nearest first.
Read a range, not a number
The middle half of the comparables’ prices, with sold and advertised kept apart.
Check what is within reach
Schools, health, groceries, shopping and transport, timed by car from the door.
Check how the market moves
How many similar listings sold, how often asking prices were cut and by how much, against the state and the country.
Apply your judgement
The step from asking price to achieved price, and the final figure, are the analyst’s call.
What data do you need to analyse a property?
An address and a description. Listings, sales, services and population come with the analysis.
The property
An address or a point on the map, and what it is: type, size, bedrooms, bathrooms, car spaces.
How K-Stra worksListings and sales
Property portal listings for sale and for rent, with the sale price where the portal published it.
Real estate dataServices nearby
Schools, health, groceries, shopping and transport, timed by drive from the property.
Markets dataWho lives around it
ABS population, income and households within the same drive time, for the area behind the property.
Demographic analysis
K-Stra runs on a dedicated server in Sydney: your datasets, your analyses and your results stay in Australia. Map tiles, payments and sign-in never see your files. Three steps can: geocoding sends only the address text, and only after you confirm; the AI assistant reads column names and values when you ask it about a dataset; email notifications carry figures from your analysis.Where your data lives. Mark a dataset “session only” and it is deleted 24 hours after upload.
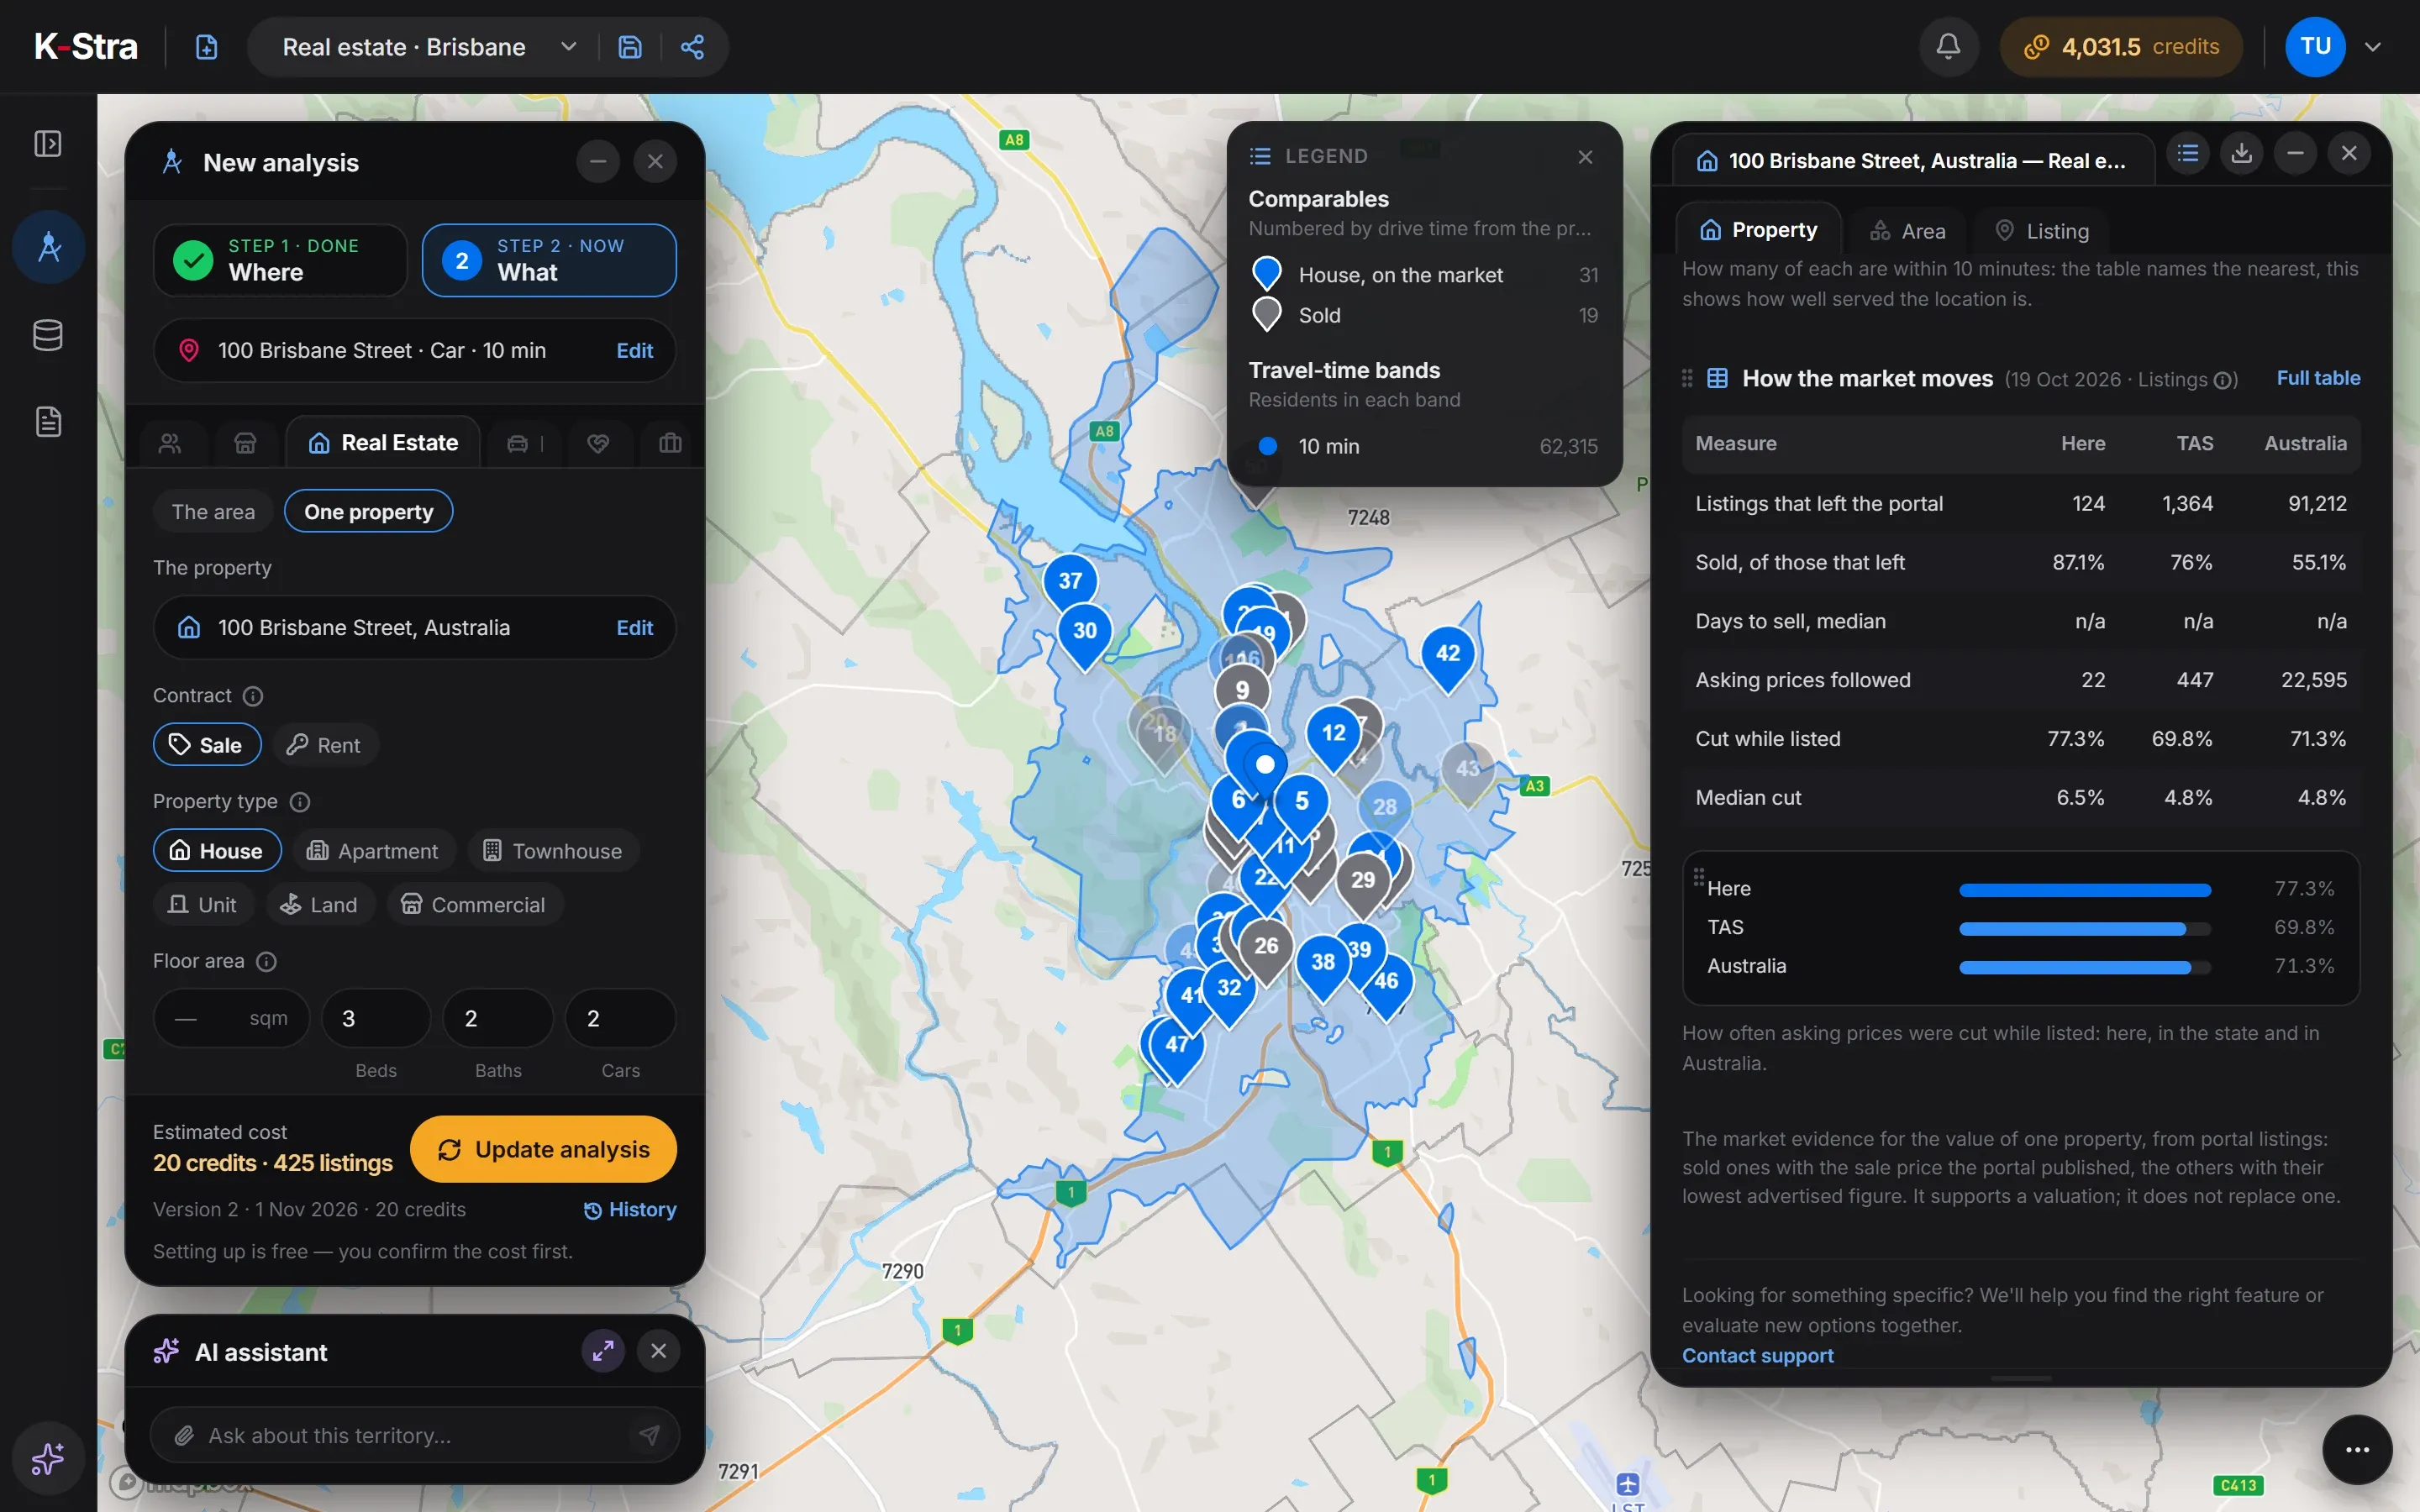
How do you analyse a property in K-Stra?
Real Estate has two modes. The area describes a whole market; One property gathers the evidence for the value of a single property.
- Place the propertySearch the address or click the map, and choose the drive time the comparables come from.
- Describe itPick One property, sale or rent, the type and what you know of size and rooms. 20 credits per property.
- Read the evidenceThe range and median of the comparables, sold against advertised, the services within reach and the market’s liquidity.
- Refine for freeChange the description, exclude a comparable or set your discount on asking prices: the results update at no cost.
The same run includes the area’s market, prices, trend and listings by postcode. The results can go into a property report, exported as PDF or PowerPoint.
What does reading a property market look like in the app?
Transcript
Real Estate reads the property market of an area from its listings: asking prices and rents, and which way they are moving. Choose the area — here, three postcodes in the centre of the Gold Coast — then homes or commercial property, sale, rent or both, and the quarters to read. You get the median asking price and the price per square metre, postcode by postcode, the trend by quarter, how many listings sold and how many cut their price. Where there are rentals, rents and gross yield too. For a single address, One property gives an estimated range from comparable listings — market evidence, not a valuation. Exploring and setting up are free. You only spend credits when you run the analysis.
What does the evidence for one property look like?
A three-bedroom, two-bathroom house with two car spaces, floor area not given, 10 minutes by car from 100 Brisbane Street, Launceston TAS. Forty comparable houses fall within that drive: 27 on the market and 13 sold in the last twelve months. Their middle half runs from A$649,000 to A$824,000.
| Measure | Here | Tasmania | Australia |
|---|---|---|---|
| Range of the comparables (middle half) | A$649K – A$824K | — | — |
| Median, all 40 comparables | A$732K | — | — |
| Median, 13 sold | A$685K | — | — |
| Median, 27 on the market | A$749K | — | — |
| Median per m², 25 with floor area | A$5,408 | — | — |
| Schools · health · groceries within 10 min | 38 · 103 · 30 | — | — |
| Listings that left the portal | 124 | 1,364 | 91,212 |
| Sold, of those that left | 87.1% | 76% | 55.1% |
| Asking prices cut while listed | 77.3% | 69.8% | 71.3% |
| Median cut | 6.5% | 4.8% | 4.8% |
Sources: K-Stra Real Estate analysis of 1 November 2026; property portal listings to 19 October 2026, sold properties with the sale price the portal published, the others with their lowest advertised figure; services from public online business listings, timed by drive. Market evidence, not a valuation.
What does the evidence say about this Launceston house?
The sold comparables sit lower than those still on the market: a median of A$685,000 against A$749,000. That gap is the first thing to judge, because it says how far asking prices are running ahead of what buyers pay.
Yet 57% of local sales went above the last advertised figure and only 25% below, which fits advertised figures being low ends of ranges. Set against the price cuts below, the two signals do not agree on how much to discount an asking price: that is a judgement, and it is yours to set.
The location is well served: a school 310 m away, a doctor 190 m, a supermarket 590 m, and 38 schools within 10 minutes. Transport terminals are the weak point: 2 within reach, the nearest 2.7 km away.
The market is liquid: 87.1% of similar houses that left the portal sold, against 76% in Tasmania and 55.1% across Australia. Prices were cut more often than elsewhere, though: 77.3% of listings had their asking price cut while listed, against 69.8% in Tasmania, and by more, a median of 6.5% against 4.8%.
How much does a property analysis cost?
The price does not depend on the number of listings or the size of the drive time. The other Real Estate mode, “The area”, describes a whole market without a single property and costs 20 credits per analysis.
A different point, drive time or contract, or fresher listings, is a new run at the same price.
- Real Estate, one property20 credits per property20 credits
- The area’s market, services and liquidityincluded in the same runFree
- New description, exclusions and discountFree
- This property= 20 credits
- ≈ A$31 at the Single report pack rate of A$1.53 a credit; less with larger packs and monthly plans. A new free account’s 40 welcome credits cover it.
The cost appears before the run; a failed run costs nothing.
What else do people ask about property location analysis?
Is this a property valuation?
No. It is the market evidence a valuation is built on: comparables, a range, the location’s services and the market’s liquidity. A valuer, an investor or an agent uses it to set a figure; K-Stra does not replace them.
Where do the comparables come from?
From the listings of a major Australian property portal. Sold properties carry the sale price the portal published; the others carry the lowest figure of their advert, the low end of a range or an “offers over”.
Why are sold and advertised prices shown apart?
Because they are different evidence. A sale price happened; an advertised figure is a starting point. Keeping them apart lets you apply your own discount to asking prices only, never to sales.
Can I change the description after the analysis?
Yes, and it costs nothing. Type, floor area, bedrooms, bathrooms, car spaces, the comparables you exclude and your discount can all change after the run. A new point, drive time or contract is a new analysis.
Does it work for commercial property?
Yes, for sale and for lease. Commercial listings are fewer and less often show a price, so in smaller cities a wider drive time may be needed to find enough comparables.
Put the price next to
the evidence.
Describe a property, choose the drive time and see its comparables, the services within reach and how fast the market moves.
Open the app — free to exploreOne property 20 credits, changes free