
How do I choose a location for a real estate agency?
An agency competes for listings before it competes for buyers. Here is how to read the property market around an office and the agencies already working it.
Choose a real estate agency location by measuring the property market within reach — listings, asking prices, rents and how many homes sell — then the agencies already competing for those listings, per 10,000 residents against the council, the state and Australia. An office does best where listings are plentiful and agencies relatively few.
Which real estate businesses does K-Stra map?
K-Stra has two real estate sectors: agencies, and property management. Each is analysed like any other trade, with demand, competition and best locations, and each listing keeps its category — agency, agent or consultant.
What sets this trade apart is the second source next to it: the Real Estate module, with residential and commercial listings from property portals, medians per postcode, rents, yields and how many homes leave the market.
| Sector in the app | Locations | What it counts |
|---|---|---|
| Real estate agencies | 14,736 | Real estate agencies, agents and consultants. |
| Property management | 3,674 | Property managers and rental agencies. |
Source: the Real estate services group in the sector list of the K-Stra app on 1 November 2026, with the names the app uses; business catalogue of 23 October 2026, built from public online business listings. The counts here are the whole catalogue, as on the Australia pages; the national figure in the per 10,000 table of the example below counts only the locations K-Stra can place on an Australian address, so it can be a few places lower, which moves its rate by at most a hundredth.
Which numbers matter most for a real estate agency?
Listings within reach
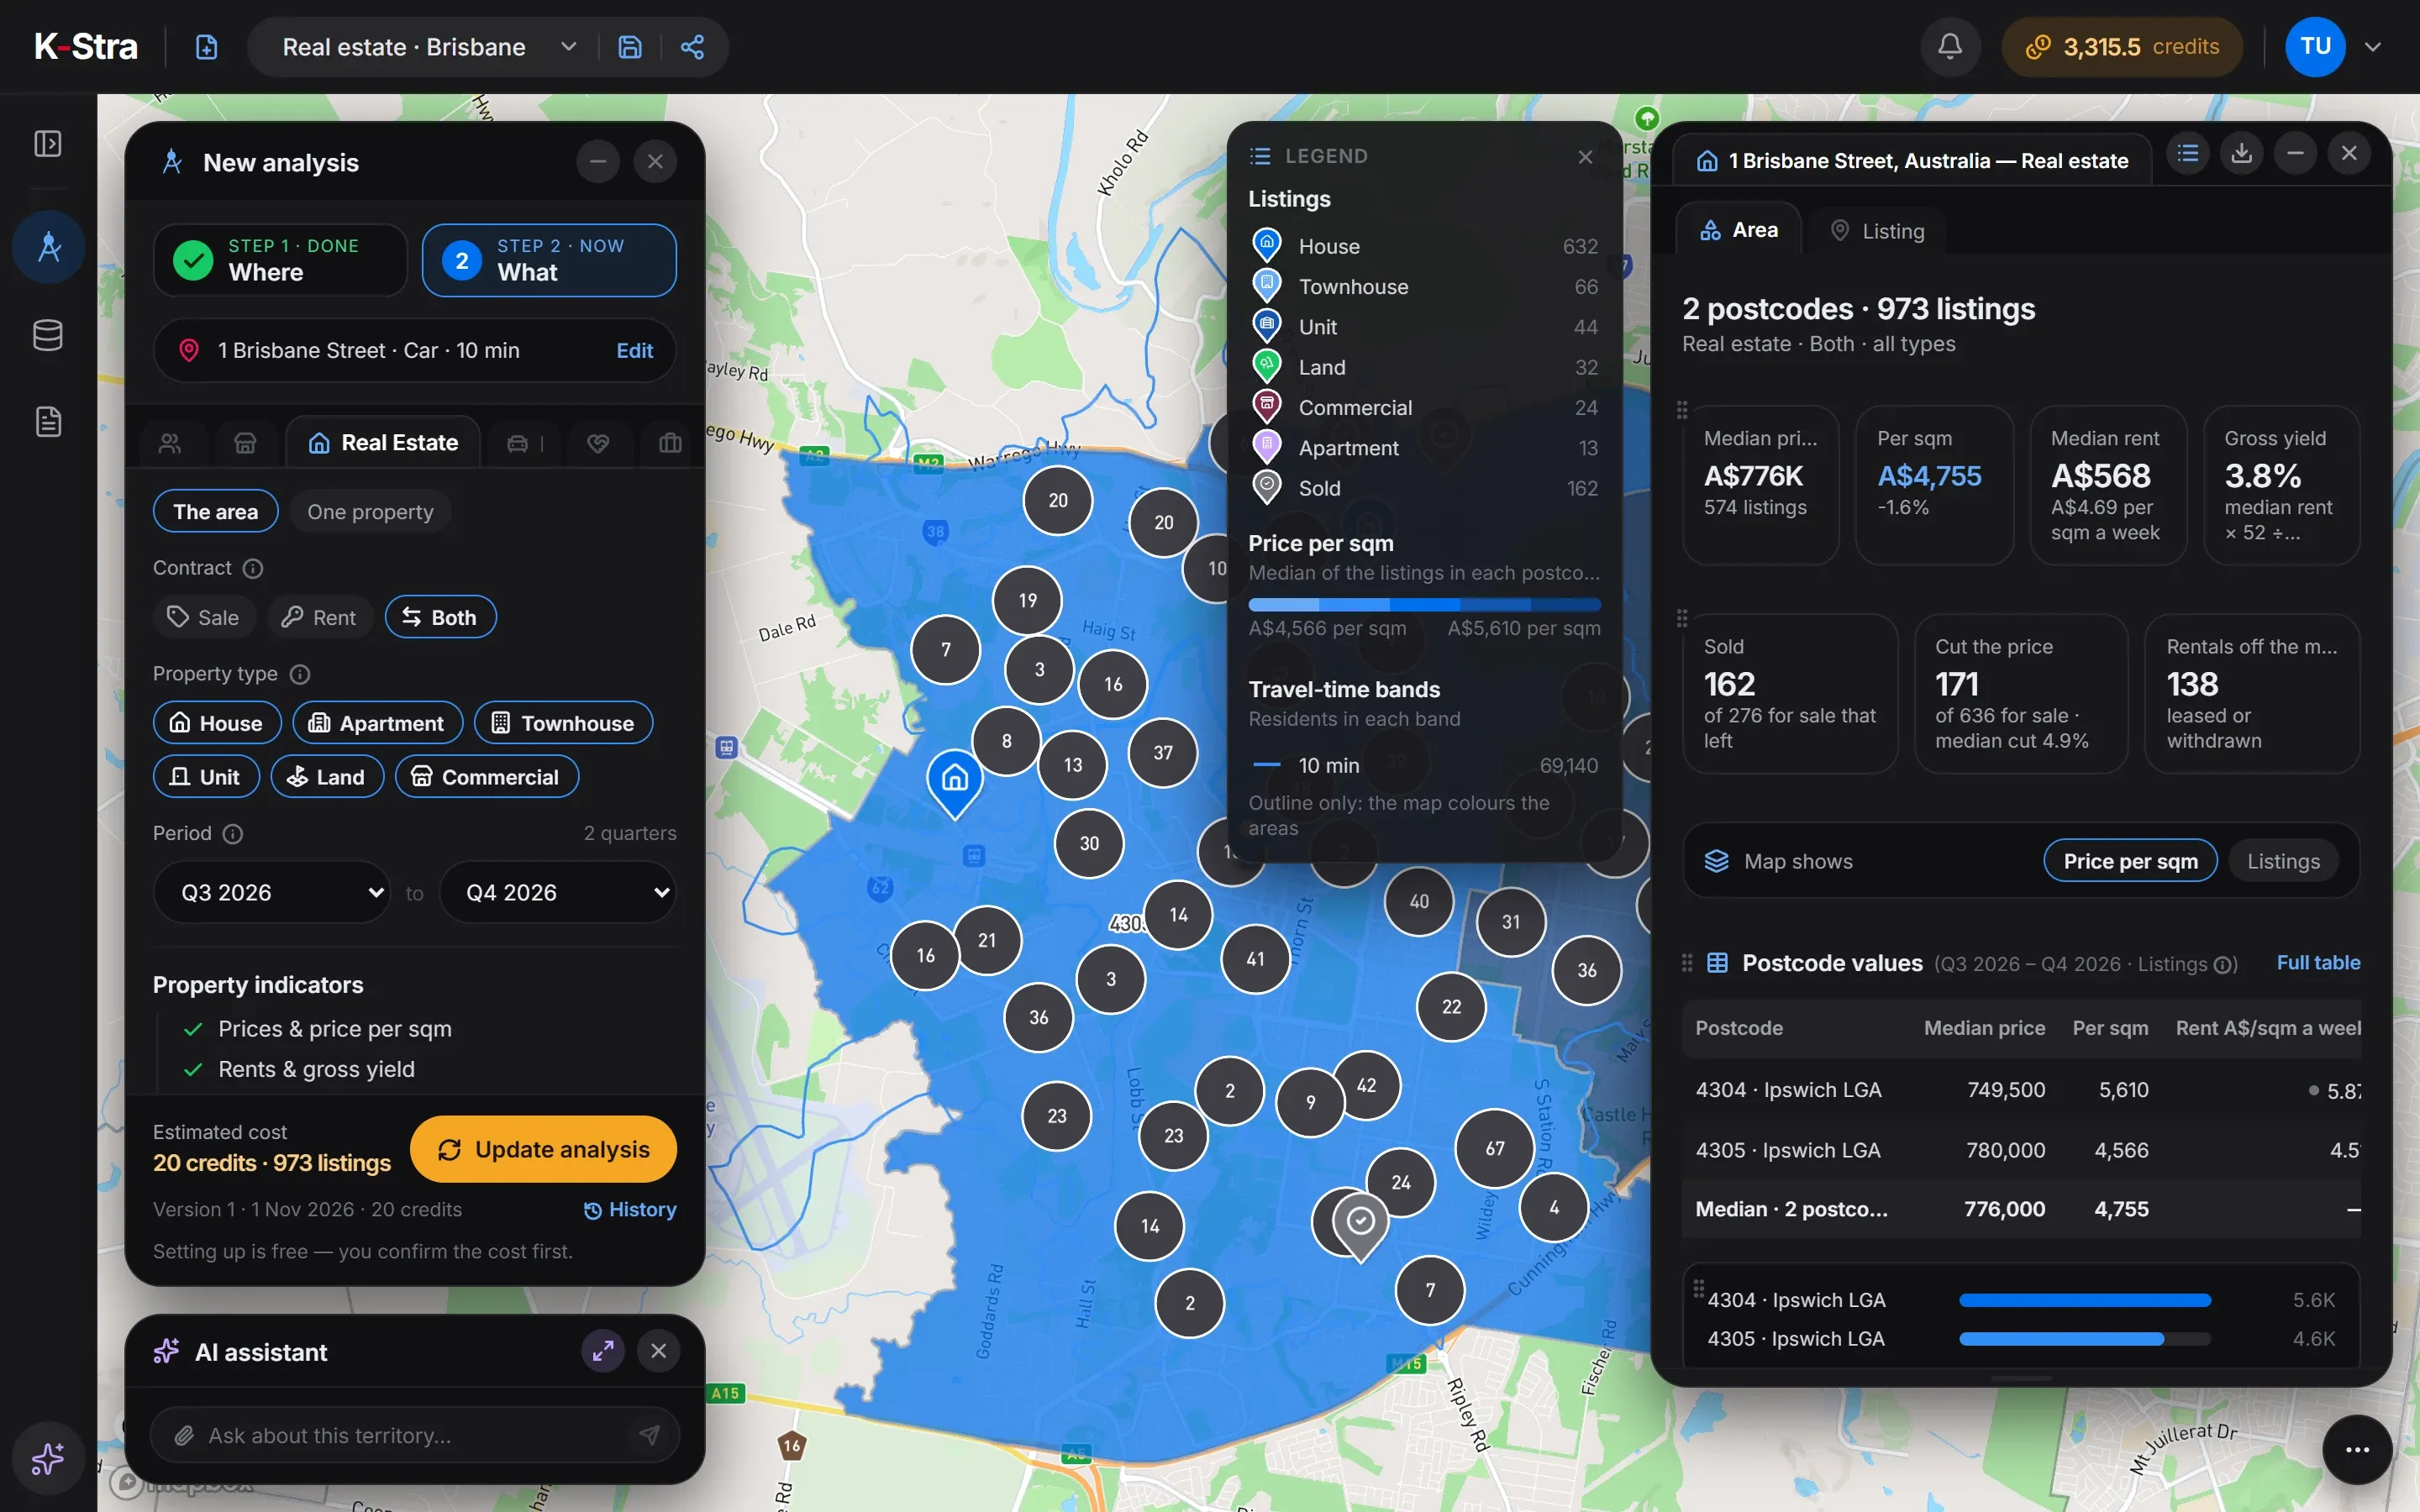
Listings are the raw material of an agency. In the Ipswich example the two postcodes of the catchment had 973 listings for sale and rent from July to October 2026.
In the app: the Real Estate module, The area: listings, medians and trends per postcode.
How many homes change hands
A market where homes sell is worth more to an agency than one where they sit. Around Ipswich 162 sale listings left the portal as sold between July and October 2026, and 138 rentals were leased or withdrawn.
In the app: the Real Estate results: sold, price cuts and rentals off the market.
Agencies per 10,000 residents
Australia has 5.34. A centre far above it shares its listings among many offices; a growing suburb below it may lack a local name.
In the app: the density table: catchment, council, state and Australia side by side.
Prices, rents and yields
The commission on a sale grows with the price, and a strong rental market feeds a property management roll. Median asking price, rent and gross yield per postcode show both.
In the app: the Real Estate results, postcode by postcode, with the price trend over the quarters.
Where agencies are thin
The market gap shows where the spending of residents on property services meets the fewest agencies, which is often where new estates are filling up.
In the app: the Market gap map and the five best locations of the sector analysis.
What data do you need to assess an agency location?
Agencies, listings, prices and residents, already loaded. Nothing needs uploading.
Every agency
14,736 real estate agency locations and 3,674 property managers, with category, rating and reviews, from public online business listings.
Business and competition dataProperty listings
Residential and commercial listings from property portals since July 2026, monthly: asking prices, rents, price per square metre, yield, sold and price cuts.
Real estate dataResidents and housing
ABS population estimates at 30 June 2025 and Census 2021 housing: tenure, dwelling type and how many rent.
Housing dataSpending on property services
Household spending from the ABS national accounts for 2024–25, assigned to the agency sector.
Work, income and spending
How do you analyse an agency location in K-Stra?
Two analyses of the same area: Markets & Brands with Real estate agencies as a whole sector, and Real Estate with The area, sale and rent, all property types.
- Markets & BrandsReal estate agencies as a whole sector: every office with rating and reviews, density and best locations, for 40 credits.
- Real EstateThe area, sale and rent, all types: listings, medians, rents, yields, sold and price cuts per postcode, for 20 credits.
- ReadBoth on the same map, with the postcodes coloured by price per square metre or by number of listings.
What does an agency analysis show?
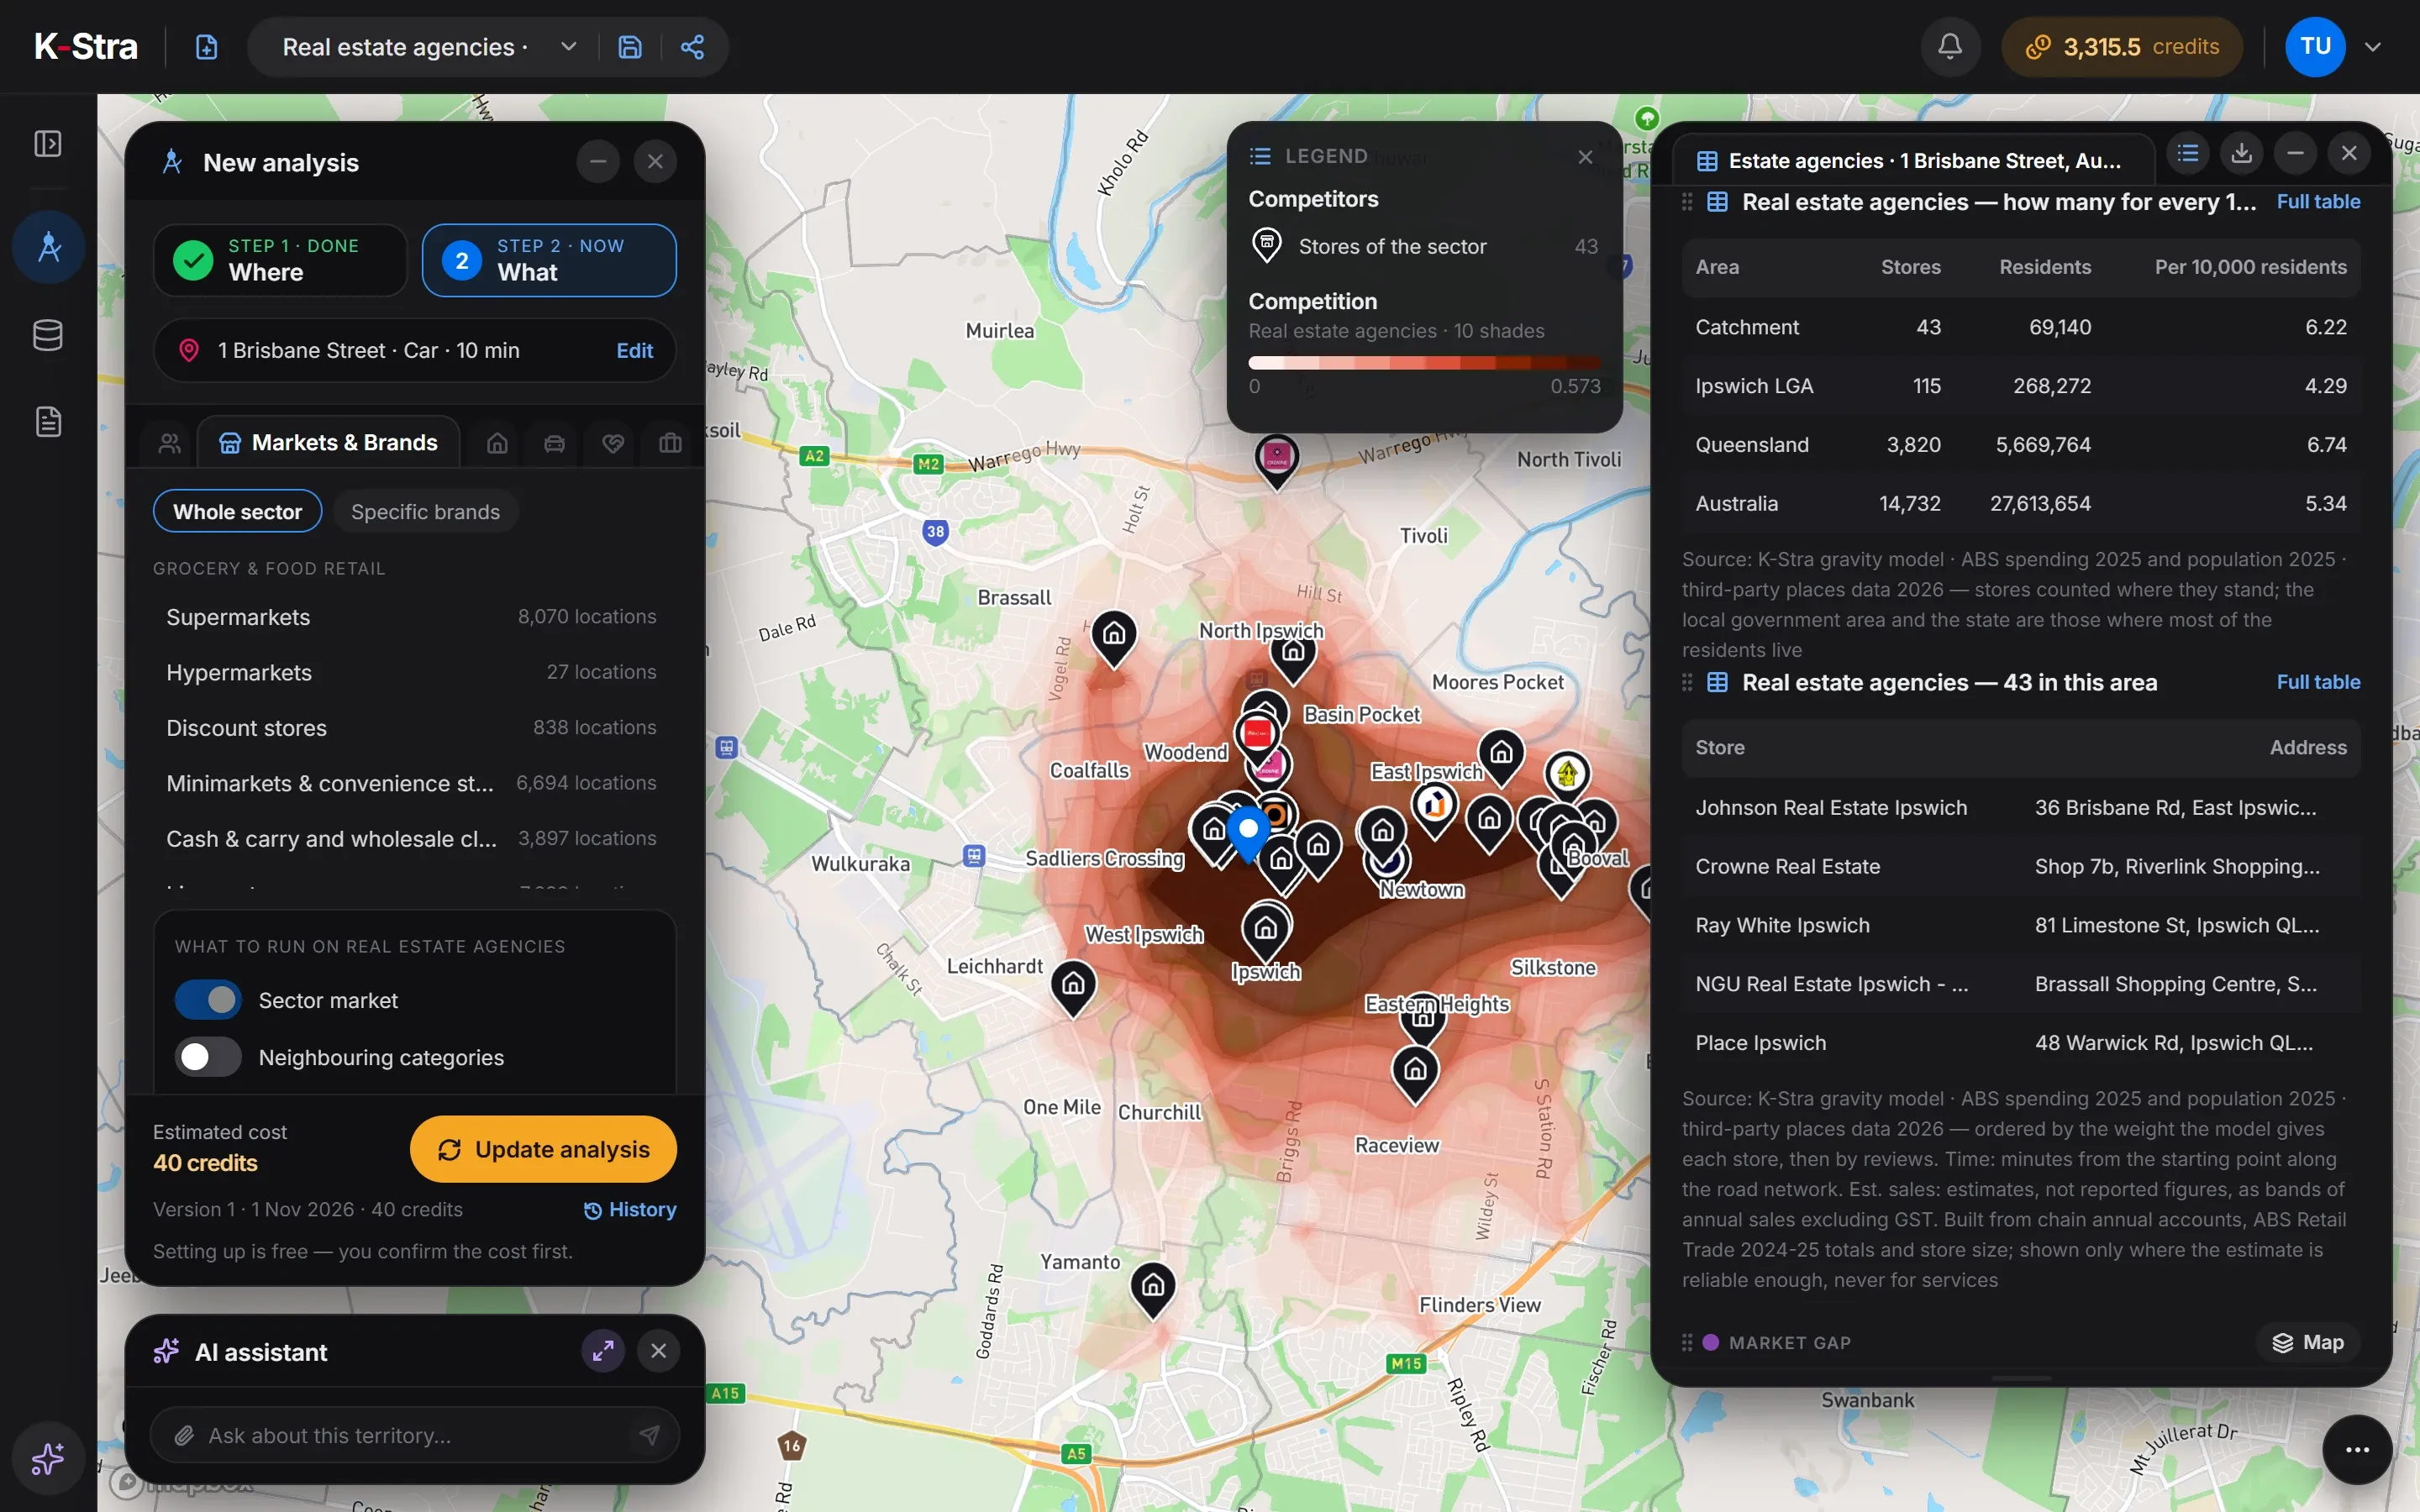
Real estate agencies within 10 minutes by car of 1 Brisbane Street, Ipswich QLD: 43 offices for 69,140 residents, 6.22 per 10,000 against 5.34 in Australia, 10 of them within two minutes of the starting point. In the same area, 973 listings in 2 postcodes from July to October 2026: a median asking price of A$776K and a median asking rent of A$568 a week.
| Area | Agencies | Residents | Per 10,000 residents |
|---|---|---|---|
| Catchment | 43 | 69,140 | 6.22 |
| Ipswich (council) | 115 | 268,272 | 4.29 |
| Queensland | 3,820 | 5,669,764 | 6.74 |
| Australia | 14,732 | 27,613,654 | 5.34 |
Sources: K-Stra analysis of 1 November 2026: real estate agencies, and the residential and commercial property market, within a 10-minute drive in average traffic of 1 Brisbane Street, Ipswich. Businesses: K-Stra places catalogue, October 2026. Residents: ABS population estimates at 30 June 2025. Spending: ABS national accounts, 2024–25. Property: listings on property portals, July to October 2026, asking prices and rents, not recorded sale prices.
Is central Ipswich a good place for another agency?
The centre is busier than the council area as a whole, but not than the state: 6.22 agencies per 10,000 residents against 4.29 for the Ipswich council area and 6.74 for Queensland, the state with the most agencies per resident. The market is active too — 162 homes sold out of 276 sale listings that left the portal, and a gross yield of 3.8% that keeps investors interested.
The median asking price per square metre shows a change of −1.6% over the period, but listings have been collected only since July 2026, so a few months is too short to call a trend;171 of 636 sale listings cut their price. The best location for a new office is near 25 Wildey Street, Raceview, with a market gap of 169, away from the cluster in the centre.
 Property market · Ipswich
How much does an agency location analysis cost?
The Ipswich example cost 60 credits. Real Estate costs the same whatever the number of listings or indicators.
- Markets & Brands, Real estate agenciesper sector, any area40 credits
- Real Estate, The areaper analysis20 credits
- Maps, tables and exports of the resultsFree
- Total= 60 credits
- ≈ A$92 at the Single report pack rate of A$1.53 a credit; less with larger packs and monthly plans.
The estimate appears before each run starts, and a run that fails costs nothing.
What do people opening an agency ask next?
What is this property worth?
Comparable listings, the local market, services nearby and how fast similar homes sell, as evidence for a value.
Real estate location analysisWho lives in the area I would cover?
Age, households, income and how many rent, read against the council, the state and Australia.
Demographic analysisHow do I split the area between agents?
Territories balanced on residents, clients or prospects, each in one piece.
Sales territory mapping
What else do people ask about agency locations?
How many real estate agencies are there per resident in Australia?
14,732 real estate agency locations for 27,613,654 residents, or 5.34 per 10,000. Property management offices are a separate sector, and many agencies appear in both.
Are the prices in K-Stra sale prices?
No. They are asking prices and asking rents from listings on property portals, collected since July 2026 and updated every month, with medians per postcode. Recorded sale prices come from state land registries, which K-Stra does not use.
Can K-Stra tell me which agency lists the most properties?
No. K-Stra counts listings by postcode and type, not by agency, and the agency table shows location, rating and reviews. The number of reviews is the clearest public sign of how active an office is.
What does “sold” mean in the Real Estate results?
A listing for sale that left the portal with a sold status in the period. In the Ipswich example 162 of the 276 sale listings that left the market were sold, and 171 of 636 cut their price, by a median 4.9%.
Can I value a single property?
Yes, with One property in the Real Estate module: comparable listings, the local market, services nearby and how fast similar homes sell, for 20 credits. See real estate location analysis.
See the listings and
the agencies around you.
Type an address, run the agency sector and the property market, and read both on one map.
Open the app — free to exploreExploring the map is free; you pay only for the analyses you run