
Is there a database of Australian businesses by sector and location?
Who sells what, where, and how much room is left. This is the data behind every sector, brand and site comparison in K-Stra.
K-Stra holds a database of 2M+ Australian businesses from public online business listings, refreshed every month and sorted into 78 sectors. A sector model joins them with ABS population and spending to measure demand, competition, opportunity and market gap, and existing chain stores carry estimated annual sales as a band, built from chain accounts and ABS retail totals.
Which market variables are there?
Twelve variables from Markets & Brands: a whole sector costs 40 credits on any area, a brand 5, a candidate site 20, and estimated sales are free for now.
| Variable | Source | Reference period | Measured at |
|---|---|---|---|
| Businesses and stores: name, brand, category, address, rating and number of reviewsWhole sector · Specific brands | Business listings | Catalogue of 23 October 2026 | Point, attached to the nearest address |
| 78 sectors in 15 groupsWhole sector | K-Stra model | Classification of October 2026 | — |
| Demand: the yearly spending of the sector within reach of each pointWhole sector | ABS National Accounts · ABS population estimates · K-Stra model | 2024–25 spending, 2025 residents | SA1 cell |
| Competition: an index of the pull of existing stores, never a shareWhole sector | Business listings · K-Stra model | Catalogue of 23 October 2026 | Address |
| Opportunity: spending a new opening could take against the stores already thereWhole sector | K-Stra model | Model of 23 October 2026 | SA1 cell |
| Market gap: spending within reach per unit of competition, 100 for the typical spotWhole sector | K-Stra model | Model of 23 October 2026 | SA1 cell |
| Five best locations at least 500 m apart, by opportunity and by market gapWhole sector | K-Stra model | Model of 23 October 2026 | Address |
| Stores per 10,000 residents in the area, council, state and Australia; per km²Whole sector · Specific brands | Business listings · ABS population estimates | Catalogue 2026, residents 2025 | Area |
| Commercial properties for lease or sale near the best locations, seen in the last 60 daysWhole sector | Property listings | Last 60 days | Listing |
| Businesses of chosen categories, or of a sector’s neighbouring categories, per 10,000 residentsCategory mix | Business listings · ABS population estimates | Catalogue 2026, residents 2025 | Area |
| Estimated annual sales of existing stores, as a band with its confidenceWhole sector · Specific brands · Coverage | K-Stra model · ABS Retail Trade · ABS Counts of Businesses | ABS totals 2024–25; chain accounts 2025–26 | Store; every retail store the model can estimate, with its confidence; never services |
| Residents and spending reached by each store or candidate site, overlap, and spending captured from whomCoverage · Compare sites | K-Stra model · ABS population estimates · ABS National Accounts | Model of 23 October 2026 | Address |
What do demand, competition, opportunity and market gap measure?
Demand
The yearly spending of the sector that residents can bring to each point within a short drive. A figure of the area: it is not added up across points.
Competition
How strongly existing stores pull each point, from their number, distance and weight. An index from 0, never a market share.
Opportunity
How much of that spending a new opening at a point could take against the stores already there.
Market gap
Spending within reach for each unit of competition. 100 is the typical spot of the analysis; above 200 there is a market and few competitors.
Demand comes from ABS household spending for 2024–25 and population at 30 June 2025; competition from the stores of the sector in the business catalogue. The model was last recalculated on 23 October 2026, with the monthly update of the catalogue.
What does the market gap look like on a map?
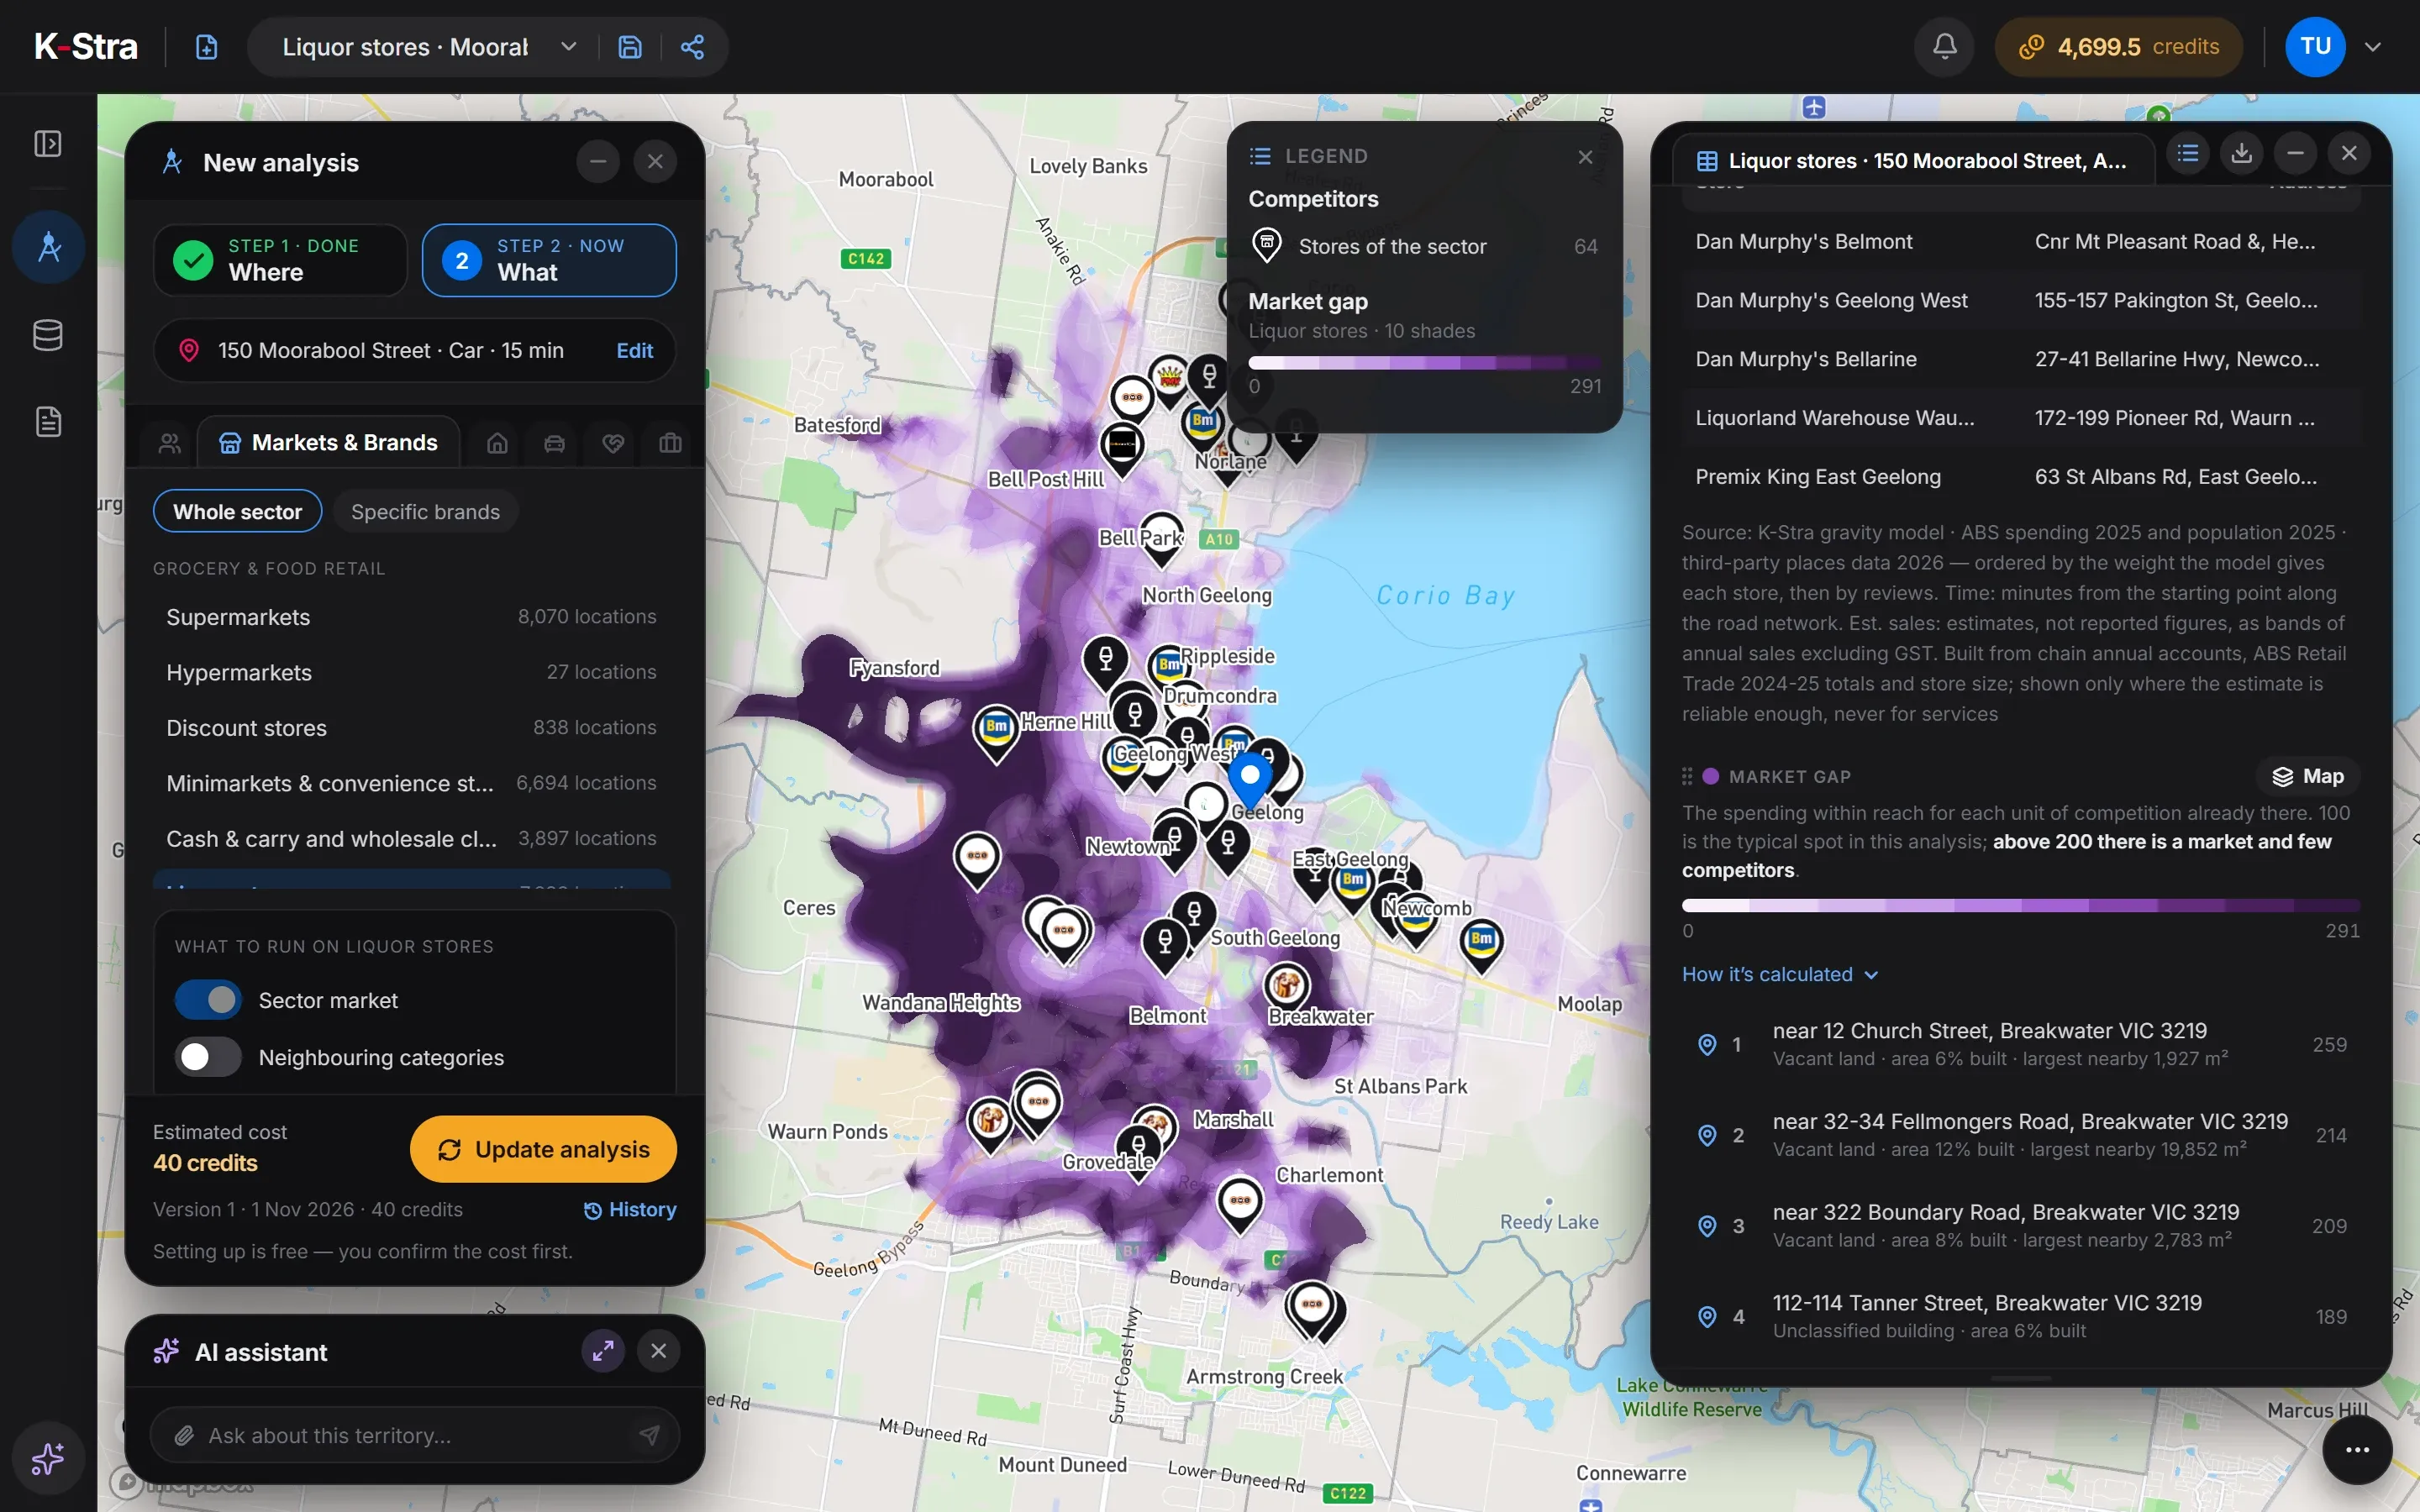 Geelong, VIC
Around Moorabool Street, 64 liquor stores share 160,556 residents. The market gap is highest near 12 Church Street, Breakwater, at 259: more than twice the spending per unit of competition of a typical spot in the area.
Of the 64 stores, 19 carry estimated annual sales: 3 in the A$10–20M band and 16 in the A$2–5M band. These are estimates, not reported figures, and the other 45, mostly independents, show none.
Source: K-Stra sector analysis of 1 November 2026, liquor stores within 15 minutes by car of Moorabool Street, Geelong; business catalogue of October 2026; ABS residents at 30 June 2025.
When are the market sources updated?
| Source | Edition in K-Stra | Published | Next update of the source |
|---|---|---|---|
| ABS Australian System of National Accounts (5204.0), household consumption | 2024–25 financial year | 24 October 2025 | Newer edition outThe 2025–26 edition came out on 23 October 2026 and is not loaded yet |
| ABS Retail Trade, Australia | 2024–25 financial year | 31 July 2025 | Discontinued by the ABS after June 2025 |
| ABS Counts of Australian Businesses | July 2021 – June 2025 | 16 December 2025 | Newer edition outThe edition to June 2026 came out on 18 August 2026 and is not loaded yet; next ABS release 18 December 2026 |
| Public online business listings (third-party places data) | Catalogue of 23 October 2026 | 23 October 2026 | Every month |
| K-Stra models (sector model, estimated sales, spreading onto addresses) | Sector model recalculated on 23 October 2026 | 23 October 2026 | With each monthly update |
What else do people ask about business data?
Can I get a list of the businesses in an area?
Yes. A Markets & Brands analysis finds the businesses of a sector or a brand in any area, with name, brand, category, address, rating and number of reviews, and its tables export to Excel or CSV for free. A whole sector costs 40 credits on any area, a brand 5.
Is it the same as the Australian Business Register?
No. ABN Lookup lists registered businesses, including many with no shop or office. K-Stra’s catalogue lists the places where a business operates, from public online business listings, so it shows what is on the street, where it is and in which sector.
How often is the business catalogue updated?
Every month. Each update adds new businesses, marks the ones that have closed and refreshes ratings and reviews. Closed businesses no longer appear in new analyses; saved analyses keep the stores of their run.
Which stores have estimated annual sales?
Existing retail stores in the groups that pass the model’s checks, each with its confidence: high or medium for chain stores with published accounts and stores whose size has been measured, low for independents estimated from the typical size of their type of store, from reviews or from ABS counts of businesses by turnover band. Services never have one, and neither does a store that is not open yet. In the Geelong example, run on 1 November 2026, when only high and medium estimates were shown, 19 of 64 liquor stores showed a band.
Why do the sales estimates use ABS figures from 2024–25?
Because the ABS Retail Trade series, which gives the total sales of each retail group, ended in 2025 with the 2024–25 year. The estimates stay anchored to it, and to the accounts that chains publish each year.
Is a high opportunity a forecast of what a new store would sell?
No. It is a modelled share of what the catchment’s residents spend, useful to compare sites of the same sector in the same area. Workers, tourists and passing trade are not in it, so city centres and stations come out lower than they are.
Pick a sector,
see where the gaps are.
Run a whole sector on any area and read demand, competition and market gap on one map.
Open the app — free to exploreEstimated sales are free for now