
How do you make a thematic map in K-Stra?
The same figures can tell two different stories on a map. Choosing how to colour them is part of the analysis.
A thematic map in K-Stra colours your own areas, points or lines by a value or a category. You pick a dataset from My Data, a style such as a choropleth, graduated sizes or a heatmap, a classification method and 3 to 9 classes. Every change is a live preview and never spends credits.
What can you colour on a K-Stra map?
Anything in My Data: the areas, points and lines you import or copy from the K-Stra territory. The style depends on the shape of the data.
| Data | Styles | Typical use |
|---|---|---|
| Areas | Single colour, choropleth by a number, colours by category | Postcodes coloured by your sales, SA2 areas by a score |
| Points | Single colour, graduated size, colours by category, heatmap | Stores sized by turnover, customers as a heatmap |
| Lines | Single colour, graduated colour, colours by category | Delivery routes coloured by volume |
A choropleth or a graduated style takes 3 to 9 classes and a palette: sequential for more and less, neutral, or diverging for above and below a middle value. Each class colour can be changed by clicking it, and the palette can be inverted.
By category gives a colour to the six most frequent values, such as brand or store format, and groups the rest as Other. Points can be dots, pins, squares or diamonds; opacity and borders apply to every style.
Does the classification method change the map?
Yes, and sometimes more than the data. Here are the 28 SA2 areas of the City of Sunshine Coast, ranked for a pharmacy: more residents aged 65 and over is better, more pharmacies per resident is worse. The scores are the same in both maps; only the method changes.
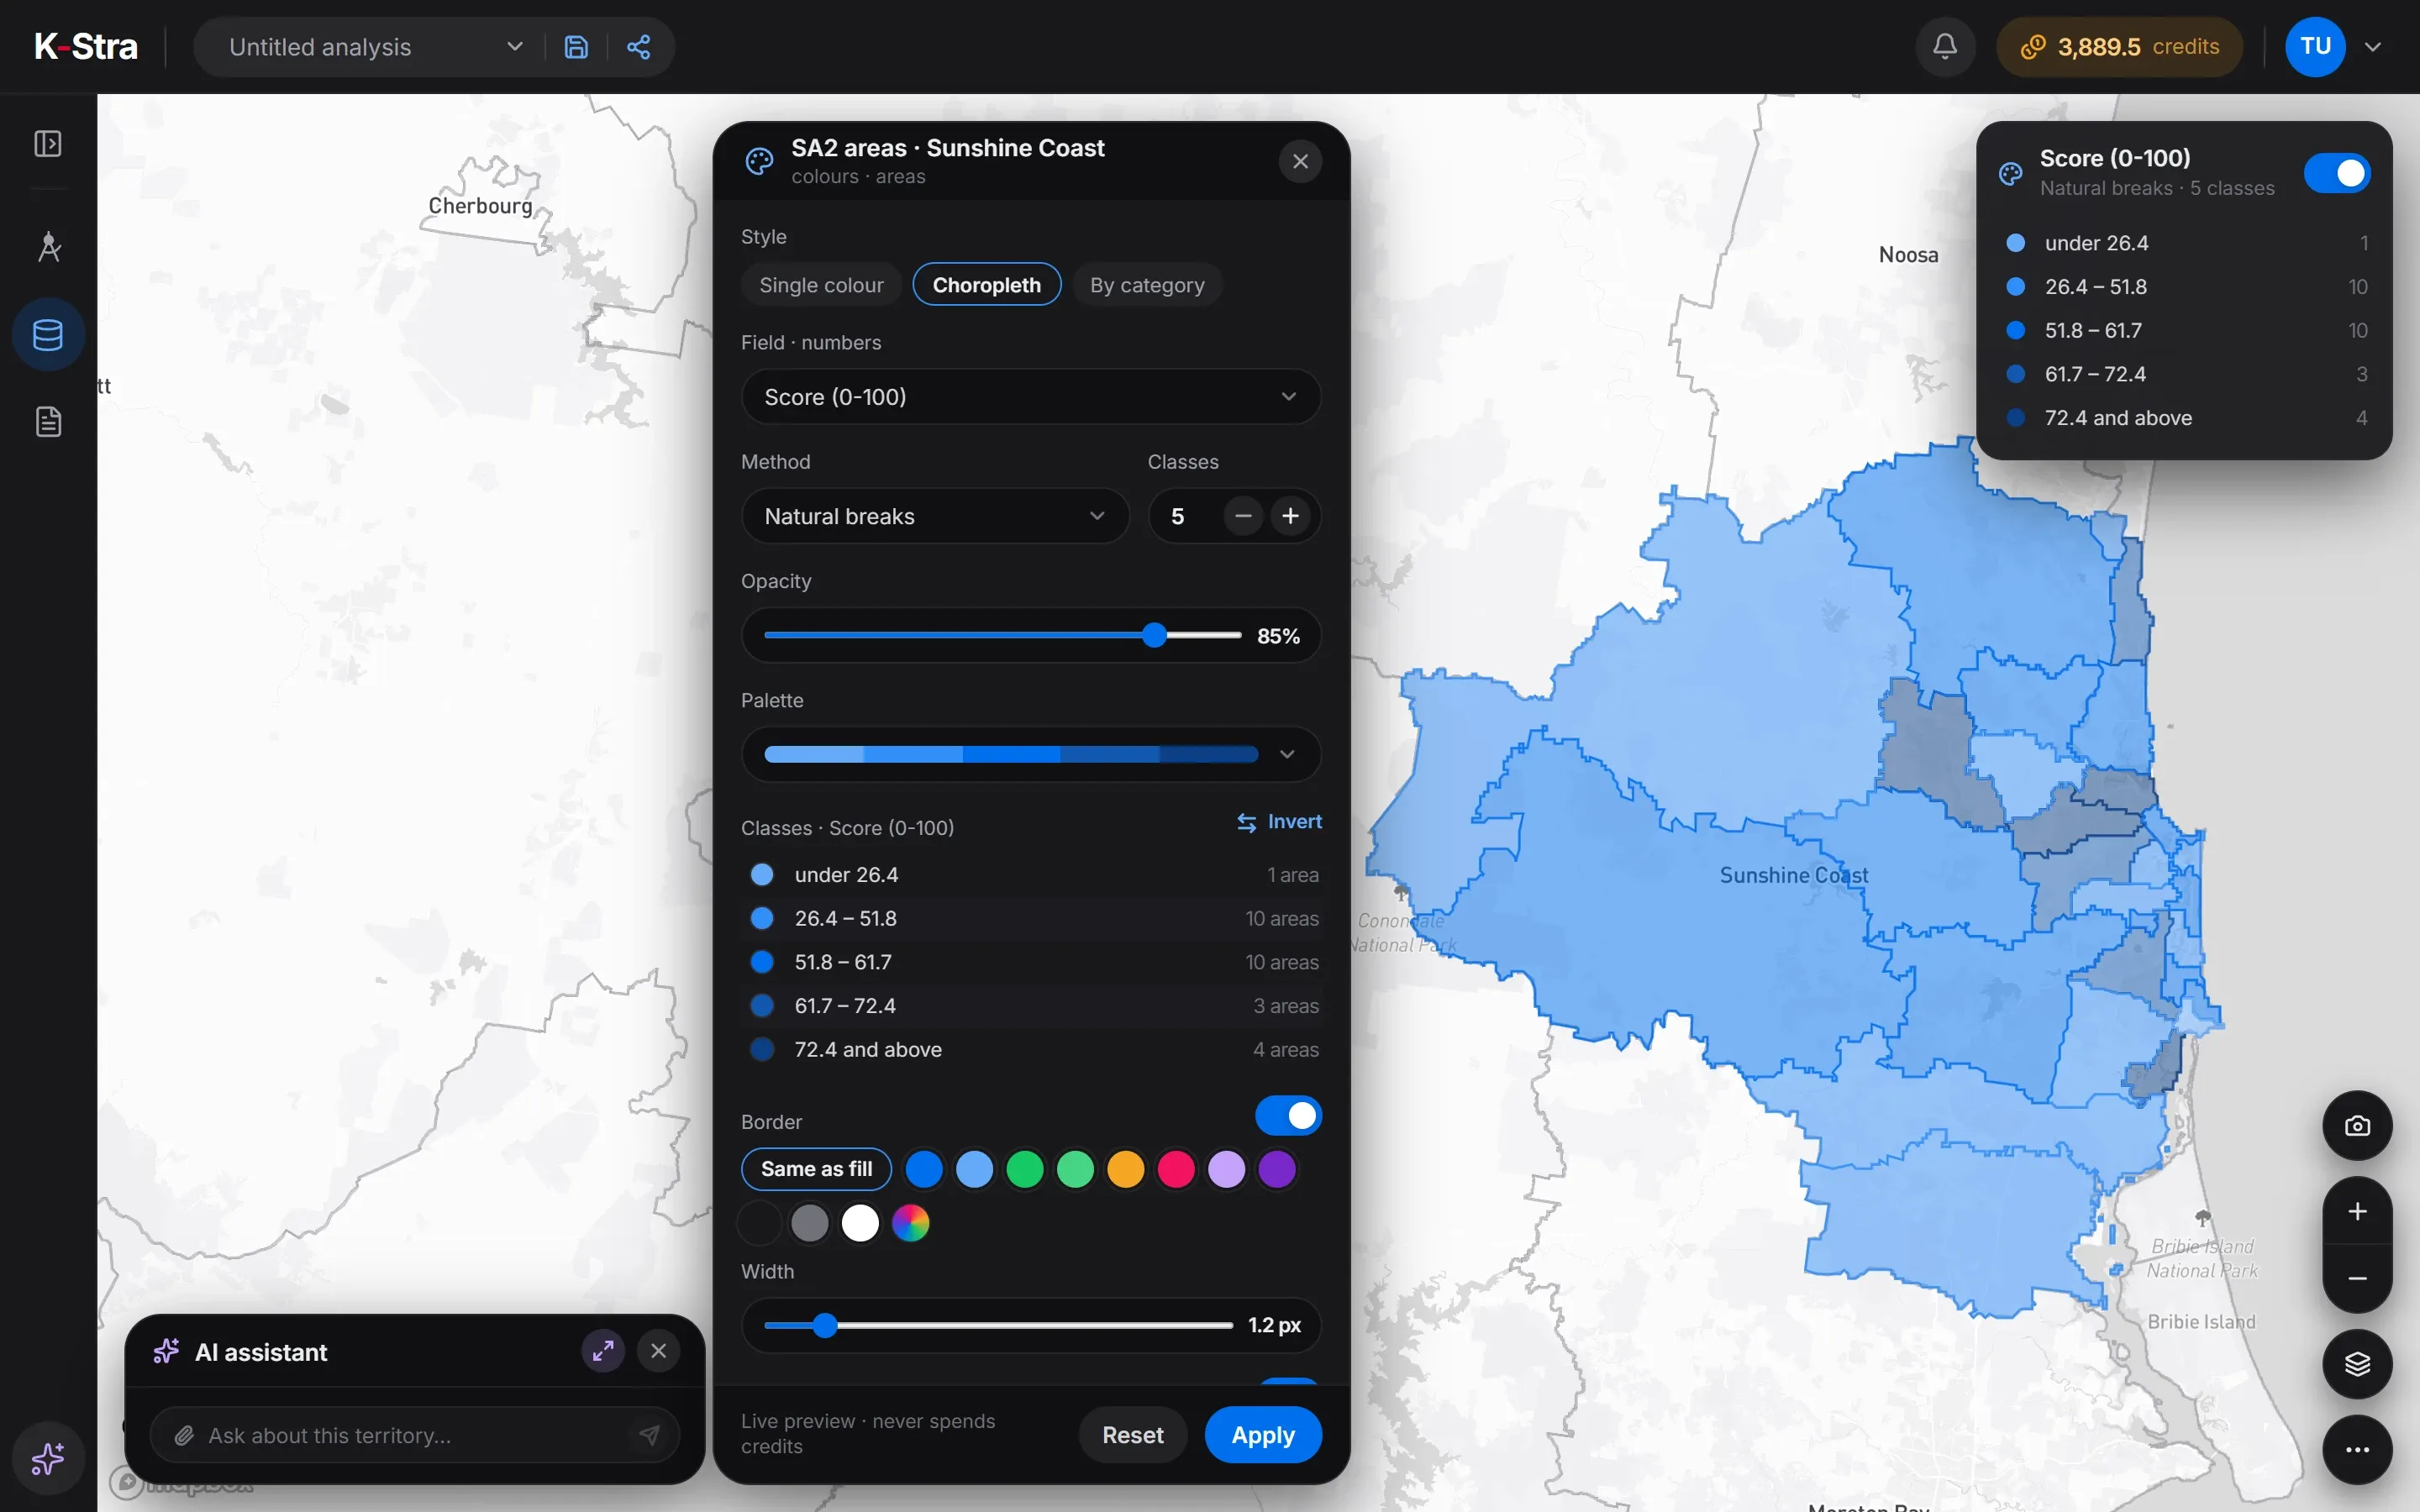 Natural breaks
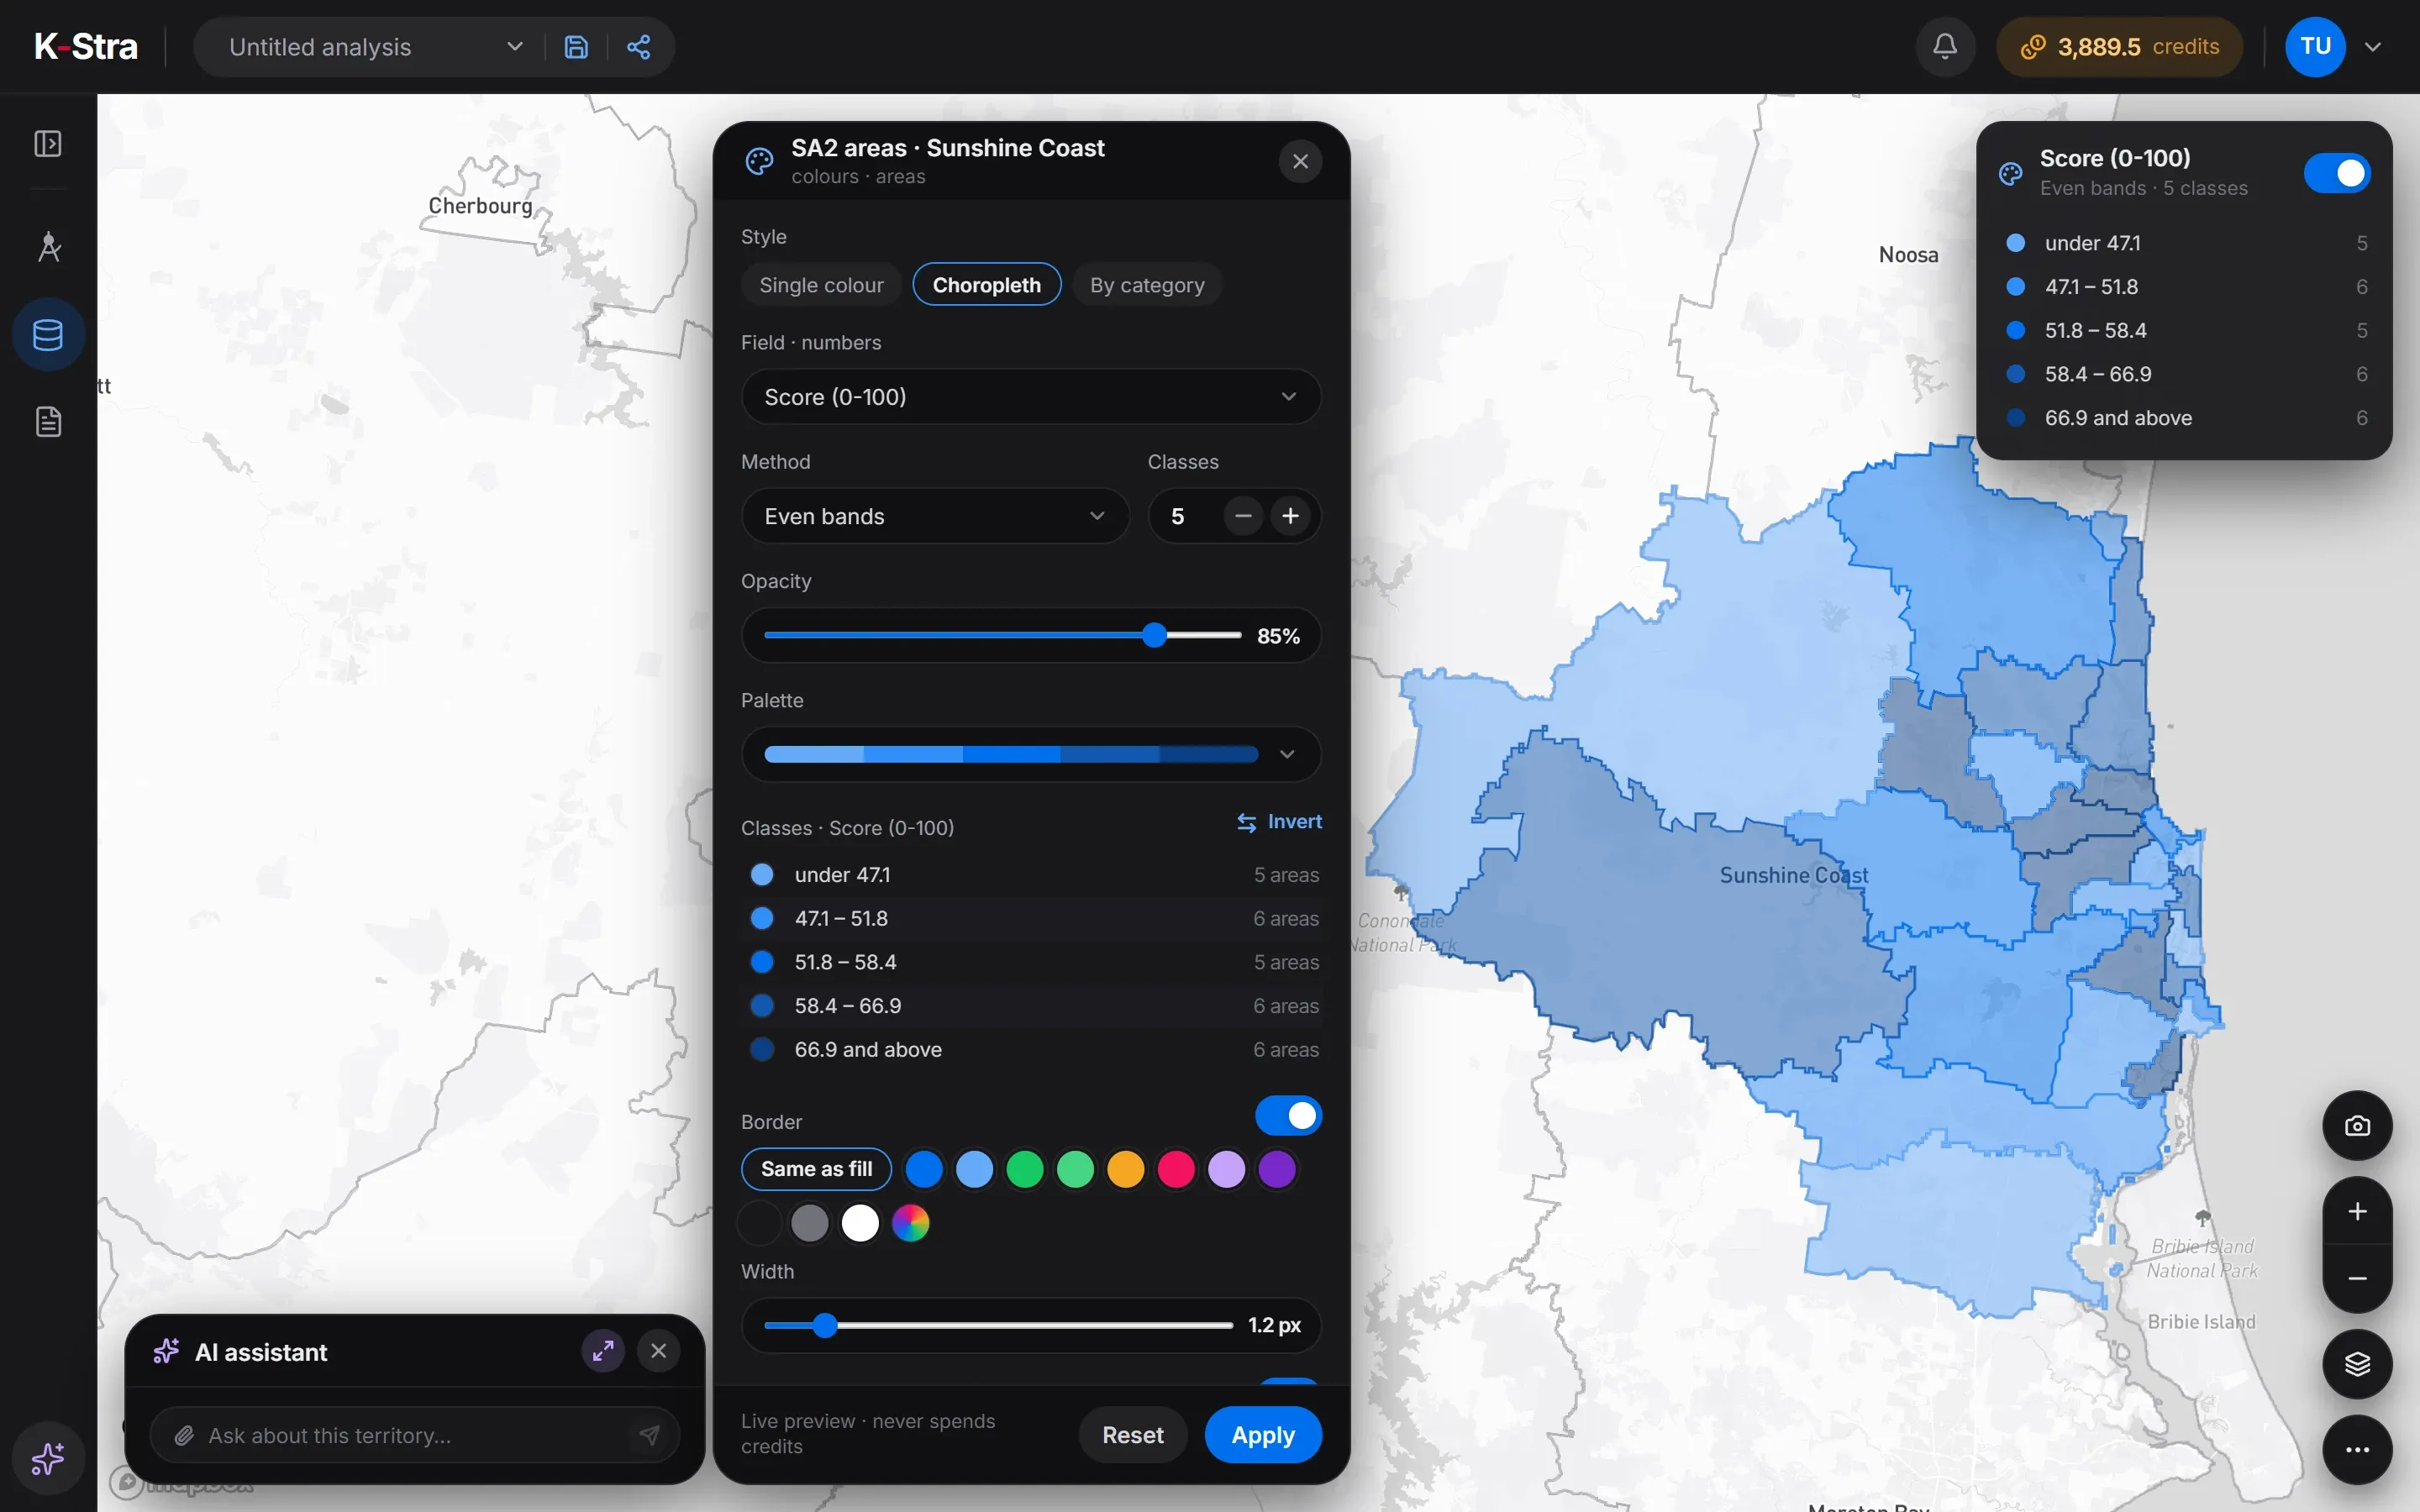 Even bands
| Class | Natural breaks | Areas | Even bands | Areas |
|---|---|---|---|---|
| 1 | under 26.4 | 1 | under 47.1 | 5 |
| 2 | 26.4–51.8 | 10 | 47.1–51.8 | 6 |
| 3 | 51.8–61.7 | 10 | 51.8–58.4 | 5 |
| 4 | 61.7–72.4 | 3 | 58.4–66.9 | 6 |
| 5 | 72.4 and above | 4 | 66.9 and above | 6 |
K-Stra dataset of 1 November 2026: SA2 areas inside the City of Sunshine Coast with residents and residents aged 65 and over from the ABS Census 2021, and pharmacies counted in each area from public online business listings in K-Stra’s catalogue, November 2026. Score from 0 to 100 within these 28 areas.
On-screen text
Maps & Thematics · Map colours. Same data, two stories. 28 SA2 areas of the Sunshine Coast, each with a score from 0 to 100. Your own areas, on the map. Natural breaks: 1, 10, 10, 3 and 4 areas. Even bands: 5, 6, 5, 6 and 6 areas. From 5 to 7 classes. Invert the palette. The legend, on the map. Live preview · never spends credits. Your data, your colours. Sample dataset: 28 SA2 areas of the Sunshine Coast with a score from 0 to 100.
Which classification method should I use?
There is no neutral choice: every method answers a slightly different question. These are the four in K-Stra, and when each one fits.
Natural breaks
You want to see groups and outliers.
Breaks fall where the values jump, so similar areas share a colour and an exceptional one stands alone.
Even bands
You want to rank areas.
Each class holds about the same number of areas, so the map reads as top fifth, second fifth and so on. Small differences can end up in different colours.
Equal intervals
The scale itself matters.
Every class covers the same span of values, such as 0–20, 20–40. Skewed data leaves some classes almost empty.
Manual breaks
You already have thresholds.
You type the limits yourself, for example a sales target or a minimum population, and the map shows who is above and below.
A common mistake is to pick the method that makes the map look most dramatic. Try two methods on the same field before you present it: if the story changes, say which one you used and why.
How do you rank areas by more than one figure?
When you import administrative areas, the Rank the areas step gives each criterion a weight from −3 to +3. K-Stra turns them into a Score from 0 to 100 and a Rank, measured within the areas you import, and opens the map coloured by score.
The Sunshine Coast map above weighs residents aged 65 and over at +1 and pharmacies per 10,000 residents at −1. A plus rewards high values, a minus rewards low ones; competitors of any of the sectors in K-Stra can be counted in each area.
Caloundra - Kings Beach scores lowest, 13.6: 2,411 older residents but 10 pharmacies, 14.37 per 10,000 people. Diddillibah - Rosemount has no pharmacy at all, yet scores 50 because only 1,013 residents are 65 or older.
A score compares the areas of one import with each other: the same area can score differently in a larger set. Census 2021 residents and November 2026 store counts are of different years, as the column names say.
| SA2 area | Aged 65+ | Pharmacies | Per 10,000 | Score |
|---|---|---|---|---|
| Buderim - North | 5,251 | 6 | 3.34 | 79.6 |
| Golden Beach - Pelican Waters | 4,534 | 2 | 1.53 | 78.9 |
| Maroochydore - Kuluin | 6,155 | 15 | 6.44 | 77.6 |
| All 28 areas | 73,285 | 97 | 2.9 | – |
What else can the K-Stra map show?
Five base maps
Light, Streets, Outdoors & terrain, Satellite and Dark. The last one you chose is remembered in your browser.
Buildings in 3D
At street zoom the map tilts and shows buildings in 3D, useful for reading a shopping strip or a town centre.
A legend you can move
Show the legend on the map and drag it where it does not cover anything. Each class shows how many areas or points it holds.
Travel-time bands
Up to six bands around an address, each with its own fill, border and opacity. Hover a band to read its residents once they are counted.
What the map does not do
- No terrain or elevation model: Outdoors & terrain is a map style, and only buildings are shown in 3D.
- No values written on the areas: the labels are place names, and the figures are in the table and the legend.
- No measuring tool for distances on the map; travel bands measure along the roads instead.
- It is built for desktop screens of 1,280 pixels or more, like the rest of K-Stra.
What does a thematic map cost?
Colouring, classes, palettes, legends and base maps are free, and so is the map image. You pay to bring data in: 1 credit per 10,000 rows of a file, or administrative areas with K-Stra figures at 1 credit per 1,000 values.
The 28 Sunshine Coast areas with five columns and the score cost 2 credits, shown before the import and charged when it finished. A new account starts with 40 free credits.
Questions about maps
Does changing the colours of a map cost credits?
No. Style, method, classes, palette, opacity and legend are a live preview on data you already have, and nothing runs again. Credits are spent only to import data or to run an analysis.
Can I colour council or postcode areas by census figures?
Yes, by importing the areas into My Data with the figures you need: residents, age, education, work, income and consumption indices, dwellings. The areas cost like the rows of a file and the figures 1 credit per 1,000 values, so the 28 areas of this page with five columns cost 2 credits.
Can I colour the results of an analysis?
The results have colours of their own: the sector map shades demand, competition, opportunity and market gap, with a style menu for palette and bands, and Real Estate, Customer Loyalty and Sales colour their areas. The Map colours panel described here works on the datasets in My Data.
Can I print or present a thematic map?
Yes. The camera button saves the map as an image with its title, legend and source note, free of charge, and a saved analysis can keep views for reports exported to PDF or PowerPoint.
Which areas can I import and colour?
All nine administrative levels, from the whole country down to SA1, the finest grid of about 62,000 areas, optionally only inside a state, a council or a postcode. Your own boundaries come in as KML, KMZ or GeoJSON files.
Your figures,
on the map.
Import your areas or points, colour them by any column and try two methods before you decide. Colouring never spends credits.
Open the app — free to explore40 credits when you sign up · no card required