
How is Australia’s population spread across its states and territories?
Eight states and territories, eight different markets. The figures behind each one, from the same sources and the same year, so they can be compared.
Australia had 27,613,654 residents at 30 June 2025, growing 9.0% from 2019 to 2025, on average 1.50% a year. 64.6% live in the five largest capital cities. Western Australia grew fastest and Tasmania slowest; spending per resident ranges from A$47,793 a year in Tasmania to A$66,481 in the ACT.
How do the states and territories compare?
| State or territory | Residents 2025 | Average change a year, 2019–25 | In the capital | Median age | Income index | Spending per resident |
|---|---|---|---|---|---|---|
| New South Wales | 8,592,524 | 1.13% | 65.6% | 38.6 | 101.0 | A$53,068 |
| Victoria | 7,073,859 | 1.37% | 76.8% | 38.0 | 98.8 | A$52,000 |
| Queensland | 5,669,764 | 1.90% | 50.0% | 38.6 | 96.6 | A$50,902 |
| Western Australia | 3,044,382 | 2.41% | 80.6% | 37.9 | 106.4 | A$55,725 |
| South Australia | 1,902,665 | 1.28% | 78.3% | 40.6 | 94.8 | A$50,035 |
| Tasmania | 576,261 | 0.86% | 44.3% | 42.7 | 90.3 | A$47,793 |
| Australian Capital Territory | 484,630 | 1.87% | 100.0% | 35.8 | 128.1 | A$66,481 |
| Northern Territory | 264,556 | 1.22% | 60.0% | 33.9 | 106.0 | A$55,549 |
| Australia | 27,613,654 | 1.50% | 67.9% | 38.5 | 100.0 | A$52,582 |
Sources: ABS Estimated Resident Population at 30 June 2025, by council (2025 boundaries); ABS Estimated Resident Population by council, 2019 to 2025; average yearly change as in the K-Stra area dashboard; Greater Capital City Statistical Areas (ABS ASGS Edition 3), residents counted by K-Stra on the address points inside them; ABS population by five-year age group at 30 June 2025; median age worked out from the age groups; Income index from ABS Personal Income 2022–23 (tax data), measured or estimated; consumption index derived from it; 100 = Australia; Spending per resident from the consumption index and ABS national accounts (5204.0) for 2024–25. Other Territories (Jervis Bay, Christmas and Cocos Islands, Norfolk Island) are included in the Australian total only.
What sets each state and territory apart?
- NSW · 8,592,524 residents
New South Wales
Greater Sydney holds 65.6% of residents; growth is fastest on its south-western edge.
See the figures - VIC · 7,073,859 residents
Victoria
Three in four Victorians live in Greater Melbourne; Melton grew 6.65% a year on average.
See the figures - QLD · 5,669,764 residents
Queensland
Half of Queenslanders live outside Brisbane; the state added more residents than New South Wales since 2019.
See the figures - WA · 3,044,382 residents
Western Australia
The fastest growth of any state, on average 2.41% a year; four in five residents in Perth.
See the figures - SA · 1,902,665 residents
South Australia
One resident in five is 65 or over; Greater Adelaide holds 78.3% of the state.
See the figures - TAS · 576,261 residents
Tasmania
The oldest state, median age 42.7; twice the national count of accommodation per resident.
See the figures - ACT · 484,630 residents
Australian Capital Territory
The highest income index in Australia, 128.1; Canberra measured by district.
See the figures - NT · 264,556 residents
Northern Territory
The youngest population, median age 33.9; 60.0% in Greater Darwin.
See the figures
How many people live within 45 minutes of each city centre?
| City | Residents 2025 | Within 45 min of the centre | Median age | Income index | Spending per resident |
|---|---|---|---|---|---|
| Greater Sydney | 5,638,736 | 4,435,276 | 37.0 | 106.5 | A$55,818 |
| Greater Melbourne | 5,431,267 | 4,762,581 | 36.8 | 102.1 | A$53,629 |
| Greater Brisbane | 2,832,646 | 2,591,207 | 36.5 | 102.4 | A$53,791 |
| Greater Perth | 2,452,786 | 2,188,565 | 37.4 | 107.6 | A$56,330 |
| Greater Adelaide | 1,490,470 | 1,449,379 | 39.3 | 97.6 | A$51,395 |
| Gold Coast | 708,530 | 800,440 | 39.4 | 91.1 | A$48,181 |
The five capitals as ABS Greater Capital City areas, the Gold Coast as its ABS region. Drive time by car in average traffic from a central address, in K-Stra analyses of 2 November 2026; residents from ABS estimates at 30 June 2025.
Where has Australia’s population grown since 2019?
Between 2019 and 2025 Australia added 2,278,828 residents. Queensland added the most, 580,917, although New South Wales is larger; Western Australia grew fastest as a share of its population, 14.5% in all, on average 2.41% a year.
Growth is not spread like population. It concentrates on the edges of the large cities — Camden in Sydney, Melton and Wyndham in Melbourne, Ipswich and Logan near Brisbane, Kwinana and Serpentine-Jarrahdale south of Perth — while many established inner councils grow slowly or shrink.
The age of the population follows the same map. The Northern Territory has the youngest residents, with a median age of 33.9; Tasmania the oldest, 42.7. That difference shapes demand as much as income does: childcare and fitness in one, health and aged care in the other.
| State or territory | Residents 2019 | Added by 2025 |
|---|---|---|
| Queensland | 5,088,847 | 580,917 |
| New South Wales | 8,046,748 | 545,776 |
| Victoria | 6,537,305 | 536,554 |
| Western Australia | 2,659,625 | 384,757 |
| South Australia | 1,767,395 | 135,270 |
| Australian Capital Territory | 435,730 | 48,900 |
| Tasmania | 547,841 | 28,420 |
| Northern Territory | 246,559 | 17,997 |
How should you read Australian population and income figures?
Population comes in two forms. The Census counts everyone on one night every five years, most recently August 2021; the Estimated Resident Population updates the count every year. These pages use the 2025 estimate for residents and age, and the 2021 Census for families and housing, which change more slowly.
Areas nest at nine levels, from the whole country down to blocks of a few hundred people, and councils and postcodes do not line up with the statistical areas. The capital city figures here use the ABS definition, which follows labour markets rather than council borders: the guide to Australian geography levels explains how they fit.
Income and spending are indices, with 100 as the Australian average. Income comes from ABS tax statistics for 2022–23; spending per resident is the national figure for 2024–25 scaled by each area’s consumption index, as explained in the guide to income and consumption indices.
A state is too large to decide where to open. These pages say which parts of each state are growing, earning and ageing; the decision itself needs the catchment of an address, with the residents and competitors within a drive or a walk of it.
What can you see about Australia without an account?
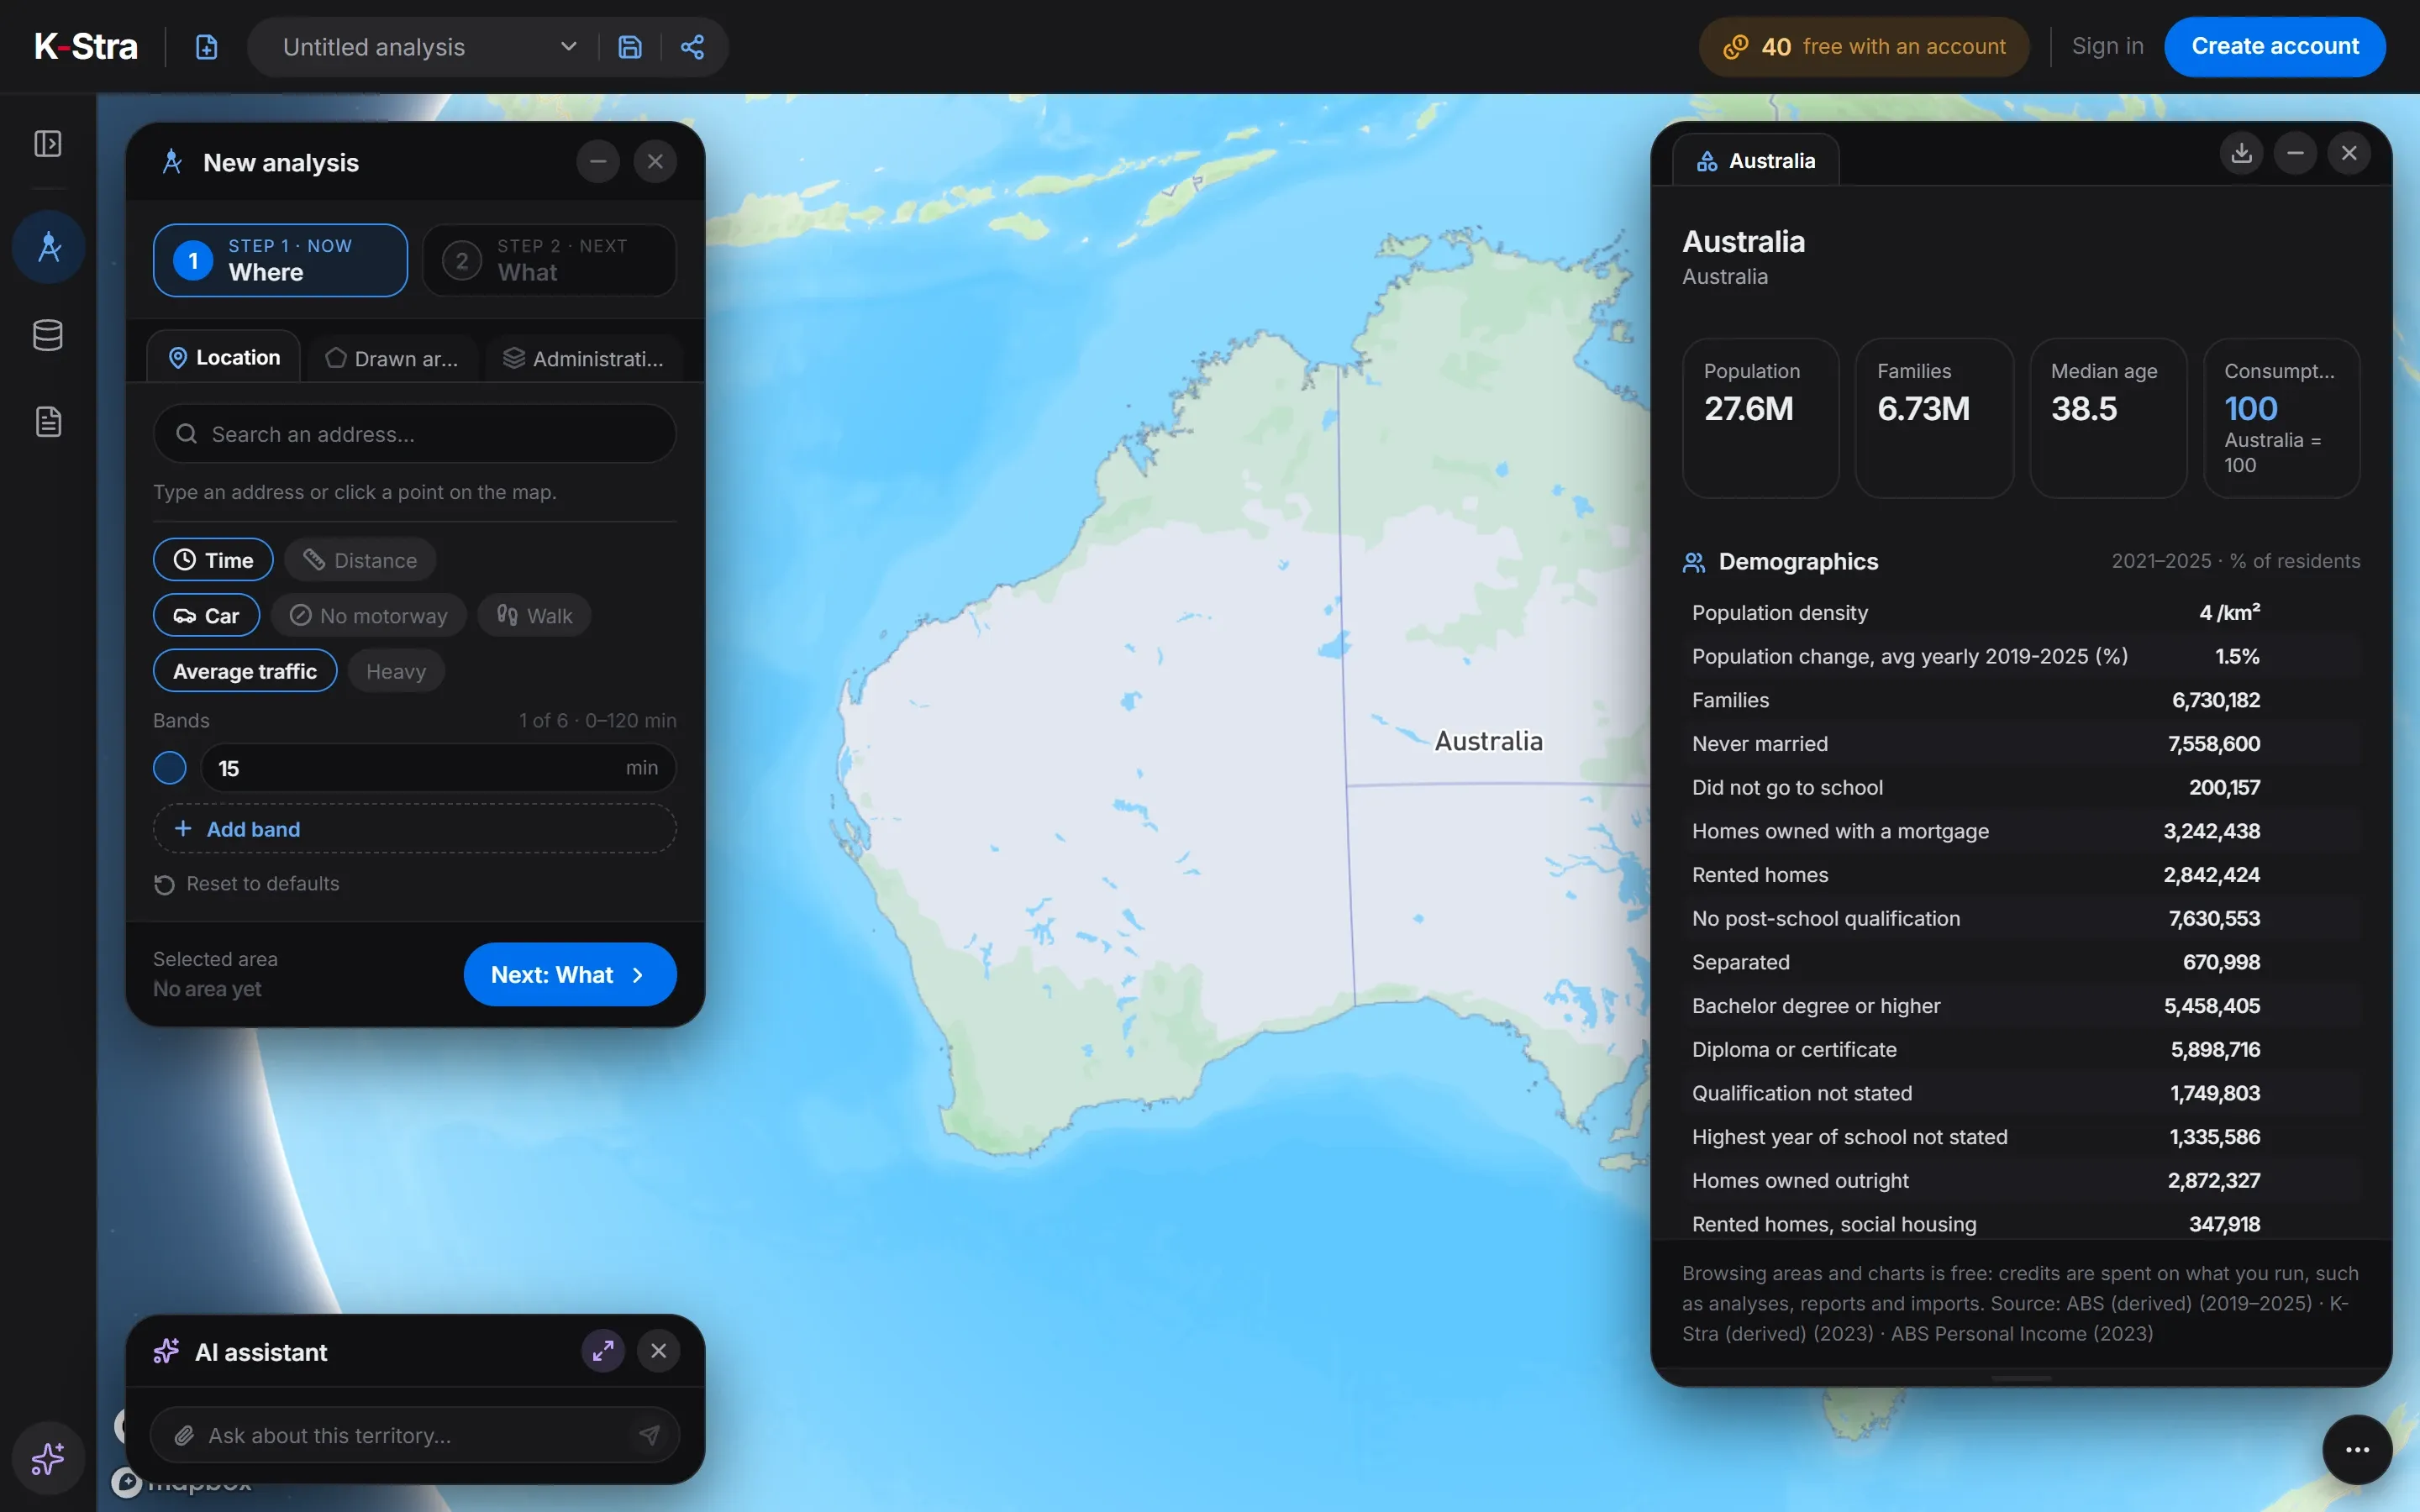 No account needed
Every figure on these pages can be checked in the app. With the map zoomed out, a click on “Australia” opens the national dashboard; zoom in one step and the states appear, then councils, postcodes and suburbs.
Browsing areas is free and needs no account. A free account adds 40 credits for the first analyses of your own catchments.
What else do people ask about Australia’s states?
What is the population of Australia?
27,613,654 at 30 June 2025, according to the ABS Estimated Resident Population, up from 25,334,826 in 2019. The ABS publishes this estimate every year; results from the Census held in August 2026 will be used to revise it from 2027.
Which Australian state is growing fastest?
Western Australia, up 14.5% from 2019 to 2025, on average 2.41% a year. In absolute numbers Queensland added the most residents, 580,917, ahead of New South Wales with 545,776.
Which state or territory has the highest income?
The Australian Capital Territory, with an income index of 128.1 where 100 is the Australian average. Tasmania has the lowest, 90.3. The index compares income per resident from ABS tax statistics for 2022–23.
What share of Australians live in a capital city?
67.9% of residents live in the eight capital city areas, and 64.6% in the five largest. The share ranges from 44.3% in Tasmania to 80.6% in Western Australia.
Start from the map
of Australia.
Open the app on the whole country, click a state or a council for its dashboard, then draw the catchment of an address.
Open the app — free to exploreBrowsing areas and dashboards is free