
How many people live in South Australia, and how old are they?
An older, slower-growing state with a compact capital: in South Australia the market is defined less by new residents than by who already lives there.
South Australia had 1,902,665 residents at 30 June 2025, 78.3% of them in Greater Adelaide. It is older than the mainland average, with a median age of 40.6 and 20.5% of residents aged 65 or over. The population grew 7.7% from 2019 to 2025, on average 1.28% a year, and residents spend about A$50,035 each a year.
What are the key figures for South Australia?
| Indicator | South Australia | Australia |
|---|---|---|
| Residents, 30 June 2025 | 1,902,665 | 27,613,654 |
| Average yearly change, 2019–2025 | 1.28% | 1.50% |
| Residents added since 2019 | 135,270 | 2,278,828 |
| Area | 984,231 km² | 7,688,095 km² |
| Residents per km² | 1.9 | 3.6 |
| Share in Greater Adelaide | 78.3% | — |
| Median age | 40.6 | 38.5 |
| Aged under 15 | 16.3% | 17.4% |
| Aged 65 and over | 20.5% | 17.5% |
| Income index | 94.8 | 100.0 |
| Consumption index | 95.2 | 100.0 |
| Spending per resident, a year | A$50,035 | A$52,582 |
| Resident spending, a year | A$95.2 billion | A$1,452.0 billion |
| Families (Census 2021) | 479,787 | 6,730,182 |
| Homes rented (Census 2021) | 31.8% | 33.6% |
| Flats and apartments (Census 2021) | 8.1% | 19.6% |
- Residents: ABS Estimated Resident Population at 30 June 2025, by council (2025 boundaries). Change: ABS Estimated Resident Population by council, 2019 to 2025; average yearly change as in the K-Stra area dashboard.
- Age: ABS population by five-year age group at 30 June 2025; median age worked out from the age groups. Capital: Greater Capital City Statistical Areas (ABS ASGS Edition 3), residents counted by K-Stra on the address points inside them.
- Indices: Income index from ABS Personal Income 2022–23 (tax data), measured or estimated; consumption index derived from it; 100 = Australia. Spending: Spending per resident from the consumption index and ABS national accounts (5204.0) for 2024–25. Housing and families: ABS Census 2021 (families, rented homes, flats and apartments).
Where do people live in South Australia?
Greater Adelaide counts 1,490,470 residents. Its northern half is the larger and younger: the Adelaide – North region has 492,309 residents and a median age of 37.0, against 41.3 in the south. Onkaparinga, in the south, is still the largest council, with 184,827.
Outside Adelaide, the South East around Mount Gambier has 205,086 residents and Barossa – Yorke – Mid North 121,193, both with a median age above 48. The outback region, with 85,916, includes Whyalla and Port Augusta.
| Area (capital city, then SA4 regions) | Residents 2025 | Share | Median age | Income index |
|---|---|---|---|---|
| Greater Adelaide | 1,490,470 | 78.3% | 39.3 | 97.6 |
| South Australia – South East | 205,086 | 10.8% | 48.5 | 79.2 |
| Barossa – Yorke – Mid North | 121,193 | 6.4% | 48.7 | 85.5 |
| South Australia – Outback | 85,916 | 4.5% | 41.3 | 94.5 |
Residents counted by K-Stra on the address points inside each area; median age from the five-year age groups, income index weighted by residents. The income index comes from ABS personal income tax data for 2022–23, measured for councils and SA2 areas and estimated elsewhere; 100 is the Australian average.
One city has a page of its own, with residents within 15, 30 and 45 minutes of the centre and incomes by postcode: Greater Adelaide.
Which councils in South Australia are growing fastest?
Mount Barker, in the Adelaide Hills, grew 22.4% from 2019 to 2025, on average 3.74% a year and Playford, on the northern fringe, 3.39% a year. Playford is also the youngest large council in the state, with a median age of 33.3, and has an income index of 90.0.
The City of Adelaide grew 3.15% a year and has the youngest residents in the state, with a median age of 31.7, while Whyalla, the steel town on Spencer Gulf, lost residents at −0.27% a year.
| Council | Residents 2019 | Residents 2025 | Change a year | Rank |
|---|---|---|---|---|
| Mount Barker | 36,842 | 45,111 | 3.74% | Fastest |
| Playford | 96,220 | 115,790 | 3.39% | Fastest |
| Adelaide | 25,376 | 30,173 | 3.15% | Fastest |
| Alexandrina | 27,820 | 31,427 | 2.16% | Fastest |
| Gawler | 24,465 | 27,564 | 2.11% | Fastest |
| Whyalla | 22,073 | 21,720 | −0.27% | Slowest |
| Mount Gambier | 27,379 | 28,057 | 0.41% | Slowest |
| Unley | 39,322 | 40,731 | 0.60% | Slowest |
Councils with more than 20,000 residents in 2025. Average yearly change = (residents 2025 ÷ residents 2019 − 1) ÷ 6, on 2025 council boundaries.
How much do residents of South Australia spend, and on what?
With a consumption index of 95.2, South Australians spend A$50,035 each a year, about A$2,547 less than the average. Income varies less here than in the larger states: the richest councils, Unley, Prospect and Burnside, sit between 108.0 and 112.5.
| Category | Per resident, SA | Per resident, Australia | Total, SA (A$ million) |
|---|---|---|---|
| Food and non-alcoholic beverages | A$4,935 | A$5,032 | 9,390 |
| Alcoholic beverages, tobacco and narcotics | A$1,469 | A$1,509 | 2,795 |
| Clothing and footwear | A$1,822 | A$1,869 | 3,467 |
| Housing, water, electricity, gas and other fuels | A$12,285 | A$12,788 | 23,374 |
| Furnishings, household equipment and routine household maintenance | A$2,081 | A$2,243 | 3,959 |
| Health | A$3,614 | A$3,823 | 6,876 |
| Transport | A$5,280 | A$5,558 | 10,046 |
| Information and communication | A$913 | A$956 | 1,737 |
| Recreation, sport and culture | A$5,026 | A$5,380 | 9,563 |
| Education services | A$1,705 | A$1,862 | 3,244 |
| Restaurants and accommodation services | A$4,126 | A$4,447 | 7,850 |
| Insurance and financial services | A$3,933 | A$4,146 | 7,483 |
| Personal care, social protection and miscellaneous goods and services | A$2,846 | A$2,969 | 5,415 |
| All categories | A$50,035 | A$52,582 | 95,200 |
Spending per resident from the consumption index and ABS national accounts (5204.0) for 2024–25. Spending of residents, wherever it happens; visitors are not included.
How many businesses of each kind does South Australia have?
South Australia has more aged care sites per 10,000 residents than any other state, 3.96 against 2.50, and more pharmacies and supermarkets: 3.09 and 3.37 against 2.63 and 2.92. Childcare is below the national figure, at 4.85.
| Sector | Locations in SA | Per 10,000 residents | Australia |
|---|---|---|---|
| Supermarkets | 642 | 3.37 | 2.92 |
| Pharmacies | 588 | 3.09 | 2.63 |
| Gyms & fitness centers | 1,274 | 6.70 | 7.06 |
| Bars & cafés | 2,259 | 11.87 | 12.00 |
| Restaurants | 2,394 | 12.58 | 12.17 |
| Hairdressers | 1,852 | 9.73 | 9.31 |
| Childcare & early learning | 923 | 4.85 | 5.24 |
| Aged care & retirement living | 754 | 3.96 | 2.50 |
| Fuel stations | 1,012 | 5.32 | 3.74 |
| Real estate agencies | 880 | 4.63 | 5.34 |
| Hotels & accommodation | 3,518 | 18.49 | 15.11 |
K-Stra places catalogue, October 2026, as the app classifies each business; residents at 30 June 2025. A higher count per resident can mean smaller outlets, visitors or a crowded market: the catchment of each site tells which.
What can you see about South Australia without an account?
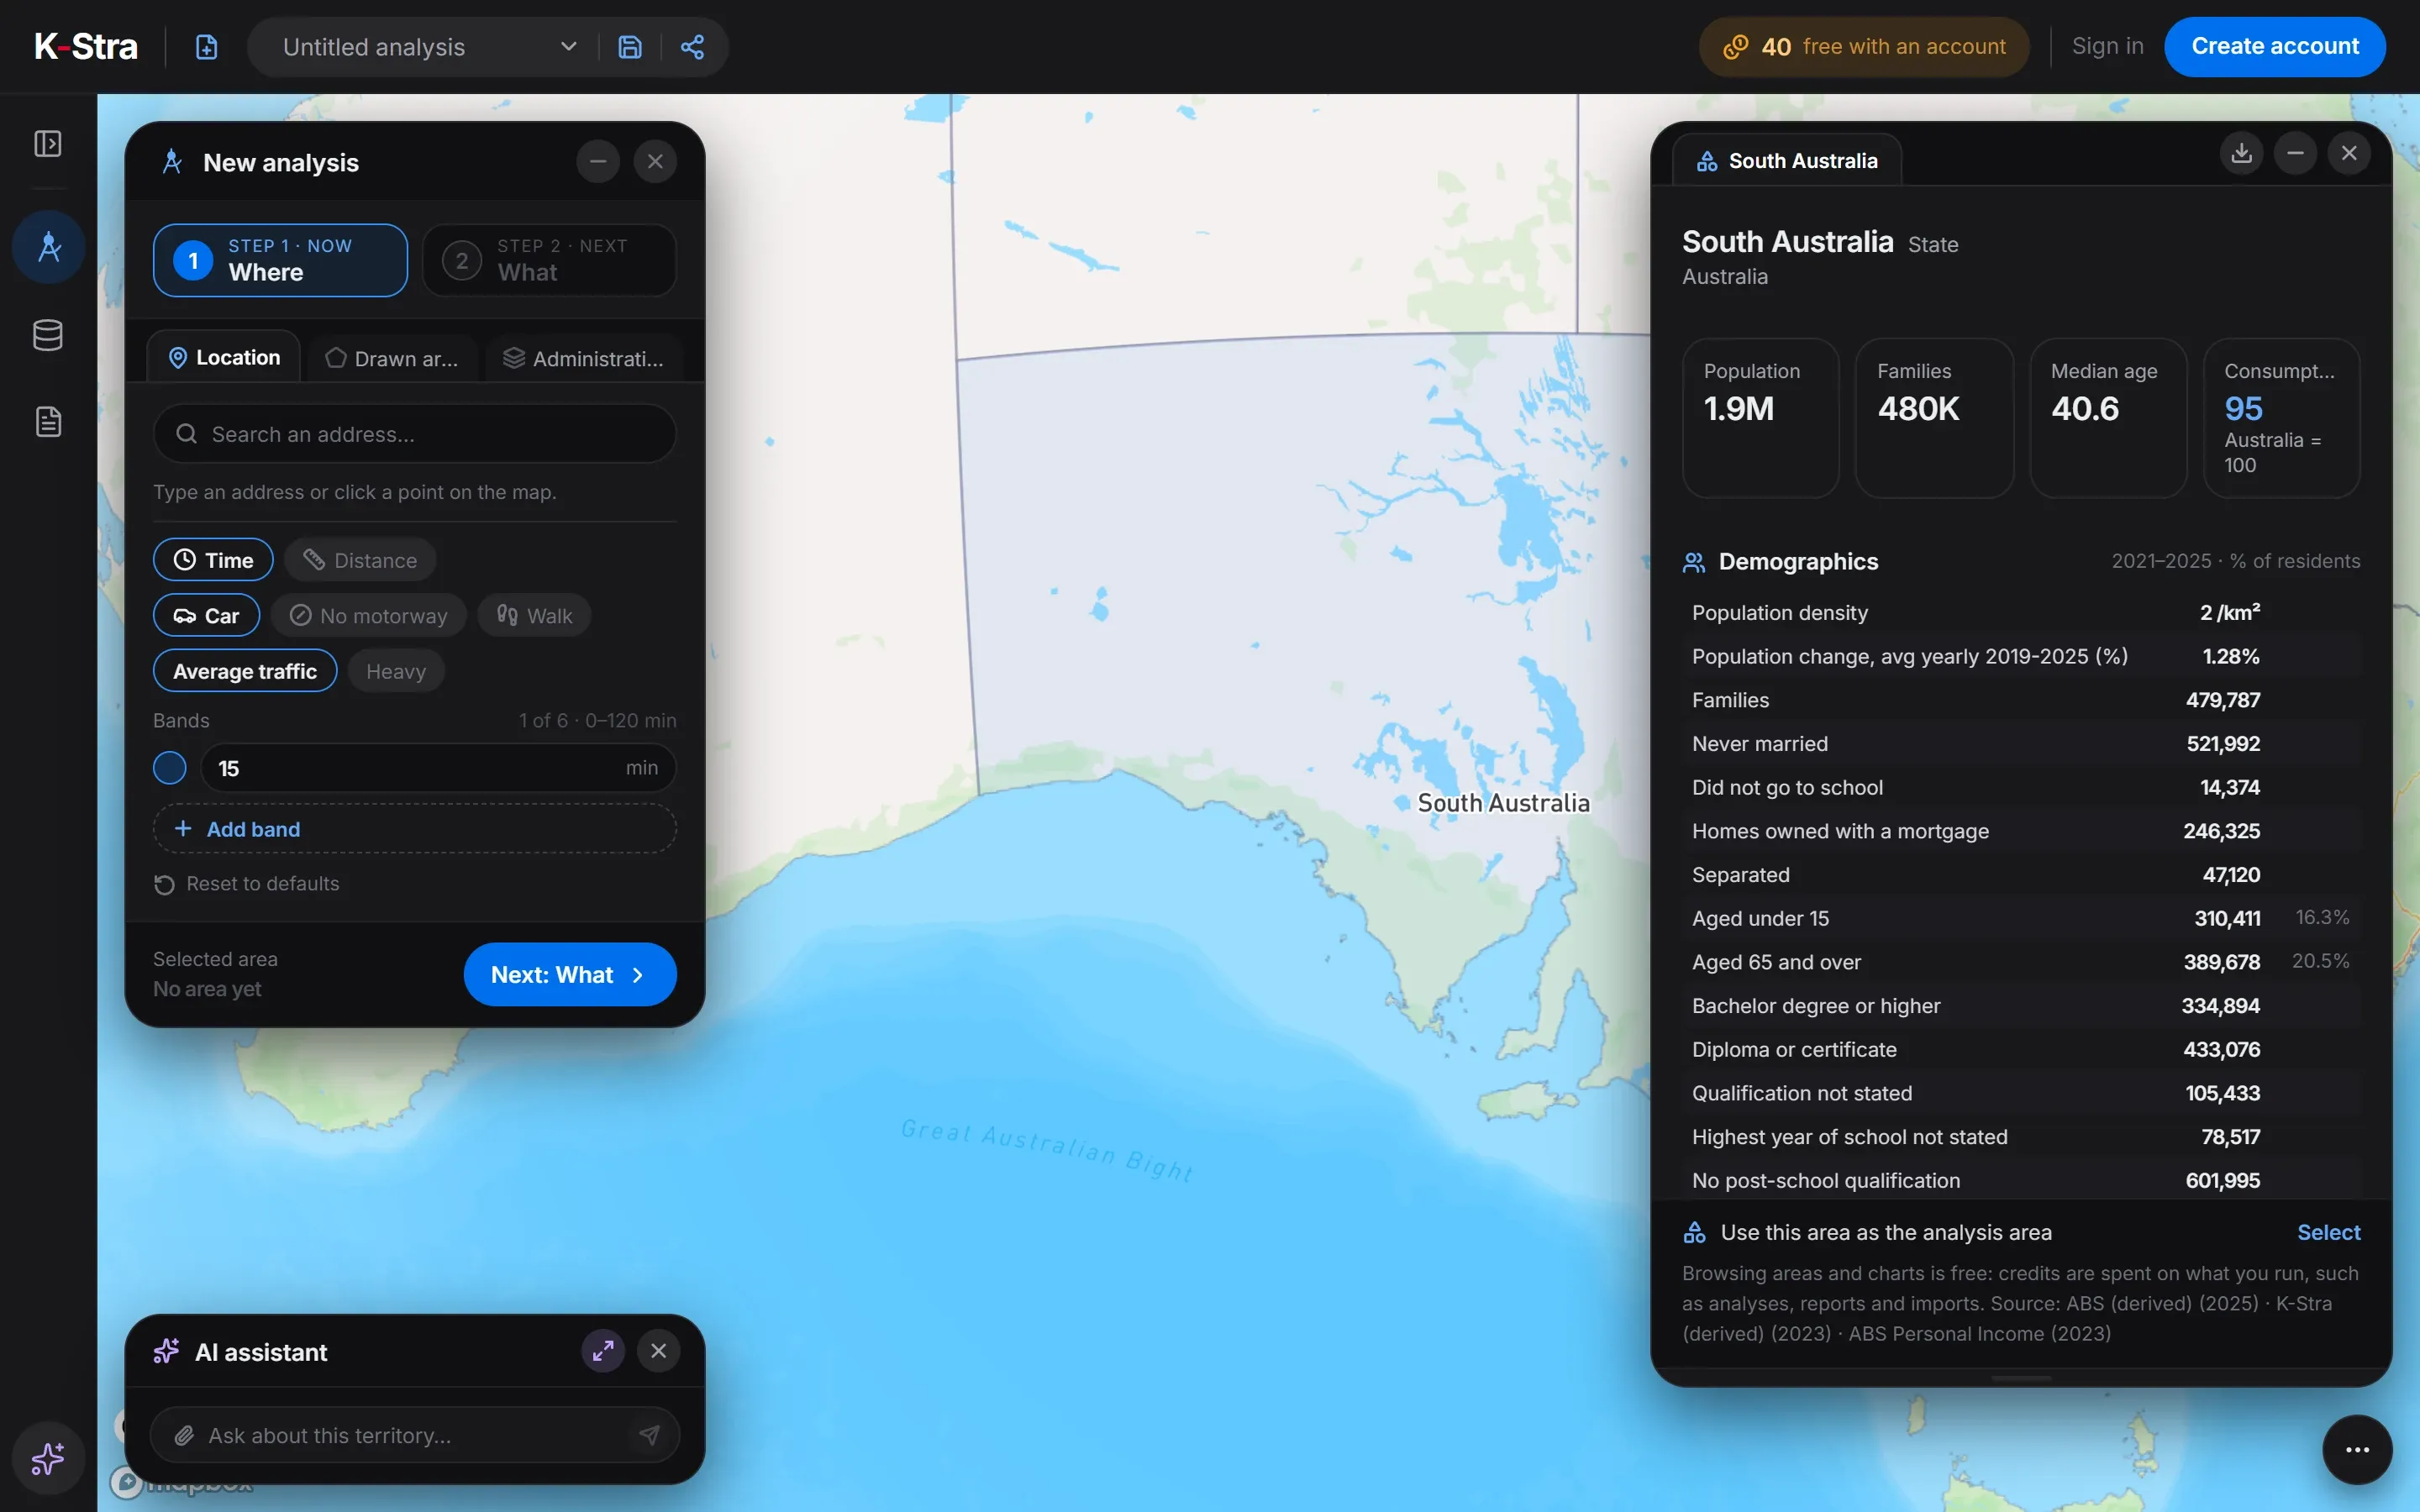 No account needed
On the map of Australia, a click on “South Australia” opens this dashboard; zooming in, the same click works on every council, postcode and suburb in SA. Browsing them costs nothing.
Figures for the whole of South Australia are a starting point: credits start when you measure the catchment of one of its addresses — the residents within a drive, their spending and the competitors already there.
What does this mean for choosing a location in South Australia?
An older population changes who the customers are, but the spending table does not show a shift towards health: residents spend A$3,614 a year on health, below the national A$3,823, and 7.2% of their budget against 7.3%. What the business counts show is supply: more aged care sites, pharmacies and supermarkets per resident and fewer childcare services, so a new health or aged care format meets more competitors per resident than in most states.
The growth is in a few places — Mount Barker, Playford, Gawler and the city centre — and each is a different market: a hills town of families, a young lower-income fringe, a commuter town, and an inner city of students and renters.
In a metropolitan area the size of Greater Adelaide, stores of the same network sit close together and their catchments overlap quickly. Cannibalisation is the first question for any second or third store.
What else do people ask about South Australia?
What is the population of South Australia?
1,902,665 at 30 June 2025 (ABS estimate). Greater Adelaide accounts for 1,490,470, or 78.3%.
Is South Australia older than the rest of the country?
Yes: its median age is 40.6 against 38.5 for Australia, and 20.5% of residents are 65 or over against 17.5%. Only Tasmania is older. Alexandrina, on the Fleurieu Peninsula, has a median age of 54.2.
Which councils in South Australia are growing fastest?
Mount Barker (3.74% a year on average from 2019 to 2025, 22.4% in all), Playford (3.39%), the City of Adelaide (3.15%), Alexandrina (2.16%) and Gawler (2.11%).
Open South Australia
on the map.
The app opens on the state: click a council for its free dashboard, or check how far your stores’ catchments overlap.
Open the app — free to exploreBrowsing areas and dashboards is free