
Which Australian councils are growing fastest?
A national ranking of the 231 Australian councils with more than 20,000 residents by how fast their population grew, and by how many people they added, from the ABS estimates for each year.
Among Australian councils with more than 20,000 residents, Melton in Victoria and Camden in New South Wales grew fastest from 2019 to 2025, both by 39.9% in six years, on average 6.65% a year, against 1.50% a year for Australia. Thirteen of the 15 fastest are in a capital city area, and eight of those 15 are in Western Australia.
Which councils grew fastest between 2019 and 2025?
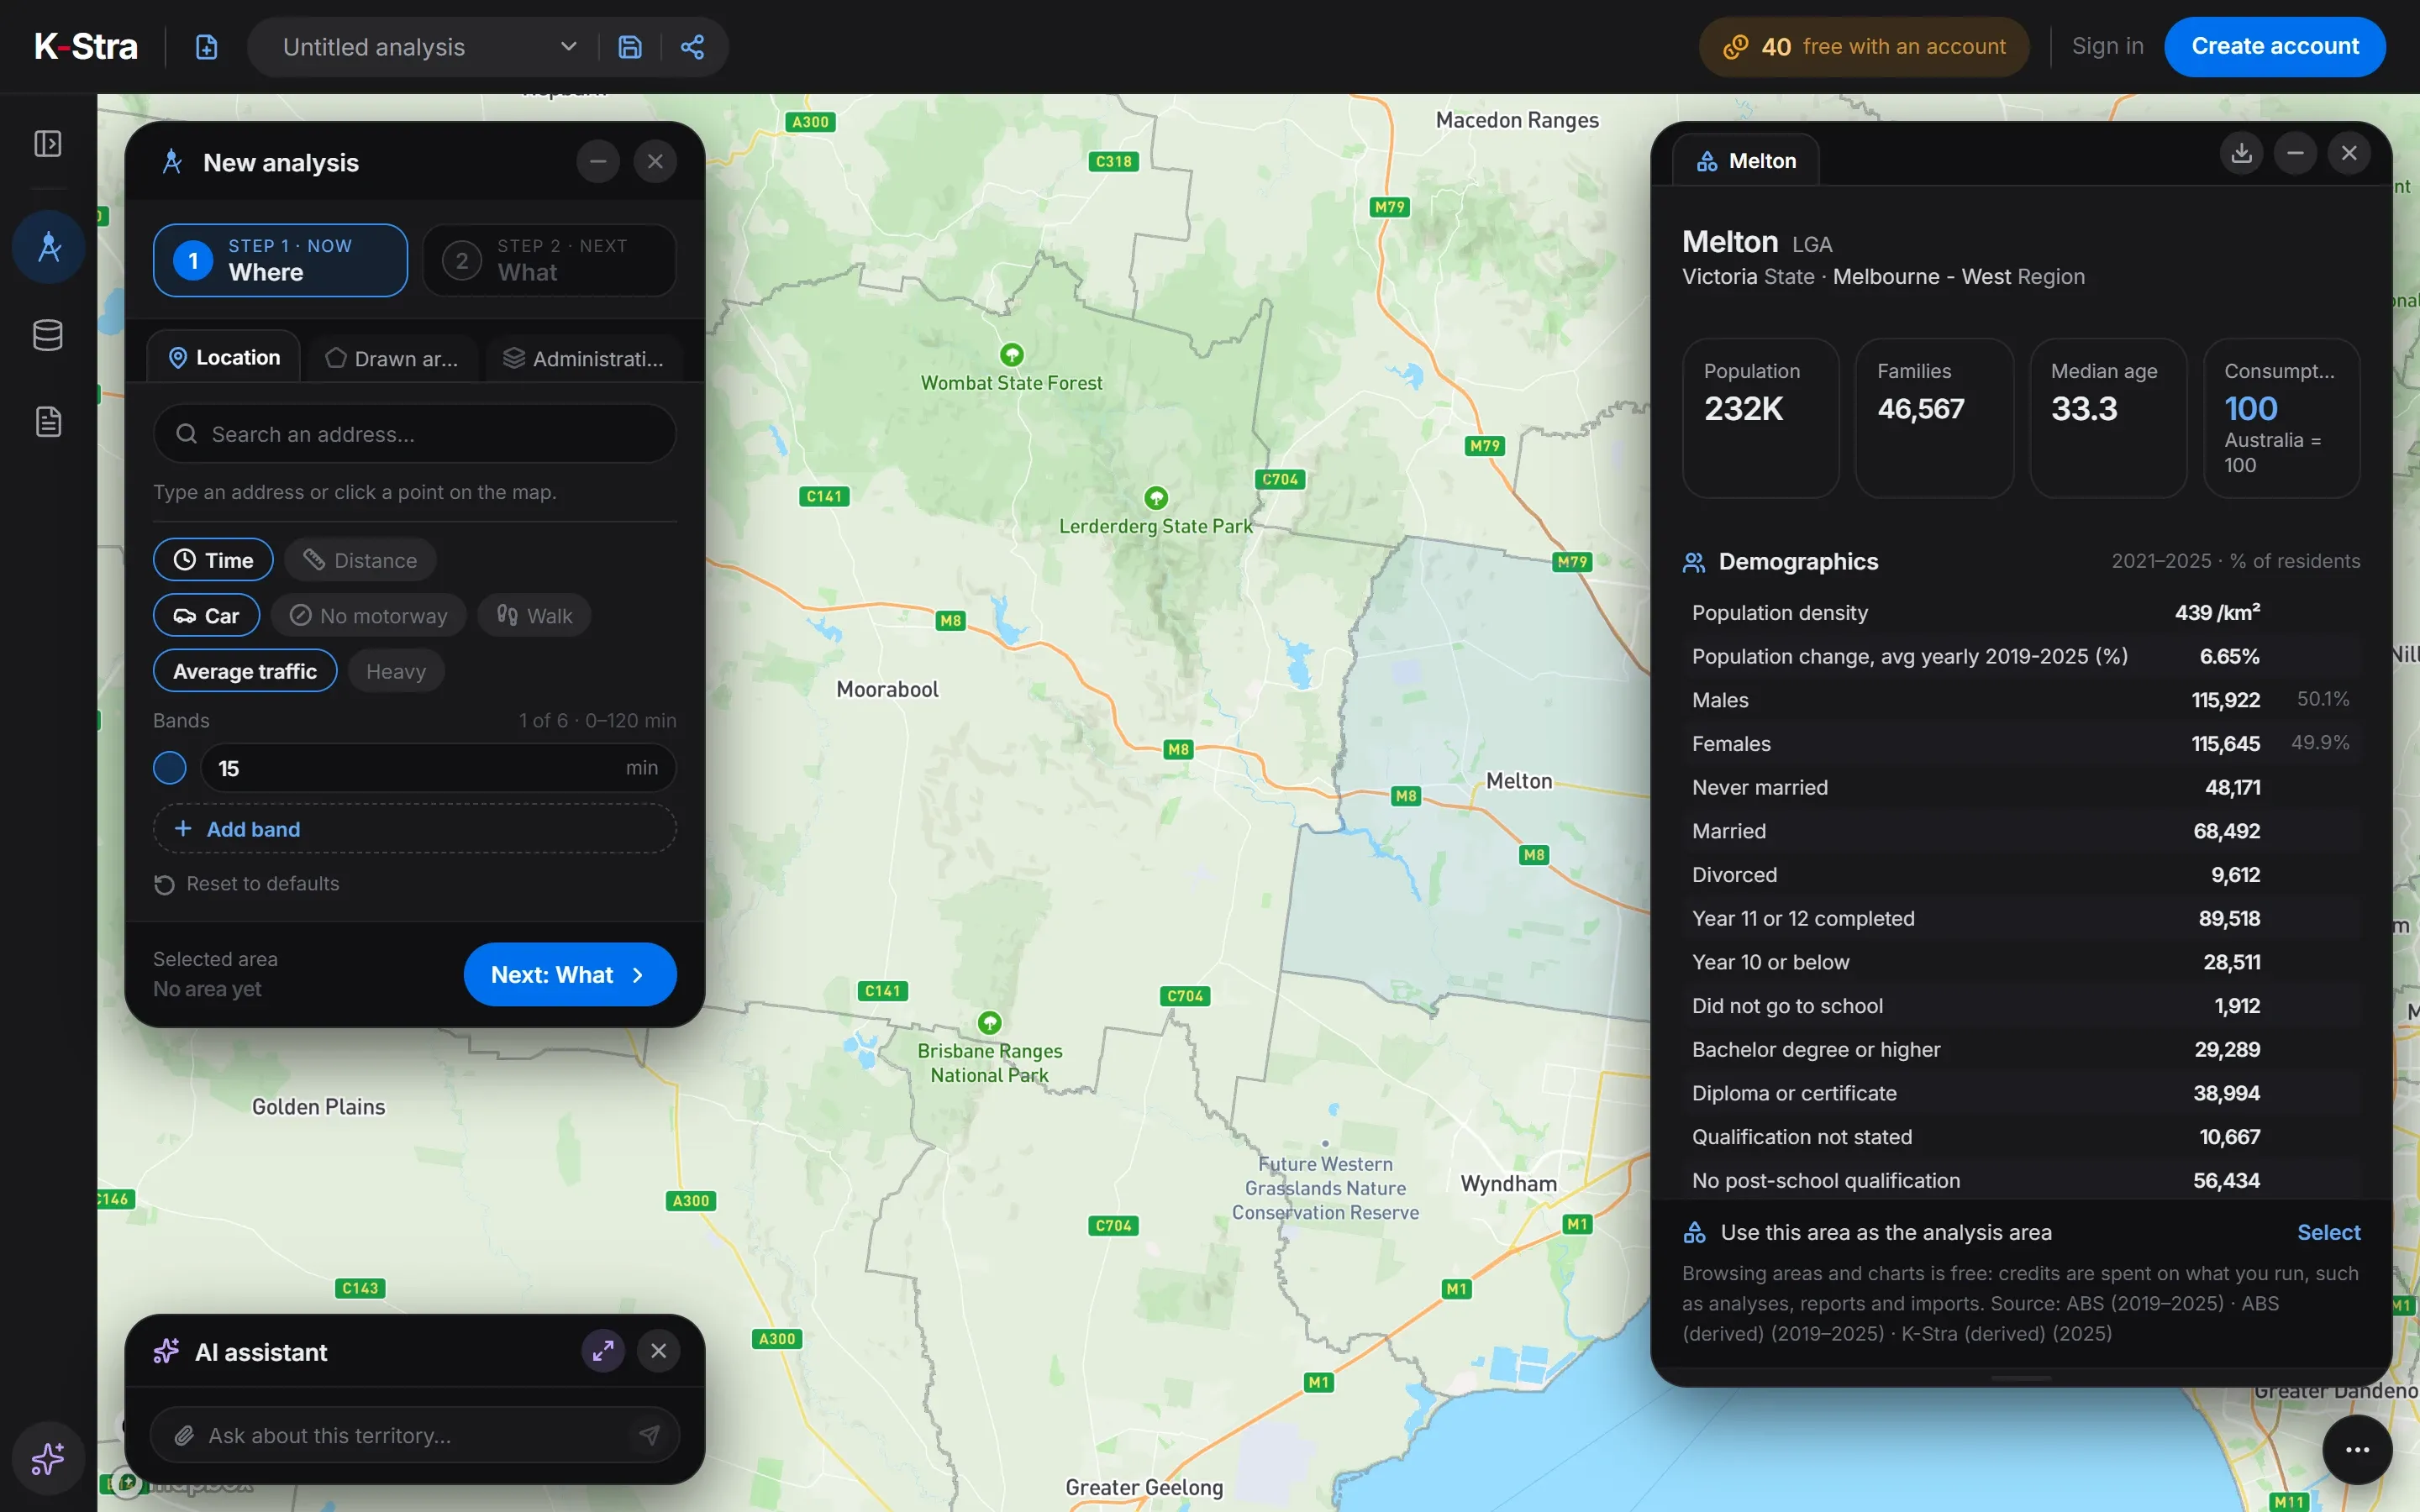 Free area dashboard · Melton
Melton, west of Melbourne, and Camden, south-west of Sydney, share first place: 66,032 and 41,777 new residents in six years. Their growth is the outer suburb kind, where farmland becomes housing estates and whole new neighbourhoods fill within a few years.
Perth dominates the list in a way the national totals hide. Eight of the 15 fastest councils are in Western Australia, from Serpentine-Jarrahdale and Kwinana on the southern fringe to Swan and Armadale on the eastern one.
Two of the fastest councils are city centres, not suburbs: the City of Perth in the top 15 and, a few places lower, the City of Adelaide. Apartment building in a small area with few residents produces a high percentage from a modest number of people.
| Council | State | Residents 2025 | Added since 2019 | Growth 2019–25 | Average yearly change | Area |
|---|---|---|---|---|---|---|
| Melton | VIC | 231,567 | 66,032 | 39.9% | 6.65% | Capital city |
| Camden | NSW | 146,483 | 41,777 | 39.9% | 6.65% | Capital city |
| Serpentine-Jarrahdale | WA | 40,531 | 9,121 | 29.0% | 4.84% | Capital city |
| Kwinana | WA | 57,422 | 12,722 | 28.5% | 4.74% | Capital city |
| Wyndham | VIC | 347,830 | 74,629 | 27.3% | 4.55% | Capital city |
| Perth | WA | 35,673 | 7,459 | 26.4% | 4.41% | Capital city |
| Mitchell | VIC | 58,459 | 12,086 | 26.1% | 4.34% | Regional |
| Swan | WA | 187,090 | 38,418 | 25.8% | 4.31% | Capital city |
| Augusta Margaret River | WA | 20,170 | 3,935 | 24.2% | 4.04% | Regional |
| The Hills | NSW | 222,675 | 42,573 | 23.6% | 3.94% | Capital city |
| Armadale | WA | 113,003 | 21,460 | 23.4% | 3.91% | Capital city |
| Mount Barker | SA | 45,111 | 8,269 | 22.4% | 3.74% | Capital city |
| Ipswich | QLD | 268,272 | 48,379 | 22.0% | 3.67% | Capital city |
| Cockburn | WA | 139,499 | 23,922 | 20.7% | 3.45% | Capital city |
| Mandurah | WA | 106,827 | 18,129 | 20.4% | 3.41% | Capital city |
| Australia | 27,613,654 | 2,278,591 | 9.0% | 1.50% |
ABS Estimated Resident Population by council at 30 June, 2019 to 2025, on 2025 council boundaries. Average yearly change 2019–2025 worked out as in the K-Stra area dashboard: (2025 ÷ 2019 − 1) ÷ 6 years. Area: “Capital city” when most of the council’s residents live inside the ABS Greater Capital City area.
Which councils added the most residents?
A percentage flatters small councils; for the size of a new market the number of people counts more. Measured that way, Brisbane comes first with 128,168 more residents, growing by only 10.3% in six years, on average 1.71% a year, because it starts from 1,247,133 people.
The ten councils that added most people account for 31.2% of Australia’s growth since 2019. Five are in South East Queensland, and Wyndham added more residents than any other suburban council: 74,629.
| Council | State | Residents 2019 | Residents 2025 | Added | Growth 2019–25 | Average yearly change |
|---|---|---|---|---|---|---|
| Brisbane | QLD | 1,247,133 | 1,375,301 | 128,168 | 10.3% | 1.71% |
| Gold Coast | QLD | 614,435 | 691,230 | 76,795 | 12.5% | 2.08% |
| Wyndham | VIC | 273,201 | 347,830 | 74,629 | 27.3% | 4.55% |
| Blacktown | NSW | 380,186 | 449,385 | 69,199 | 18.2% | 3.03% |
| Logan | QLD | 335,955 | 403,515 | 67,560 | 20.1% | 3.35% |
| Melton | VIC | 165,535 | 231,567 | 66,032 | 39.9% | 6.65% |
| Moreton Bay | QLD | 467,314 | 532,445 | 65,131 | 13.9% | 2.32% |
| Casey | VIC | 352,006 | 414,929 | 62,923 | 17.9% | 2.98% |
| Sunshine Coast | QLD | 329,946 | 381,957 | 52,011 | 15.8% | 2.63% |
| Canberra (ACT) | ACT | 435,730 | 484,630 | 48,900 | 11.2% | 1.87% |
ABS Estimated Resident Population by council at 30 June, 2019 to 2025, on 2025 council boundaries. The ACT is a single area with no councils and appears as Canberra (ACT).
Which Australian councils lost residents?
Only eleven of the 231 councils with more than 20,000 residents have fewer people in 2025 than in 2019. Brimbank, in Melbourne’s west, lost the most: 8,590 residents, a fall of 4.2% in six years, on average 0.69% a year.
In Melbourne the loss is mostly the pandemic years: Brimbank had 13,756 fewer residents in 2022 than in 2019 and has regained 5,166 since, and Boroondara and Nillumbik follow the same curve. The others are established Sydney suburbs where little new housing is built, Woollahra and Mosman, and regional towns such as Lithgow, Whyalla and Lismore, the last hit by major floods in 2022.
| Council | State | Residents 2025 | Change since 2019 | Change 2019–25 | Average yearly change |
|---|---|---|---|---|---|
| Brimbank | VIC | 198,181 | -8,590 | -4.2% | -0.69% |
| Woollahra | NSW | 55,218 | -1,674 | -2.9% | -0.49% |
| Lithgow | NSW | 20,693 | -523 | -2.5% | -0.41% |
| Mosman | NSW | 29,374 | -646 | -2.2% | -0.36% |
| Swan Hill | VIC | 20,962 | -445 | -2.1% | -0.35% |
| Whyalla | SA | 21,720 | -353 | -1.6% | -0.27% |
| Lismore | NSW | 43,642 | -592 | -1.3% | -0.22% |
| Nillumbik | VIC | 63,797 | -667 | -1.0% | -0.17% |
| Boroondara | VIC | 178,601 | -1,062 | -0.6% | -0.10% |
| Campaspe | VIC | 37,954 | -174 | -0.5% | -0.08% |
| Armidale | NSW | 29,652 | -49 | -0.2% | -0.03% |
What does fast population growth mean for a business?
Growth brings demand that is often not served yet. New estates fill before their shopping centres, clinics and gyms open, so the first years in a fast-growing council often have more residents than local businesses; the gap is measured in a separate article.
Two cautions. A council is a large area, and its growth sits in a few new suburbs, not everywhere; and estimates for the most recent year are revised by the ABS once the 2026 Census is counted. Draw the catchment around the actual site before reading anything into the council total.
What else do people ask about population growth?
What is the fastest-growing council in Australia?
Among councils with more than 20,000 residents, Melton (VIC) and Camden (NSW), both at 39.9% in six years from 2019 to 2025, on average 6.65% a year. By number of people added, Brisbane, with 128,168.
Why use councils for a growth ranking?
Because councils are the only small areas for which the ABS publishes a population estimate every year. Postcodes and suburbs have exact figures only in Census years.
Why are councils under 20,000 residents left out?
In very small councils a single mine, prison or retirement village can move the percentage by several points. The threshold keeps the ranking about places where a retail or service business could realistically open.
Can I see the growth of my own catchment?
Yes. The free dashboard of every area shows its average yearly change, and a K-Stra catchment analysis adds up residents by drive time from any address.
Look up any council’s
growth for free.
Click a council on the map to open its dashboard, then draw the catchment around your own site.
Open the app — free to exploreBrowsing areas and their dashboards is free; you pay only for the analyses you run