
Do Australia’s fastest-growing councils have enough shops?
Housing estates fill faster than shopping strips. Counting businesses against residents, council by council, among the 231 councils with more than 20,000 residents, shows which services lag behind growth and which keep pace.
Not yet. The fifth of Australian councils that grew fastest from 2019 to 2025 has 19% fewer pharmacies and 22% fewer bars and cafés per resident than the other councils with more than 20,000 residents. Melton has one pharmacy for every 7,719 residents, twice the national ratio. Childcare is the exception: per resident there is more of it.
How many shops per resident do fast-growing councils have?
Sorting the 231 councils with more than 20,000 residents by growth and splitting them into five groups of 46 or 47 councils gives a clear pattern. The fastest-growing fifth, 7,099,391 residents in 46 councils, has the fewest supermarkets, pharmacies, bars and cafés, and restaurants per resident of the five groups.
Childcare runs the other way: 5.7 centres per 10,000 residents in the fastest group against 5.1 in the others. Young families are what new estates are built for, and childcare operators follow them.
| Group of councils | Residents | Average yearly growth | Supermarkets | Pharmacies | Gyms | Bars & cafés | Restaurants | Childcare |
|---|---|---|---|---|---|---|---|---|
| Fastest-growing fifth | 7,099,391 | 2.24 to 6.65% | 2.5 | 2.2 | 6.5 | 9.5 | 10.6 | 5.7 |
| Second fifth | 5,906,696 | 1.43 to 2.24% | 2.6 | 2.6 | 7.6 | 11.5 | 12.2 | 4.9 |
| Middle fifth | 3,989,621 | 0.93 to 1.42% | 3.1 | 2.6 | 6.6 | 11.2 | 11.4 | 5.1 |
| Fourth fifth | 4,566,871 | 0.46 to 0.92% | 3.0 | 2.8 | 7.5 | 13.8 | 13.7 | 5.3 |
| Slowest fifth | 4,199,766 | -0.69 to 0.44% | 2.8 | 2.8 | 7.0 | 12.8 | 13.9 | 5.0 |
| Australia | 27,613,654 | 1.50% | 2.9 | 2.6 | 7.1 | 12.0 | 12.2 | 5.2 |
K-Stra places catalogue, October 2026, as the app classifies each business; residents at 30 June 2025. Councils with more than 20,000 residents; Average yearly change 2019–2025 worked out as in the K-Stra area dashboard: (2025 ÷ 2019 − 1) ÷ 6 years.
How many residents share each supermarket and pharmacy in the fastest-growing large councils?
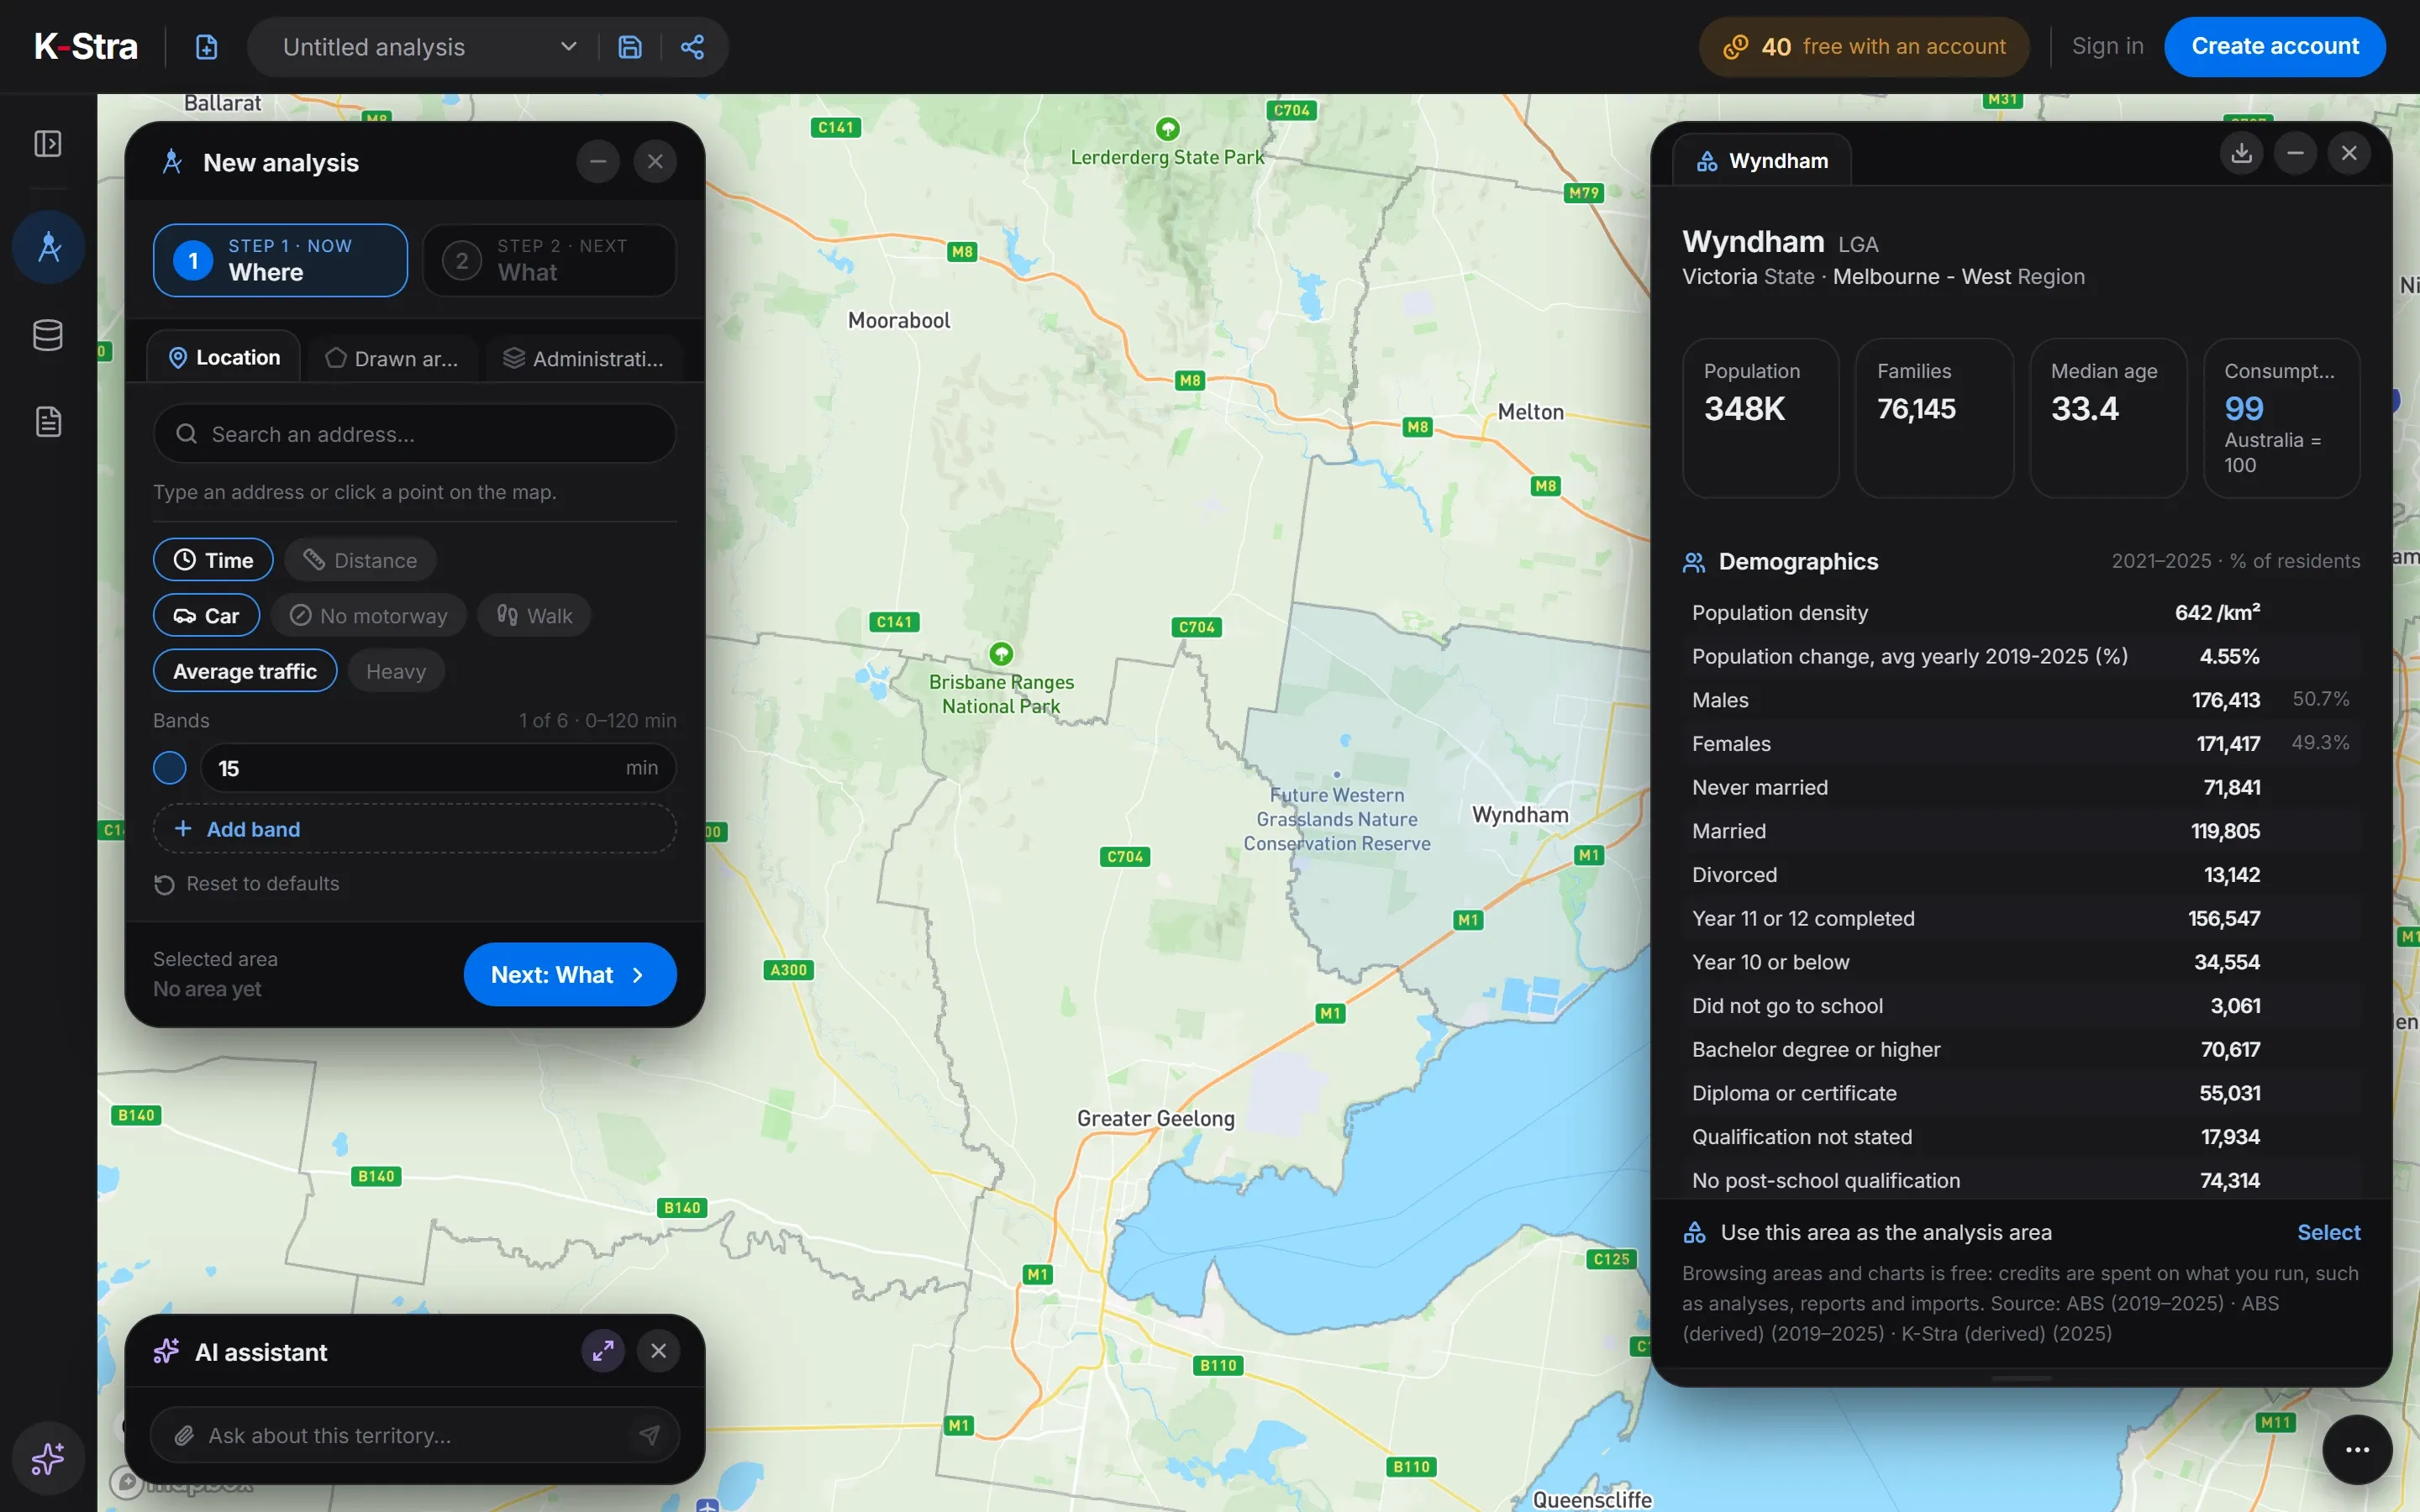 Free area dashboard · Wyndham
Among councils with more than 100,000 residents, the gap is widest on Melbourne’s western fringe and in Perth’s south-east. In Wyndham each pharmacy serves 7,246 residents, in Melton 7,719 and in Armadale 7,534, against 3,801 for Australia.
Supermarkets stay closer to the national ratio than pharmacies do. Not every fast-growing council lags: Mandurah already has more pharmacies per resident than the national average, and Cockburn and Playford are within 5% of it.
| Council | State | Residents 2025 | Average yearly change | Residents per supermarket | Residents per pharmacy | Residents per gym |
|---|---|---|---|---|---|---|
| Melton | VIC | 231,567 | 6.65% | 5,146 | 7,719 | 2,049 |
| Camden | NSW | 146,483 | 6.65% | 4,725 | 6,103 | 1,172 |
| Wyndham | VIC | 347,830 | 4.55% | 4,517 | 7,246 | 1,911 |
| Swan | WA | 187,090 | 4.31% | 4,252 | 4,158 | 1,990 |
| The Hills | NSW | 222,675 | 3.94% | 4,049 | 4,366 | 1,210 |
| Armadale | WA | 113,003 | 3.91% | 4,346 | 7,534 | 2,511 |
| Ipswich | QLD | 268,272 | 3.67% | 4,471 | 4,968 | 2,112 |
| Cockburn | WA | 139,499 | 3.45% | 4,982 | 3,986 | 1,766 |
| Mandurah | WA | 106,827 | 3.41% | 5,087 | 3,446 | 1,696 |
| Playford | SA | 115,790 | 3.39% | 3,308 | 3,860 | 2,693 |
| Australia | 27,613,654 | 1.50% | 3,422 | 3,801 | 1,417 |
K-Stra places catalogue, October 2026, as the app classifies each business; residents at 30 June 2025.
Why do some councils have ten times more cafés per resident?
Because their customers do not live there. The City of Adelaide has 115.7 bars and cafés per 10,000 residents, almost ten times the national 12.0, since it serves the whole metropolitan area’s workers and visitors. Byron has 29.4 gyms and studios per 10,000 residents, four times the national rate, for a population swollen by tourists.
The same logic works in reverse. A fringe council’s residents drive to shopping centres in the next council, so a low ratio is a reason to look closer, not proof that the market is free. The real test is the catchment of a site, with competitors counted inside the drive time rather than inside a boundary.
How can a retailer use this kind of gap?
Start from the councils where residents grow and businesses per resident are low, then move to the scale that matters: the drive time around candidate sites. In K-Stra the council dashboard is free; counting competitors and residents inside a catchment is an analysis that costs credits.
Then check what the ratio cannot show: shopping centres planned but not yet open, the size of each competitor, and whether residents already shop on the way to work. A gap that survives those checks is worth a site visit.
What else do people ask about shops and services?
Which fast-growing council has the fewest pharmacies per resident?
Among councils with more than 100,000 residents in the fastest-growing ten, Melton: one pharmacy for every 7,719 residents in 2025, against 3,801 for Australia.
Where does the count of businesses come from?
From the K-Stra places catalogue, built from public online business listings and classified by sector by the app. It counts outlets, not their floor space or sales.
Does a low ratio mean there is room for a new store?
It is a reason to look, not a conclusion. Residents may shop in the next council, and a centre may already be planned. The catchment of the actual site, with competitors and residents inside the same drive time, decides.
Why is there more childcare in fast-growing councils?
New estates attract young families, and in the fastest-growing councils children are a larger share of residents. Those councils have 5.7 childcare centres per 10,000 residents, more than the other groups; counted per child, 28.6 per 10,000 under 15, they are slightly below the national 30.1.
Count competitors
around your own site.
Draw a drive time anywhere in Australia and see residents and businesses by sector inside it.
Open the app — free to exploreBrowsing areas and their dashboards is free; you pay only for the analyses you run