
How do you get traffic count data for any road in Australia?
Vehicles on every road and pedestrians on every street, across the country, in bands you can compare from one site to the next.
Official traffic counts in Australia cover mostly main roads, often years apart. K-Stra shows them on the map and estimates every other road: vehicles a day in seven bands, both directions, and foot traffic in five grades, calibrated on official counts in five states and on pedestrian counters in four cities, for any day or hour.
What does footfall look like in central Melbourne?
Streets coloured by footfall on Wednesday 11 November 2026, 08:00–18:00, within 15 minutes on foot of 201-203 Bourke Street, Melbourne. The markers are the 44 pedestrian counters inside the area, in the colour of their measured grade.
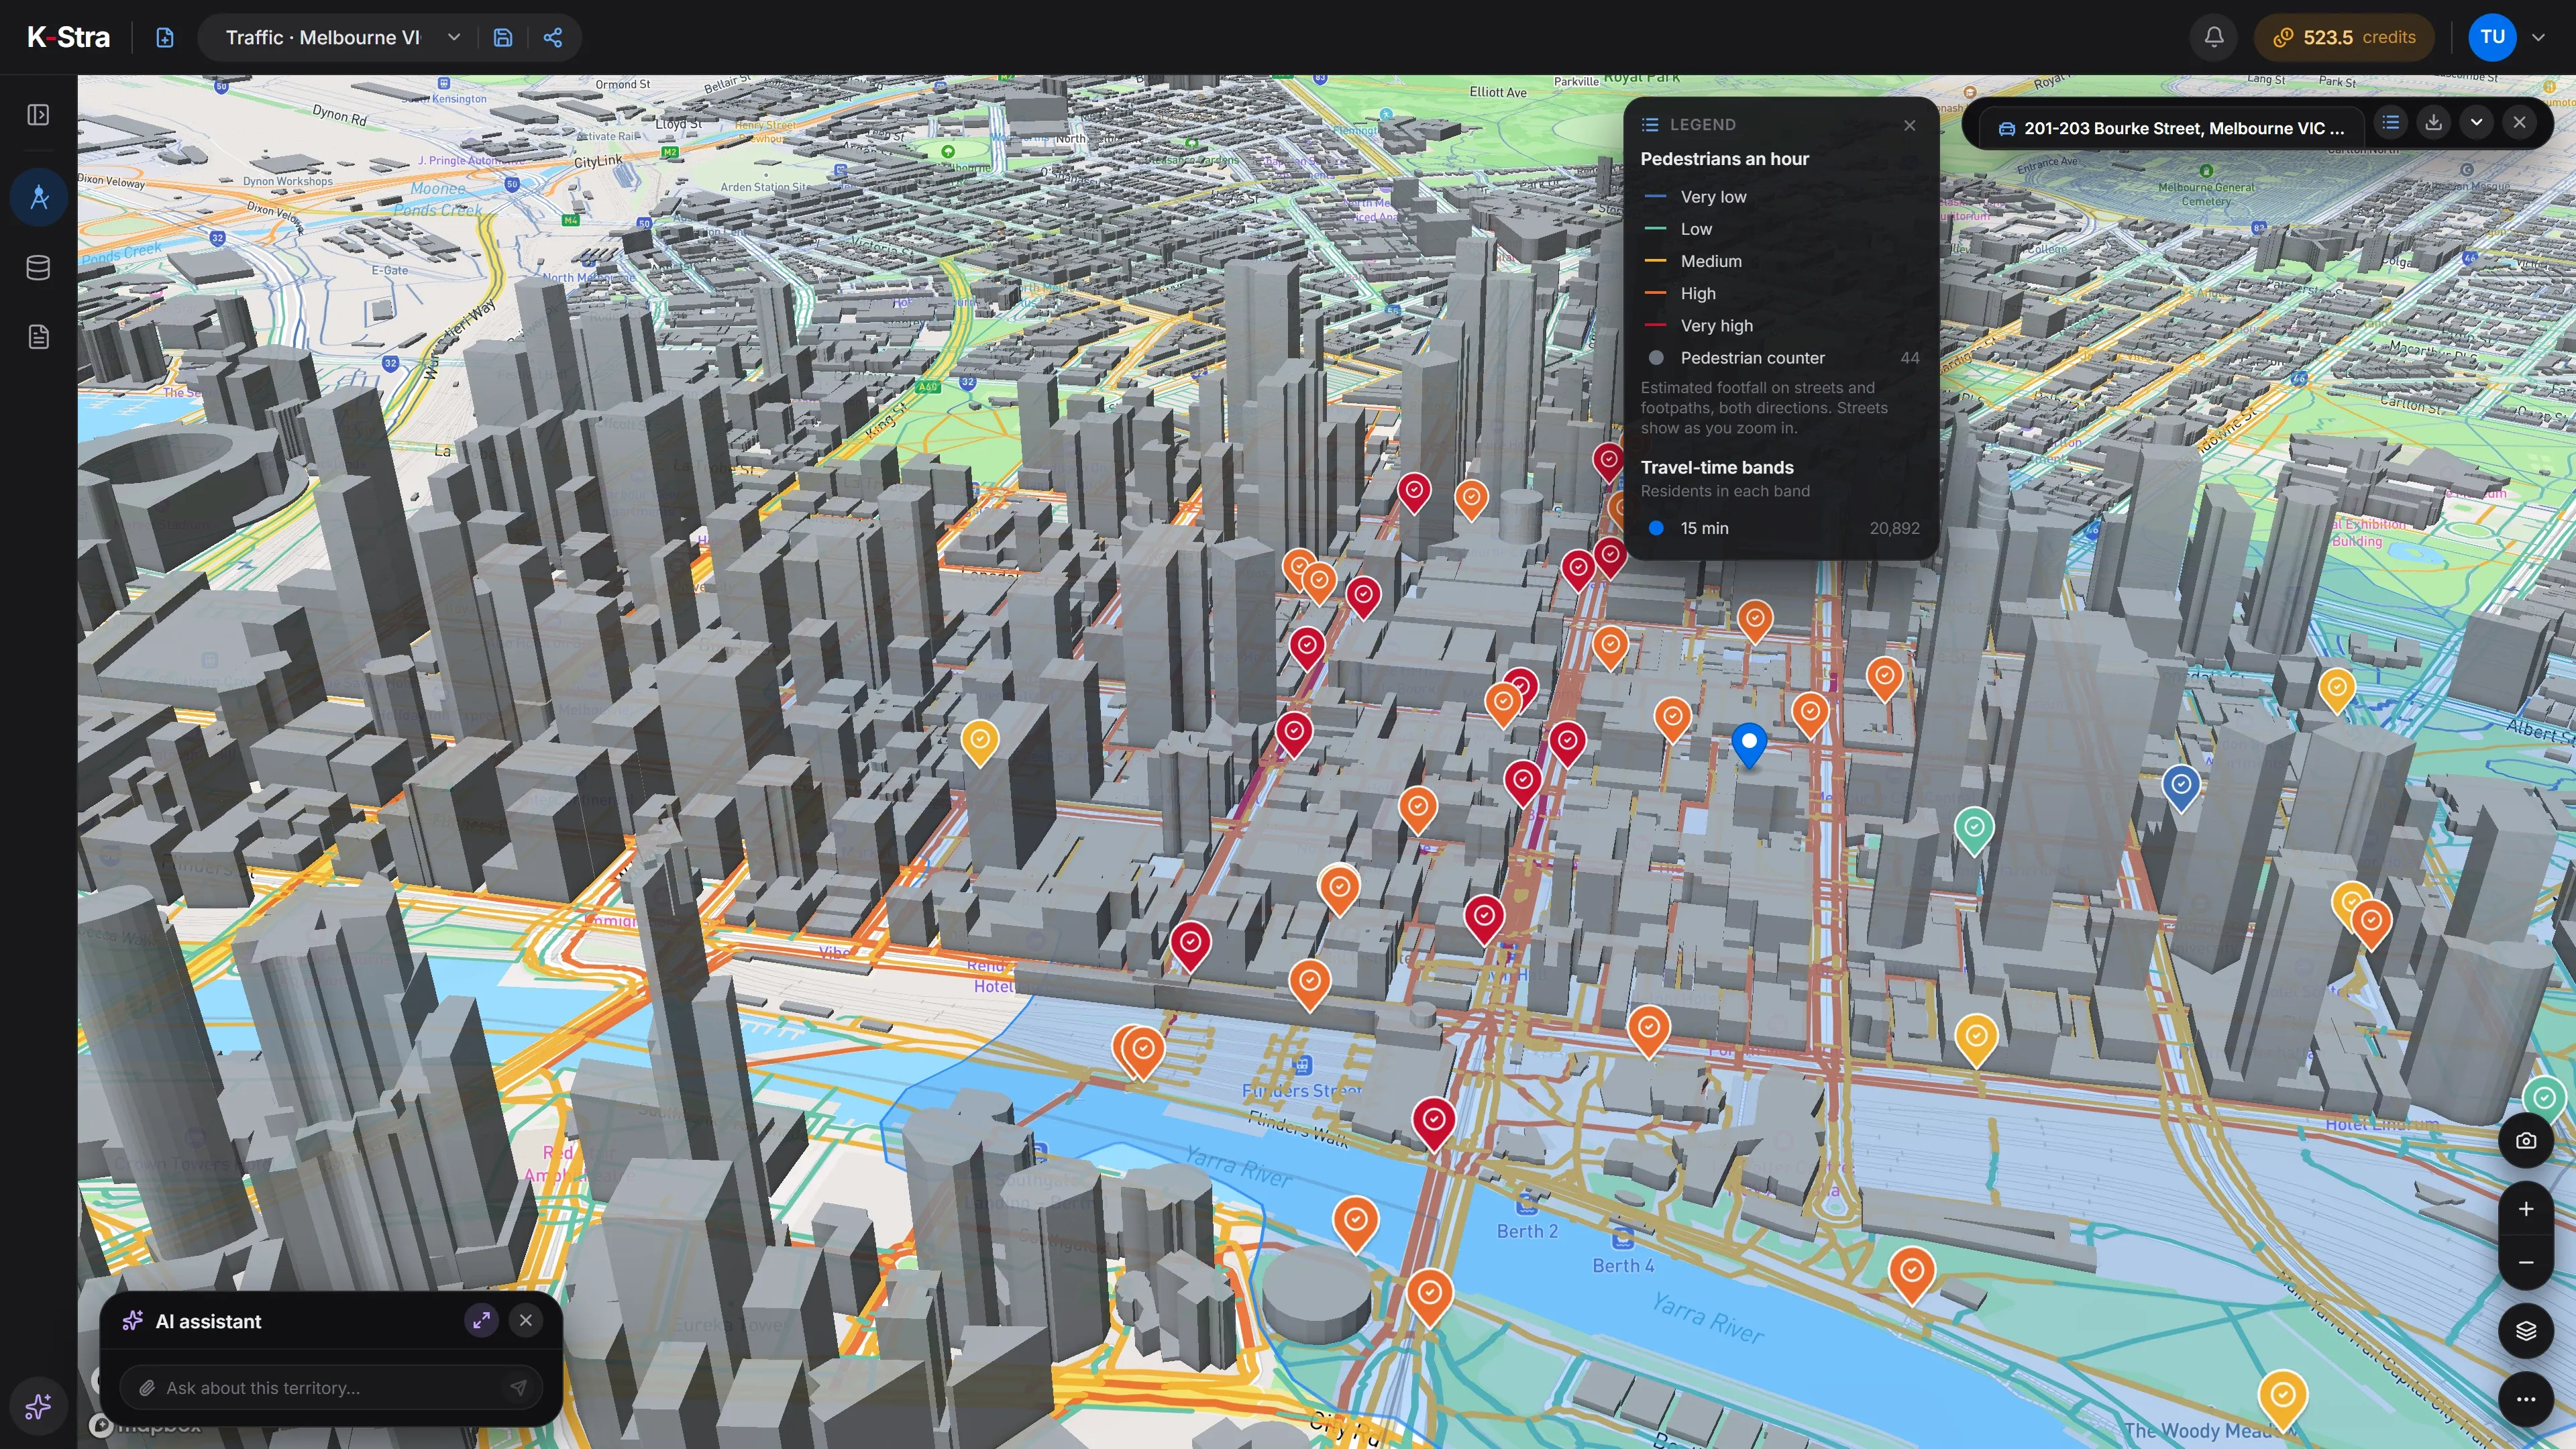 Pedestrians, 08:00–18:00
Where do official traffic counts come from, and what do they miss?
State road agencies count the roads they manage and publish many of the counts as free open data. They count mostly main roads, at fixed points and often years apart; a side street or a new shopping strip usually has no count at all.
Pedestrian counters are rarer still: a few city councils run them, almost all in city centres. Outside those, nobody counts the people walking past a shopfront.
And traffic moves with the clock. A street that is full at 8 am on a Tuesday can be quiet on Sunday afternoon, so a single figure for a road hides most of what a site decision needs.
official traffic counts inside the area within 15 minutes by car in average traffic of 483 George Street, Sydney, across 2,682 km of roads. Every other road needs an estimate.
K-Stra analysis of 4 November 2026
What is AADT, and how is a traffic count made?
AADT, annual average daily traffic, is the number of vehicles passing a point of a road in both directions in a year, divided by the days of the year. Most traffic counts in Australia are published that way.
Counts come from permanent counting stations, from sensors at traffic signals and from short surveys with tubes laid across the road. A short count is scaled up to a year with the pattern of similar roads, which is why every published count carries its year.
K-Stra’s vehicle bands read the same way: vehicles a day, both directions, on the average day of the year. Choose a day, a month or an hour, and the band follows that period instead.
Pedestrian counters are sensors fixed above a footpath that count the people walking past, hour by hour. Where councils publish them, K-Stra uses them to calibrate a grade of foot traffic for every street.
How do you estimate traffic on a road that was never counted?
Start from why people move
Place where people live, where they work and where they shop. Every trip starts at one of these and ends at another.
Route the trips on the roads
Send each trip along the road network, by the fastest path, so every road carries the trips that pass through it.
Calibrate on what was counted
Compare the result with official traffic counts and pedestrian counters, and correct the model where it is too high or too low.
Keep the counts as they are
Where a road has an official count, show the counted band, with its year, instead of the estimate.
Scale to the period
Turn the average day into a month, a type of day and an hour with the typical profile of each type of road; public holidays count as Sundays.
Read in bands, not numbers
Give each road a band of vehicles, or a grade of footfall, wide enough to be honest about what a model can know.
Which parts of Australia are covered, and how?
Every road in Australia has an estimate; what changes is what the model was calibrated on. Vehicles: official traffic counts in New South Wales, Victoria, Queensland, South Australia and Western Australia. Pedestrians: counters in Melbourne, Brisbane, Casey and Sydney.
| State or territory | Roads | Vehicles calibrated on | Pedestrians calibrated on |
|---|---|---|---|
| New South Wales | Every road | Official traffic counts | Pedestrian counters |
| Victoria | Every road | Official traffic counts | Pedestrian counters |
| Queensland | Every road | Official traffic counts | Pedestrian counters |
| South Australia | Every road | Official traffic counts | No local counters |
| Western Australia | Every road | Official traffic counts | No local counters |
| Tasmania | Every road | No local counts | No local counters |
| The ACT | Every road | No local counts | No local counters |
| The Northern Territory | Every road | No local counts | No local counters |
Source: K-Stra traffic estimates, 4 November 2026; official traffic counts and pedestrian counters of state road agencies and councils.
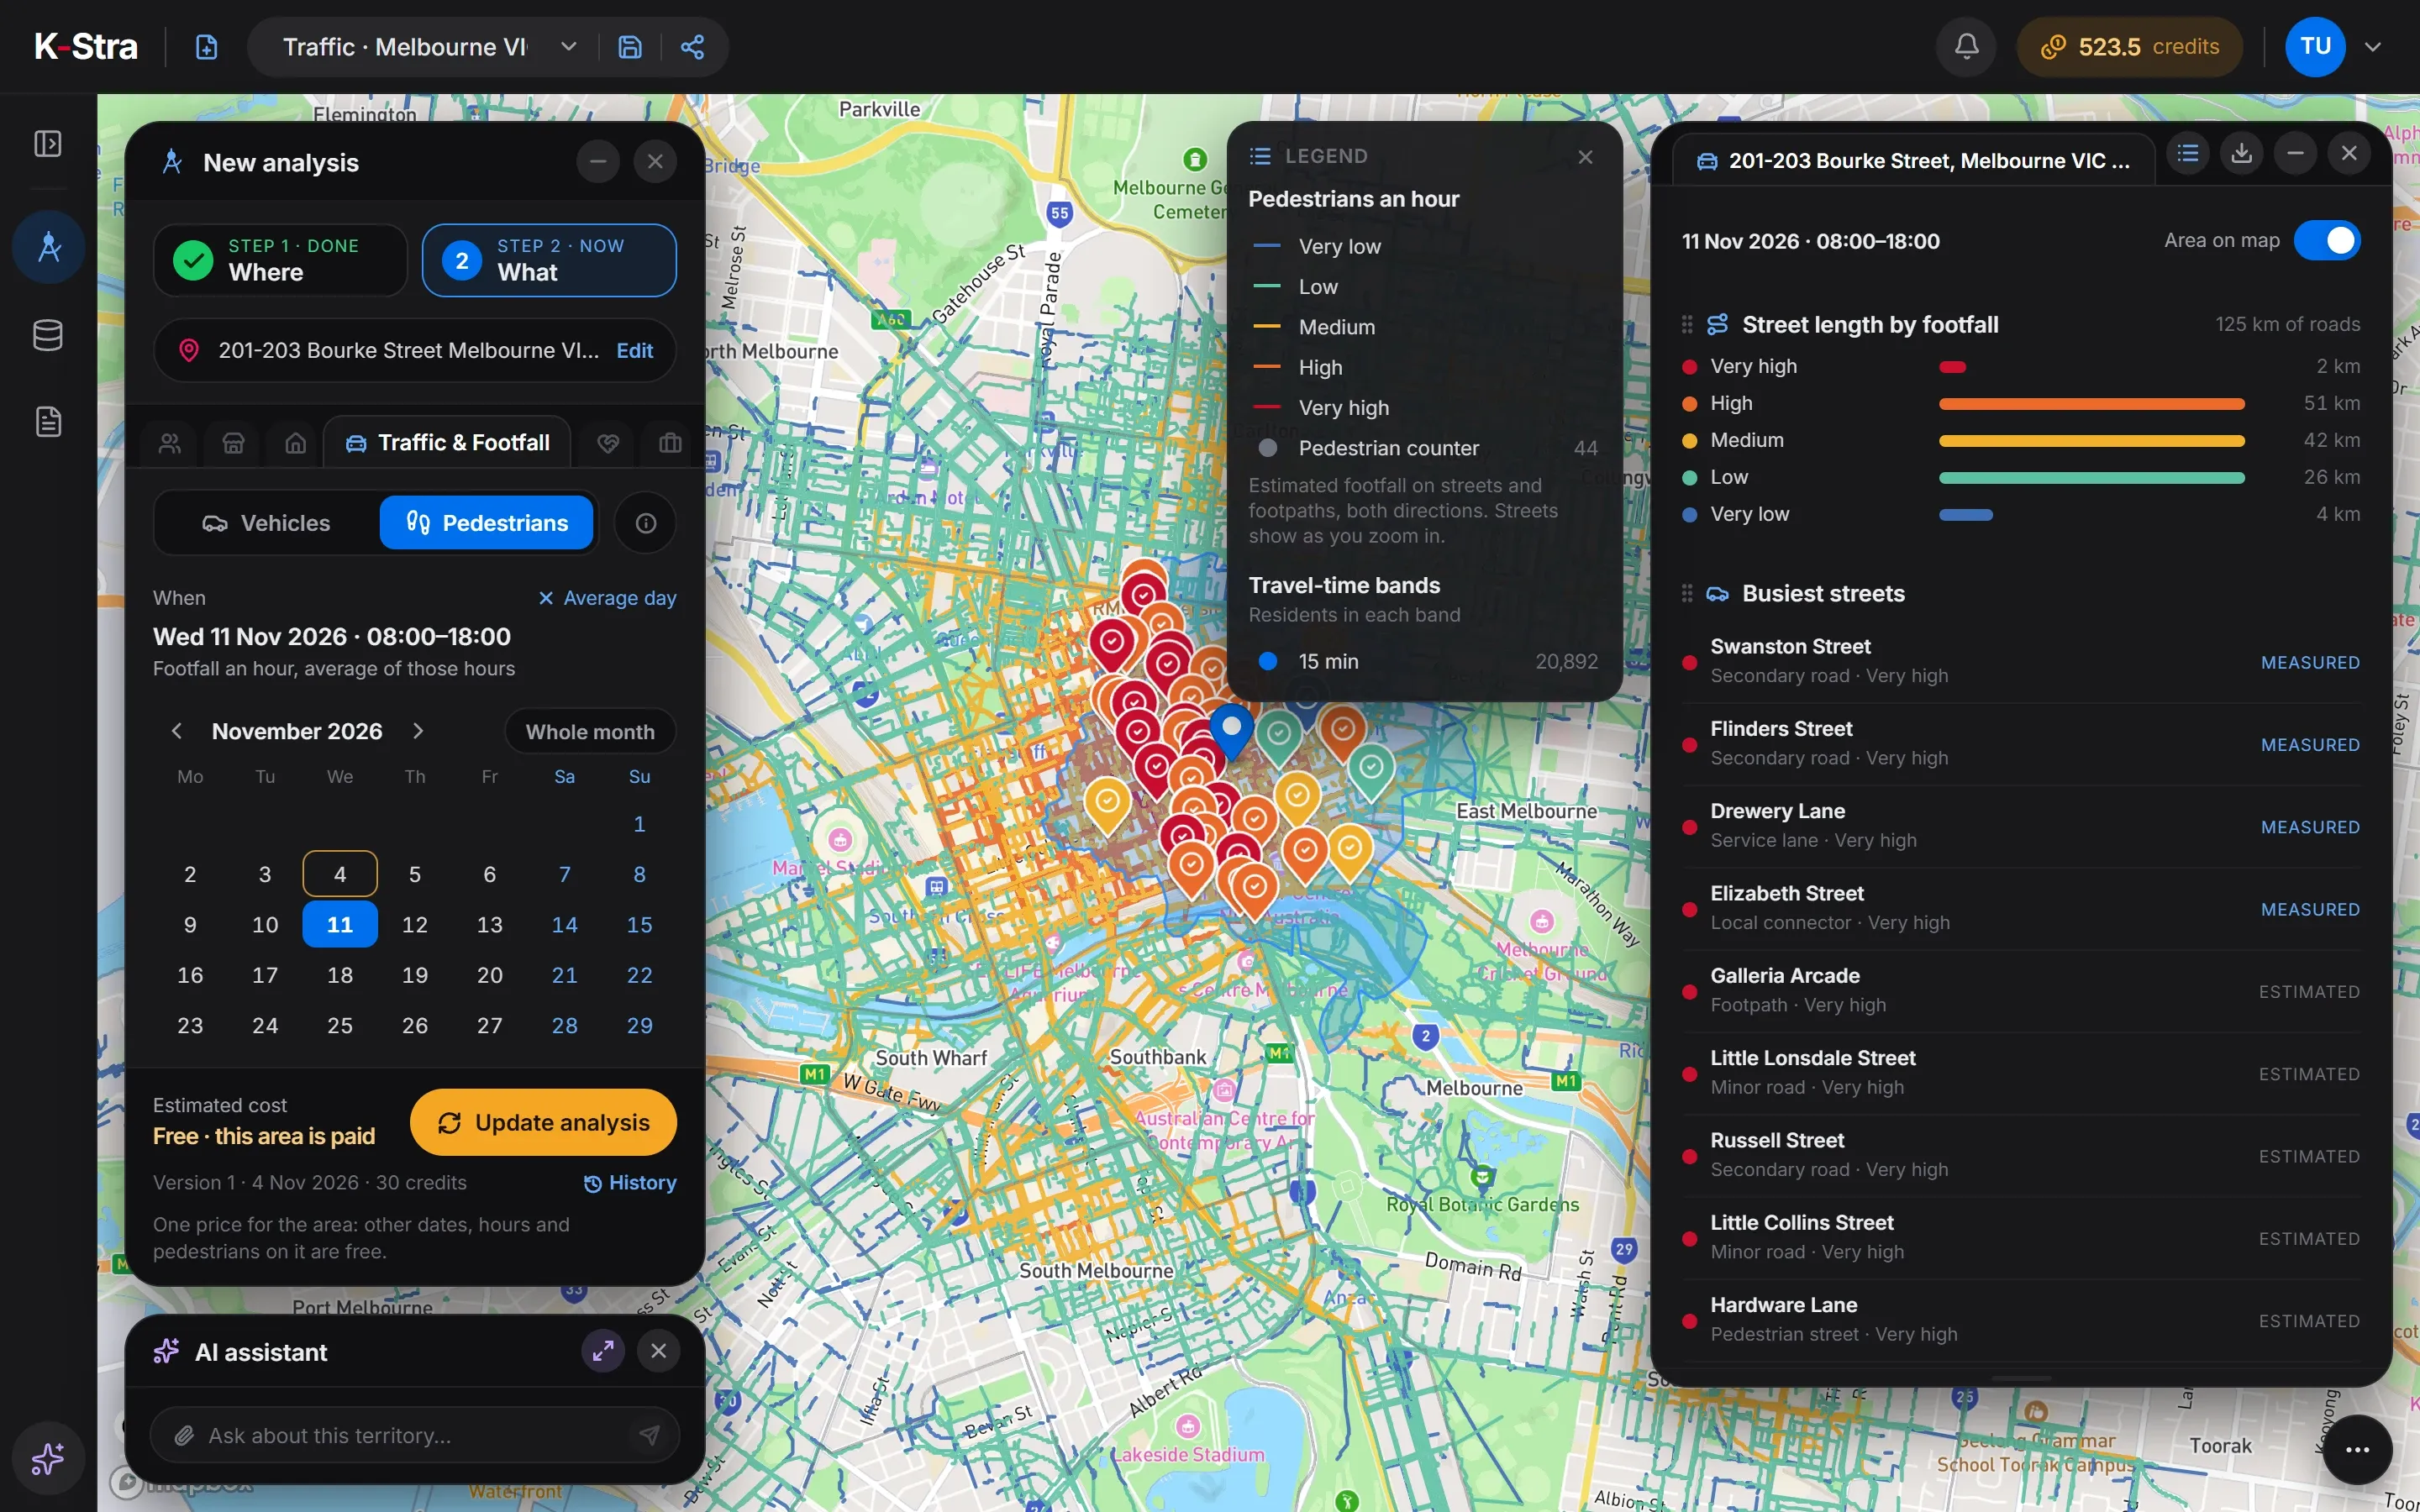
How do you see traffic for your own area in K-Stra?
The steps above run inside the app. Exploring the map needs no account; running Traffic & Footfall needs a free one.
- WhereType an address and draw a travel-time area, draw a shape, or pick administrative areas.
- WhatOpen Traffic & Footfall, choose vehicles or pedestrians, and a day, a range or a month, and the hours.
- DecideConfirm the 30 credits and read the coloured roads, the busiest ones and the counts in the area.
Once the area is paid, changing the day, the hours or switching to pedestrians is free. What the module shows · the step-by-step guide.
What does Traffic & Footfall look like in the app?
On-screen text
New in K-Stra. Who passes by? Cars and people, estimated on every road in Australia. Vehicles a day, on every road: over 60,000; 30,000–60,000; 15,000–30,000; 8,000–15,000; 3,000–8,000; 1,000–3,000; under 1,000. Official count, measured. Pedestrians, street by street: very high, high, medium, low, very low. Pedestrian counter. Any day. Any hour. Thursday 5 November: 03:00, 08:00, 13:00. Any street in Australia · k-stra.com.
Which streets in central Melbourne are the busiest on foot?
Within 15 minutes on foot of 201-203 Bourke Street, Melbourne, 125 km of streets, footpaths and pedestrian ways. Only 2 km reach the top grade, and 53 km are high or very high: footfall gathers on a few streets.
| Footfall grade | Street length (km) |
|---|---|
| Very high | 2 |
| High | 51 |
| Medium | 42 |
| Low | 26 |
| Very low | 4 |
| Total | 125 |
Source: K-Stra analysis of 4 November 2026; K-Stra footfall estimates and pedestrian counters. Very high and measured: Swanston Street, Flinders Street, Drewery Lane and Elizabeth Street. Very high and estimated: Galleria Arcade, Little Lonsdale Street, Russell Street, Little Collins Street and Hardware Lane.
And where does the traffic run in central Sydney?
Roads coloured by vehicles a day on the average day of the year, within 15 minutes by car in average traffic of 483 George Street, Sydney. Of 2,682 km of roads, 65 km carry over 60,000 a day.
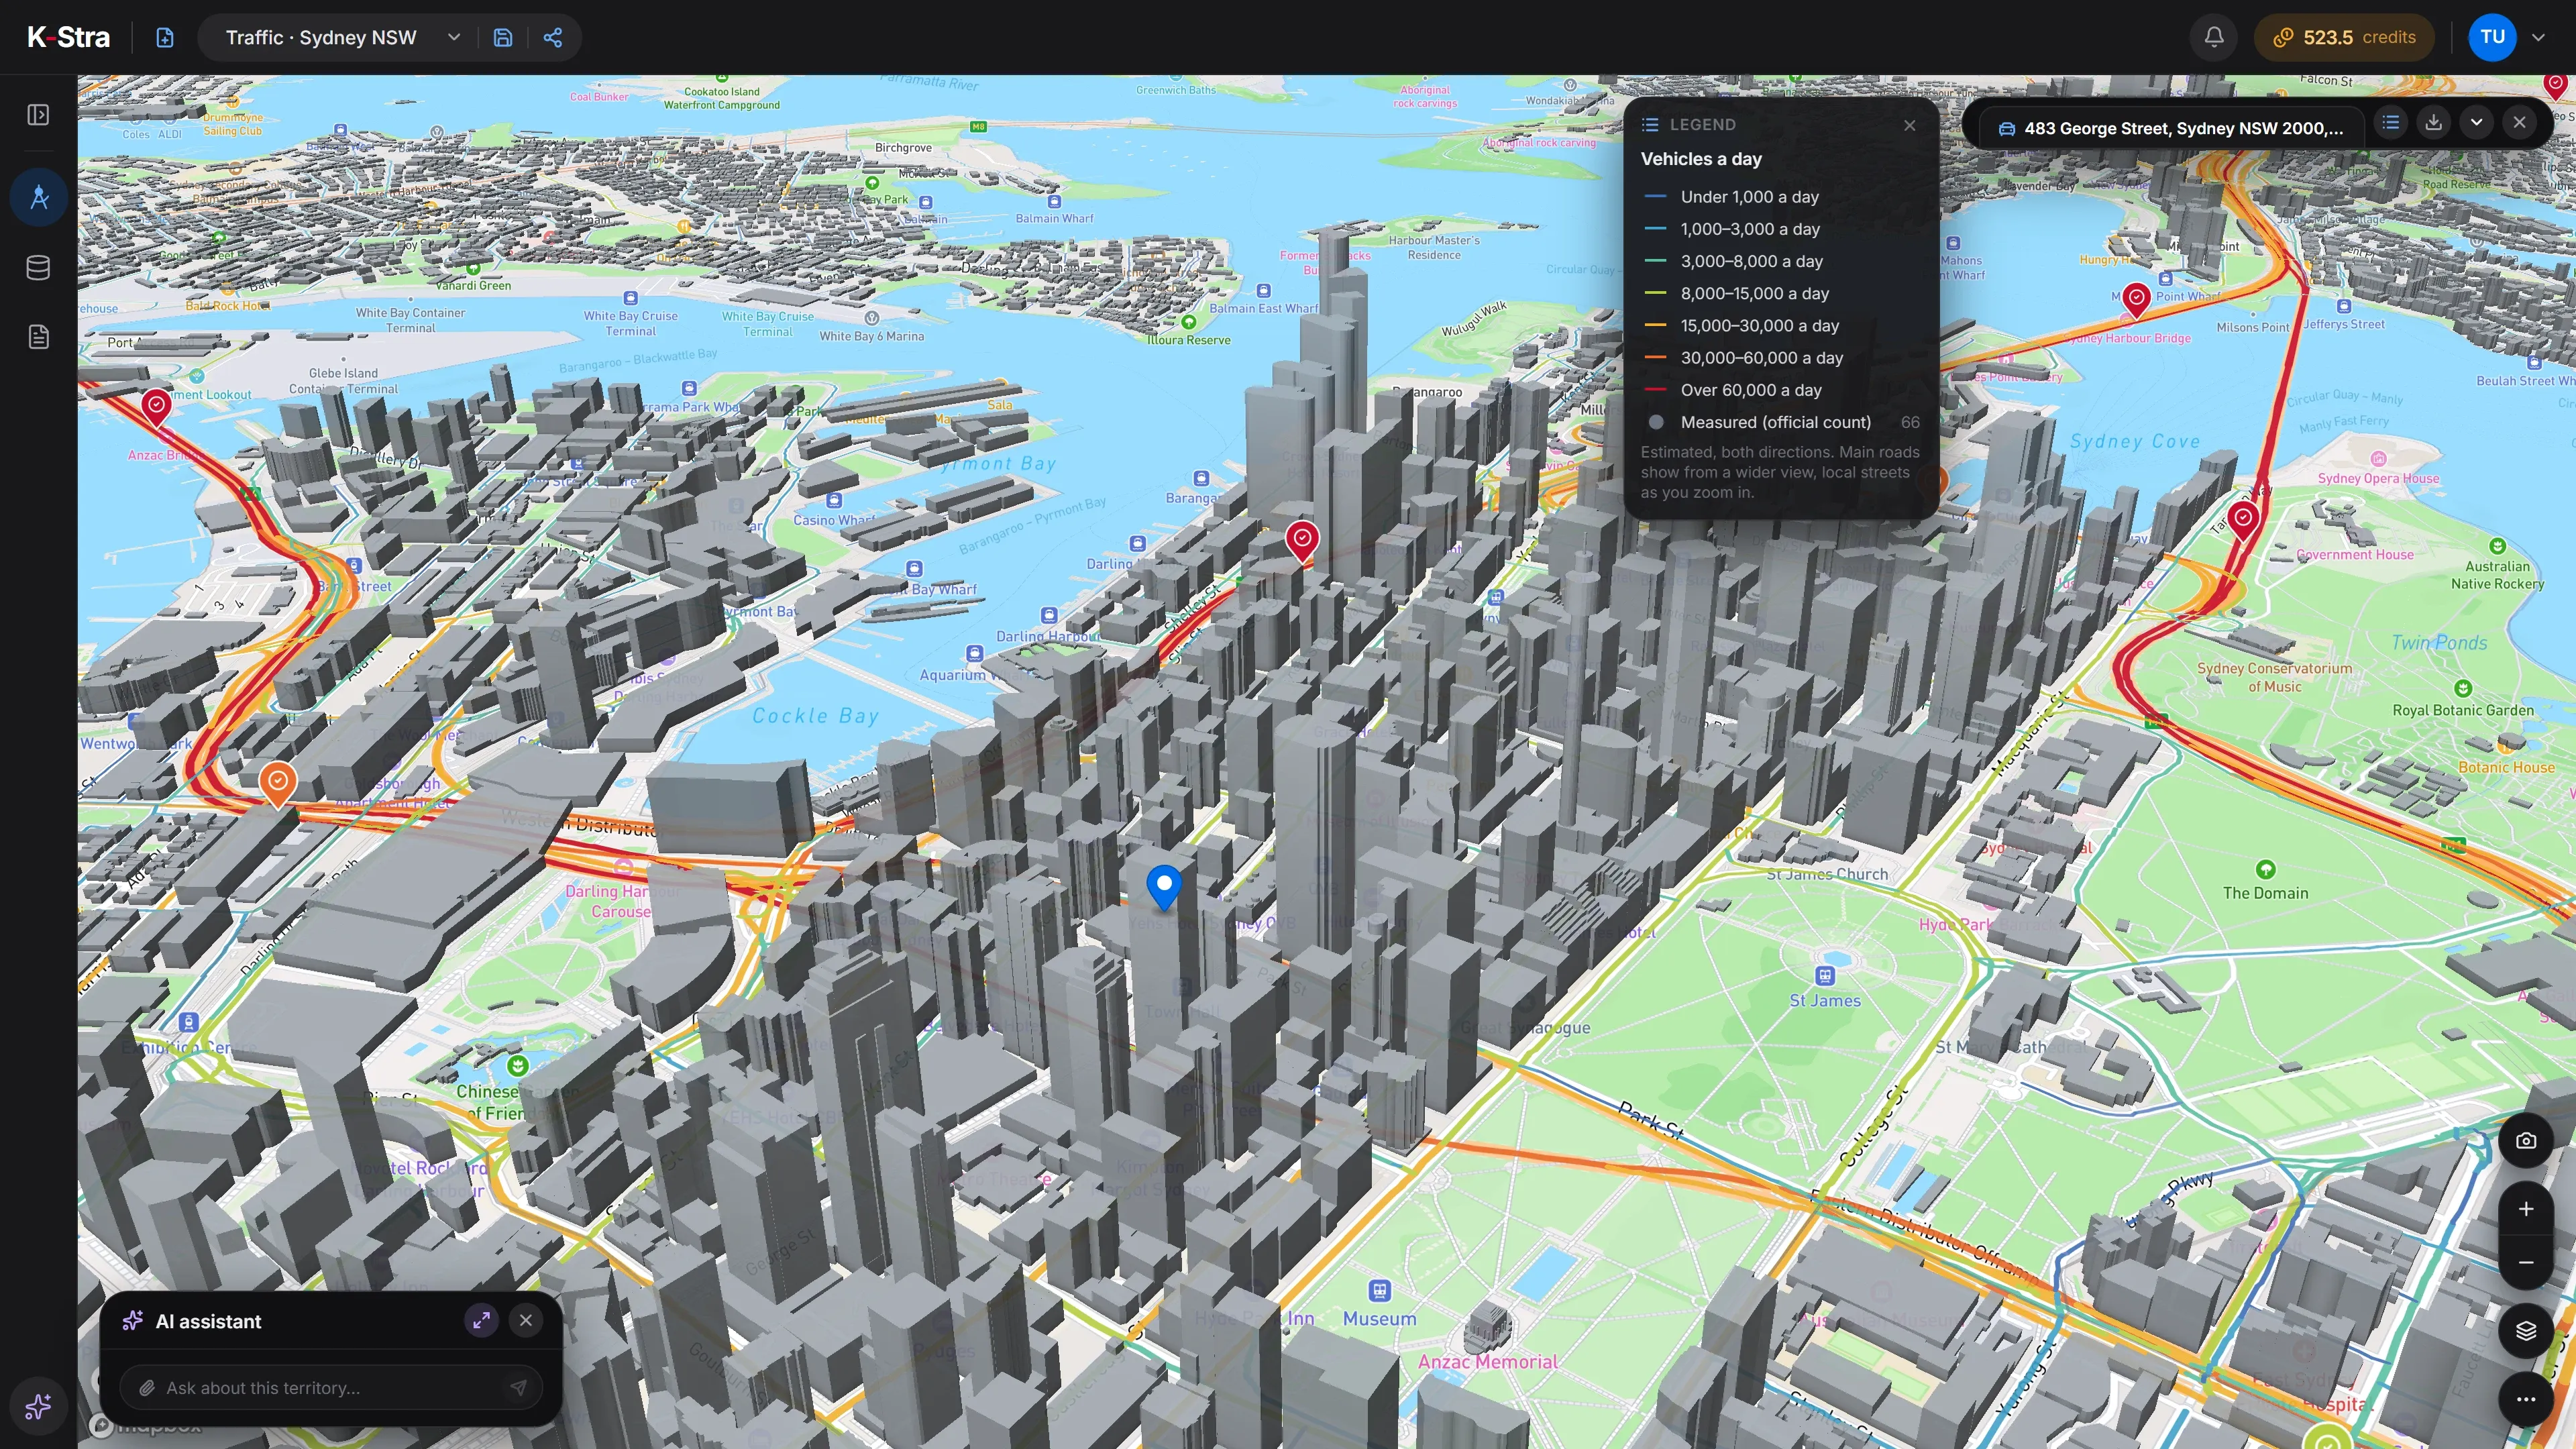 Vehicles a day
How many vehicles a day pass the roads of central Sydney?
Within 15 minutes by car in average traffic of 483 George Street, Sydney, 2,682 km of roads. 1,550 km carry under 3,000 vehicles a day, and 260 km, fewer than one kilometre in ten, carry over 30,000: traffic gathers on the motorways and arterials.
| Vehicles a day | Road length (km) |
|---|---|
| Over 60,000 a day | 65 |
| 30,000–60,000 a day | 195 |
| 15,000–30,000 a day | 322 |
| 8,000–15,000 a day | 221 |
| 3,000–8,000 a day | 330 |
| 1,000–3,000 a day | 624 |
| Under 1,000 a day | 926 |
| Total | 2,682 |
Source: K-Stra analysis of 4 November 2026; K-Stra traffic estimates and 66 official traffic counts inside the area.
Does traffic on a road change by day, hour and month?
Yes, and a single yearly figure hides it. K-Stra turns the average day into a month, a type of day and an hour with the typical profile of each type of road, so a street can be read at 8 am on a weekday or on a Saturday afternoon.
A range of days or hours shows its average day or hour, and public holidays count as Sundays. School holidays and an hourly profile measured at one point are not part of the model yet.
Choosing a site with these numbers? Foot traffic analysis explains how to read passing traffic next to residents and competitors.
How much does it cost to see the traffic of an area?
The price does not change with the size of the area or the period: 30 credits for the area, then every other day, hour and the pedestrians on it are free. The 40 credits of a free account cover the first area.
- Traffic & Footfall on one area30 credits per area, any size30 credits
- Other days, hours and pedestrians on the same areaFree
- Map, area dashboards and exportsFree
Before you confirm, the app shows the price and your balance after the run. A failed run charges nothing.
What else do people ask about traffic counts and foot traffic?
Where can I find traffic counts for an Australian road?
State road agencies and some councils publish counts for the roads they measure, mostly main roads, often a few years apart. In K-Stra they appear on the map as measured, with their year, next to an estimate for every other road. The area within 15 minutes by car in average traffic of 483 George Street, Sydney holds 66 of them.
Is traffic count data free in Australia?
The counts published by state road agencies are usually free open data, for the roads and the years they cover. K-Stra shows them on the map next to an estimate for every other road: an area costs 30 credits, and other days, hours and the pedestrians on it are then free.
Where can I get foot traffic data in Australia?
A few city councils publish hourly counts from pedestrian counters, almost all in central areas. For any other street K-Stra estimates foot traffic as a grade from very low to very high, calibrated on counters in Melbourne, Brisbane, Casey and Sydney. It comes from a model of trips on the street network, not from tracking phones, and it is passing traffic, not visits to a store.
Is K-Stra a people counter?
No. A people counter is a sensor at a door or on a footpath that counts the people who actually pass it. K-Stra installs nothing: it estimates foot traffic on every street, calibrated on the counters cities already run, so streets can be compared before a store exists. Once a store is open, a door counter measures the people who walk in.
How accurate are the estimates?
Estimates are given in bands. They are closest on main roads and wider on local streets and motorways; a measured count, where there is one, always comes first. That is why K-Stra gives bands, such as 8,000–15,000 vehicles a day, and never a single number.
Is pedestrian footfall available outside the city centres?
Yes: every street, footpath and pedestrian way has a grade from very low to very high. The model is calibrated on pedestrian counters in Melbourne, Brisbane, Casey and Sydney, so it is closest in busy centres like those.
Does traffic tell me how many customers a store will get?
No. Footfall is the number of people passing along the street, not walking through the door, and vehicles are passing traffic. Read them next to who lives within reach and who already competes there.
See who passes by,
not only who lives nearby.
Draw an area anywhere in Australia, choose vehicles or pedestrians and a day. 30 credits for the area, then other periods are free.
Open the app — free to explore40 credits when you sign up · no card required