
How can a retail marketing team see where its customers come from?
Your loyalty programme already knows where customers live. Put it on a map and it tells you where to spend the next campaign, and where the gaps are.
A retail marketing team sees where its customers come from by putting loyalty cards or sales on a map by postcode, without names, and reading which postcodes hold most of the customers, how far they travel and who lives in the areas they come from. The same map shows where to aim campaigns and where customers are few.
What does a marketing team want from a customer map?
Where do my customers live?
Customers or cards by postcode, the share each area holds and how far it is from the store.
Customer mappingHow loyal are they, and to which store?
Card spending by store and postcode, customers shared between stores and the share of local spending each earns.
Loyalty card analysisWho lives in my best areas?
Age, income, households and spending of the residents of the postcodes that matter most.
Demographic analysisWhere is the catchment of each store?
The area that holds most of a store’s customers, compared with the drive time around it.
Catchment area analysis
Why do campaigns miss the customers they are meant for?
Local campaigns are usually drawn as a radius around the store. Customers do not live in circles: they come along the roads they drive, from the suburbs where they work or shop, and rarely from across a river or a motorway.
The CRM holds the answer as a postcode on each card, but as a table it says little. On a map the pattern is obvious: a few postcodes carry most of the business, and some close ones carry almost none.
Those quiet postcodes are the interesting part. Next to the residents and spending of each area, they show where the store is unknown rather than where there is nobody to sell to.
What does K-Stra give a marketing team?
Your cards on the map
Import loyalty data with a postcode or suburb per card, without names; K-Stra places it on the areas.
Your own dataCustomer Loyalty
Catchment, penetration, market share and how spending falls with distance, at 20 credits a store.
Loyalty card analysisWho lives there
The ABS profile of any set of postcodes: age, income, spending and housing.
Demographic analysisLists for campaigns
Postcode tables to Excel and CSV, areas to KML and maps to an image, always free.
Free exports
K-Stra runs on a dedicated server in Sydney: your datasets, your analyses and your results stay in Australia. Map tiles, payments and sign-in never see your files. Three steps can: geocoding sends only the address text, and only after you confirm; the AI assistant reads column names and values when you ask it about a dataset; email notifications carry figures from your analysis.Where your data lives. Mark a dataset “session only” and it is deleted 24 hours after upload.
How many postcodes does a store really depend on?
A sample garden centre in Robina, Gold Coast QLD has 1,794 loyalty cards with a year of purchases, from November 2025 to October 2026. Each card carries only a suburb and a postcode. On the map, 20 postcodes hold the cards, with 711,246 residents between them.
Sorted by share, the first four postcodes hold 49.4% of the cards and the first eight 80.1%. The full catchment reading, including the 1.6% of cards from across the New South Wales border, is on the customer mapping page.
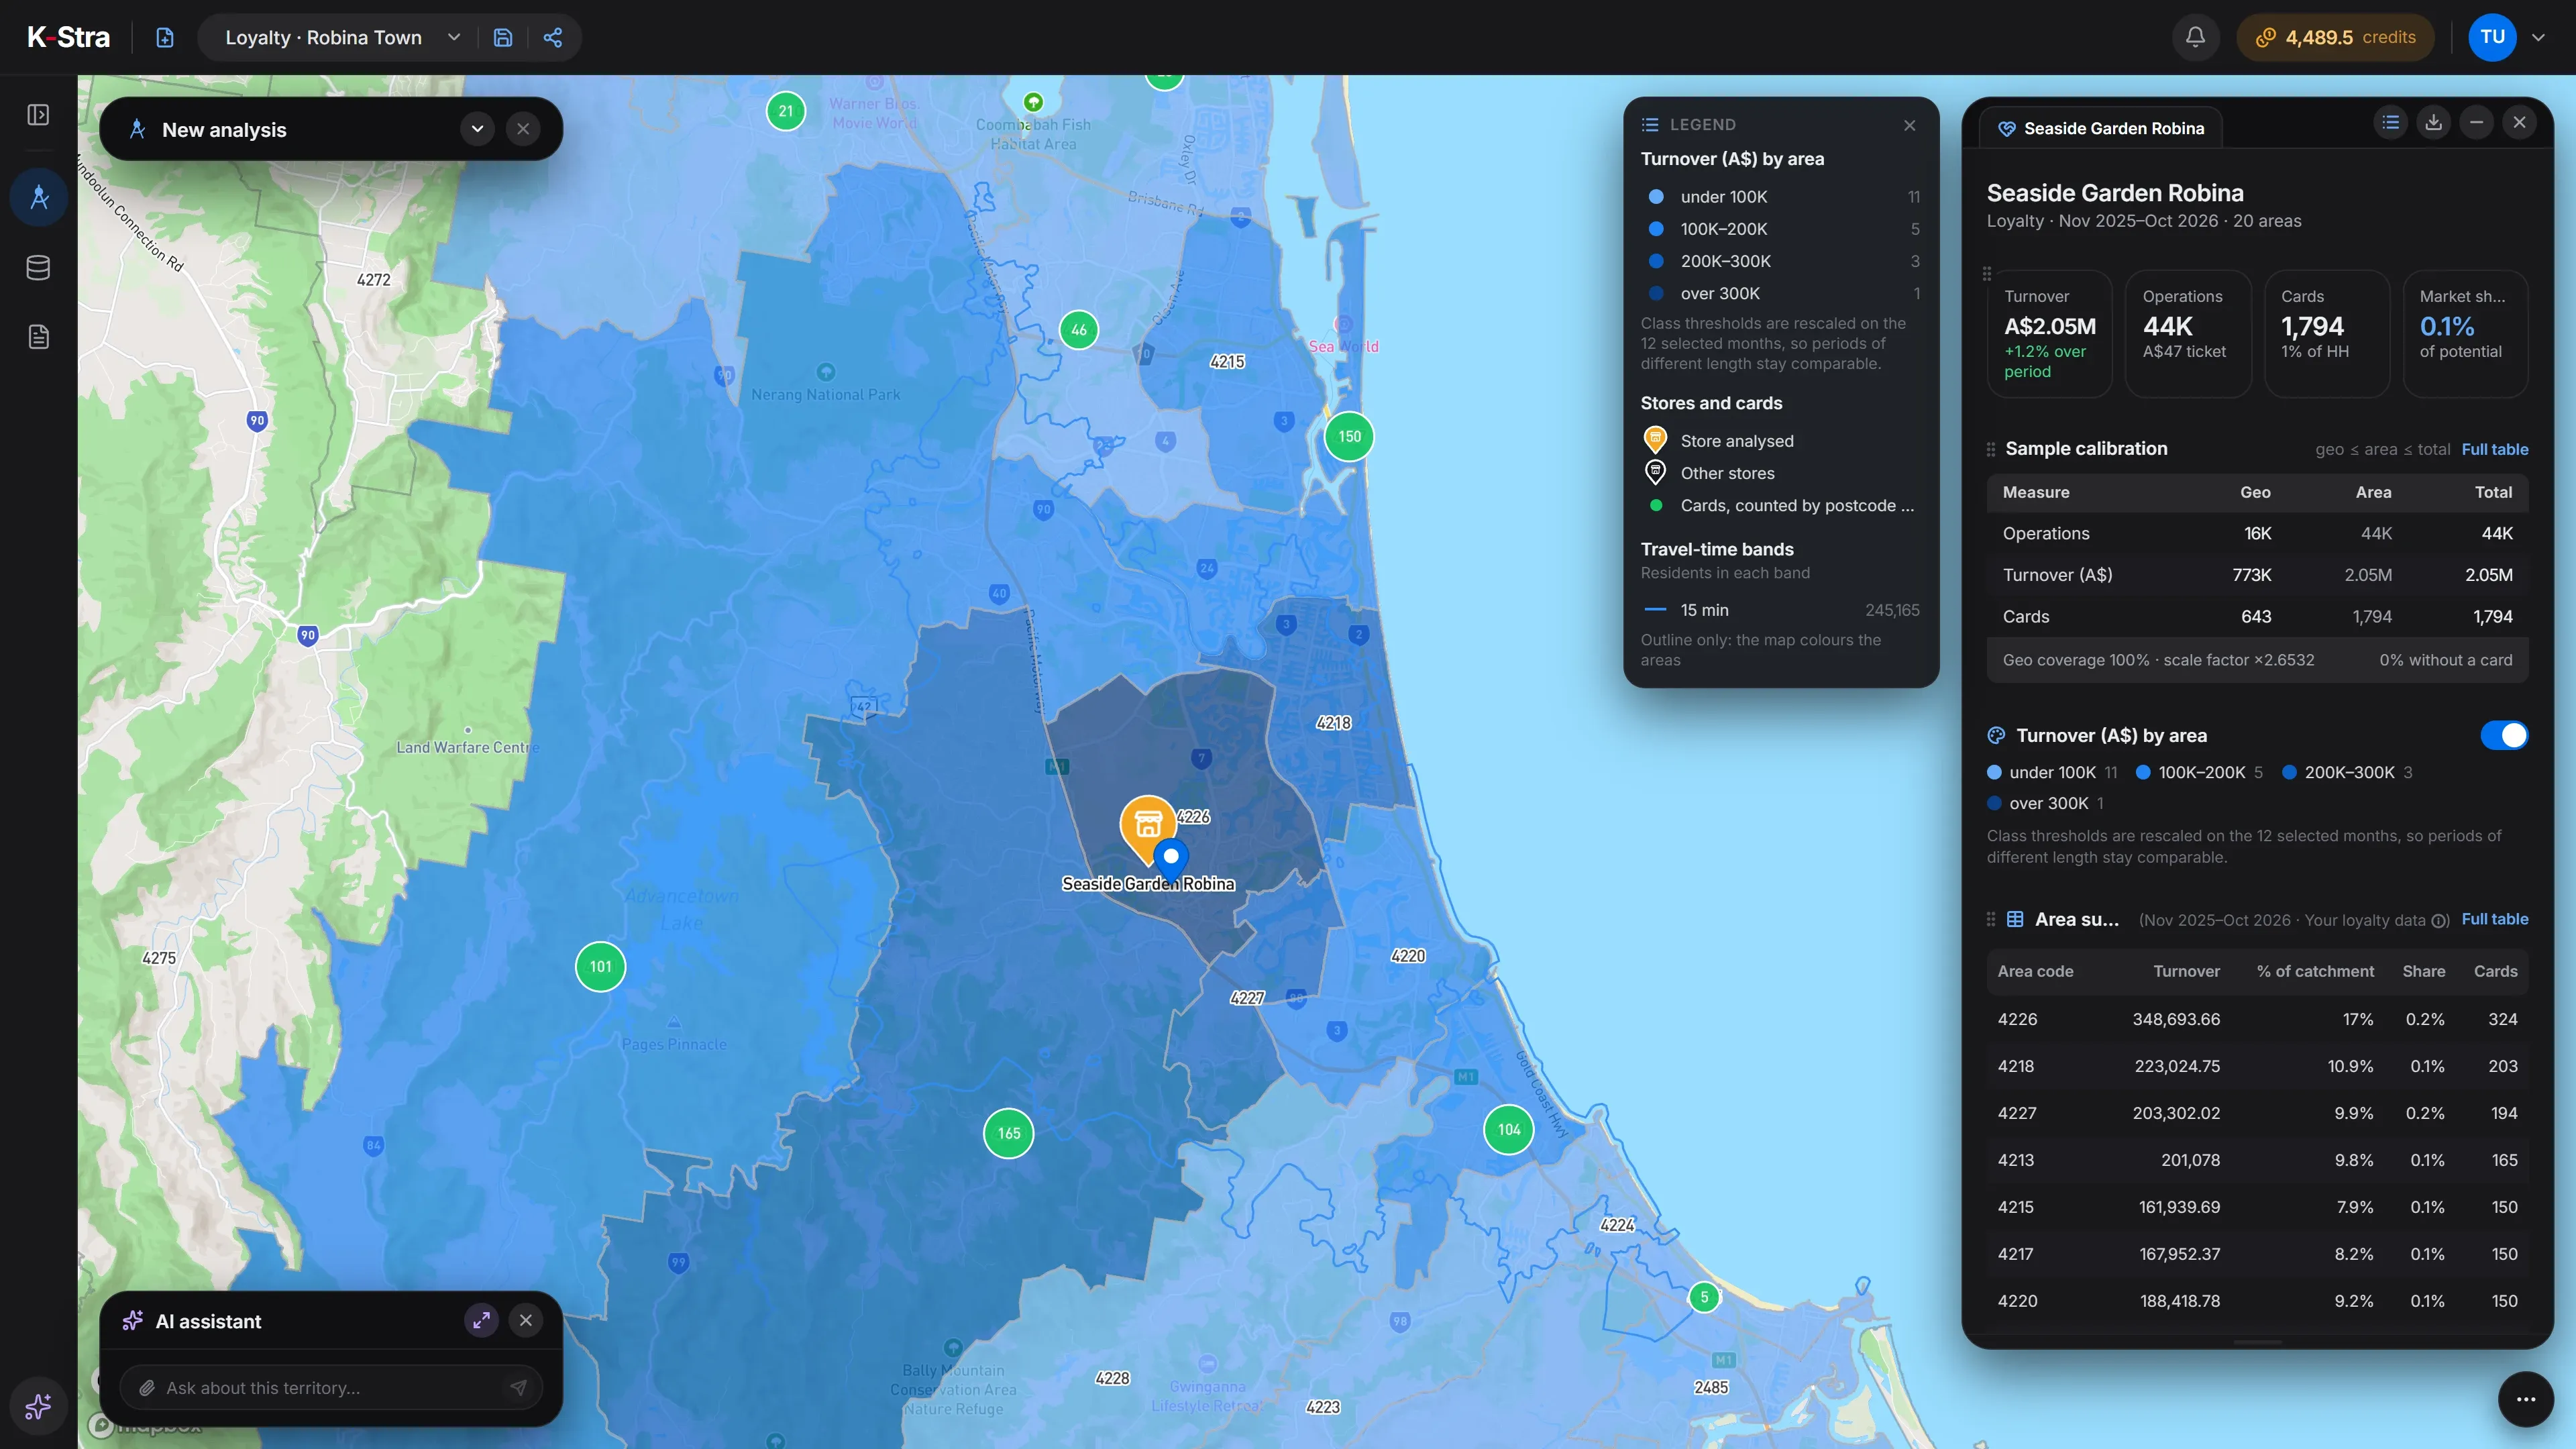 Customers · Gold Coast
Which postcodes should a campaign cover?
The eight postcodes with most cards of the sample store, in order, with each one’s share of all 1,794 cards and the running total.
| Postcode | Suburb | Cards | Share of cards | Cumulative share |
|---|---|---|---|---|
| 4226 | Robina | 324 | 18.1% | 18.1% |
| 4218 | Broadbeach | 203 | 11.3% | 29.4% |
| 4227 | Varsity Lakes | 194 | 10.8% | 40.2% |
| 4213 | Mudgeeraba | 165 | 9.2% | 49.4% |
| 4220 | Burleigh Heads | 150 | 8.4% | 57.7% |
| 4217 | Surfers Paradise | 150 | 8.4% | 66.1% |
| 4215 | Southport | 150 | 8.4% | 74.5% |
| 4211 | Nerang | 101 | 5.6% | 80.1% |
Sources: 1,794 fictional loyalty cards in a K-Stra sample account, with suburb and postcode only; residents from ABS population estimates at 30 June 2025. K-Stra Customer Loyalty of 1 November 2026.
What would a marketer do with this?
A letterbox or digital campaign on the first eight postcodes reaches the areas that hold about four cards in five, instead of a radius that would spend half its budget on the hinterland. That is the efficient half of the plan.
The other half is the gaps. Postcodes close to the store with few cards, set against their residents and income, are where the store is not yet known. A profile of those residents tells the team what message to send them.
How much does a customer map cost?
Once the card file is in, each further store or period of the programme is a new run at 20 credits, with no new import.
- Customer Loyalty for the store20 credits per store analysed20 credits
- Import of the card file1 credit per 10,000 rows2 credits
- Maps, tables, KML and Excel exportsFree
- This customer map= 22 credits
- ≈ A$34 at the Single report pack rate of A$1.53 a credit; less with larger packs and monthly plans. A new free account’s 40 welcome credits cover it.
Optional, not in the total
- People & Economy on the target postcodesper topic+ 2 credits
The cost appears before anything runs; a failed run costs nothing, and an interrupted import pays only for the rows already loaded.
What else do marketing teams ask?
What customer data do I need to upload?
An anonymised customer code, the postcode or suburb, and the amounts and visits by period. Names, contact details, card numbers that can be linked to a person and the street addresses of private individuals are not needed and should not be uploaded: K-Stra works on areas, not on people.
Can I see the profile of the people in my best postcodes?
Yes. Run People & Economy on the same postcodes: residents, age, income, spending and housing from ABS data, at 2 credits a topic, whatever the size of the area.
Can I export the postcodes for a campaign?
Yes. Every table exports to Excel or CSV and the areas to KML, for free, so the list of target postcodes can go straight to a letterbox, digital or outdoor campaign.
What is a store’s market share in K-Stra?
For loyalty data, the card spending in each postcode divided by what its residents spend on the category, from ABS household spending. It covers card holders only, so it is a floor, and it makes sense only where the category matches the store.
Can my uploaded data be deleted automatically?
Yes: a dataset marked “session only” disappears 24 hours after it is loaded. Saved datasets stay in your account until you delete them.
Put your customers
on the map.
Load your cards by postcode, without names, and see where the business comes from and where it doesn't.
Open the app — free to exploreExploring the map is free; you pay only for the analyses you run