
How do I decide which stores to open and which to close?
A store’s own figures say how it trades, not what the network would lose without it. Measuring the stores together answers the question that matters.
Store network planning means deciding where a chain should open, keep or close stores by measuring them together rather than one at a time. Draw the same drive-time catchment around every store, count the residents each reaches on its own, then rank closures by the residents they would leave uncovered and openings by the new residents they would add.
Why is it hard to judge one store of a network on its own?
A store with modest numbers may serve residents no other store of yours can reach, and a busy one may sit inside the catchments of two others. Its own report cannot tell the two cases apart.
The answer also changes as you act. Close one store and its shared customers move to a neighbour, which then becomes harder to close. Open one and the stores beside it lose part of their reach.
So the useful output is not a score per store but an order: which closure costs the least, which opening adds the most, measured again after every step.
of the resident spending two planned stores would capture in the Brisbane example comes from the chain’s own stores, not from the rest of the market.
K-Stra Coverage of 1 November 2026 on a sample network of 10 stores: A$8.4 million of A$38.84 million a year of modelled spending of the catchment residents; ABS population 2025.
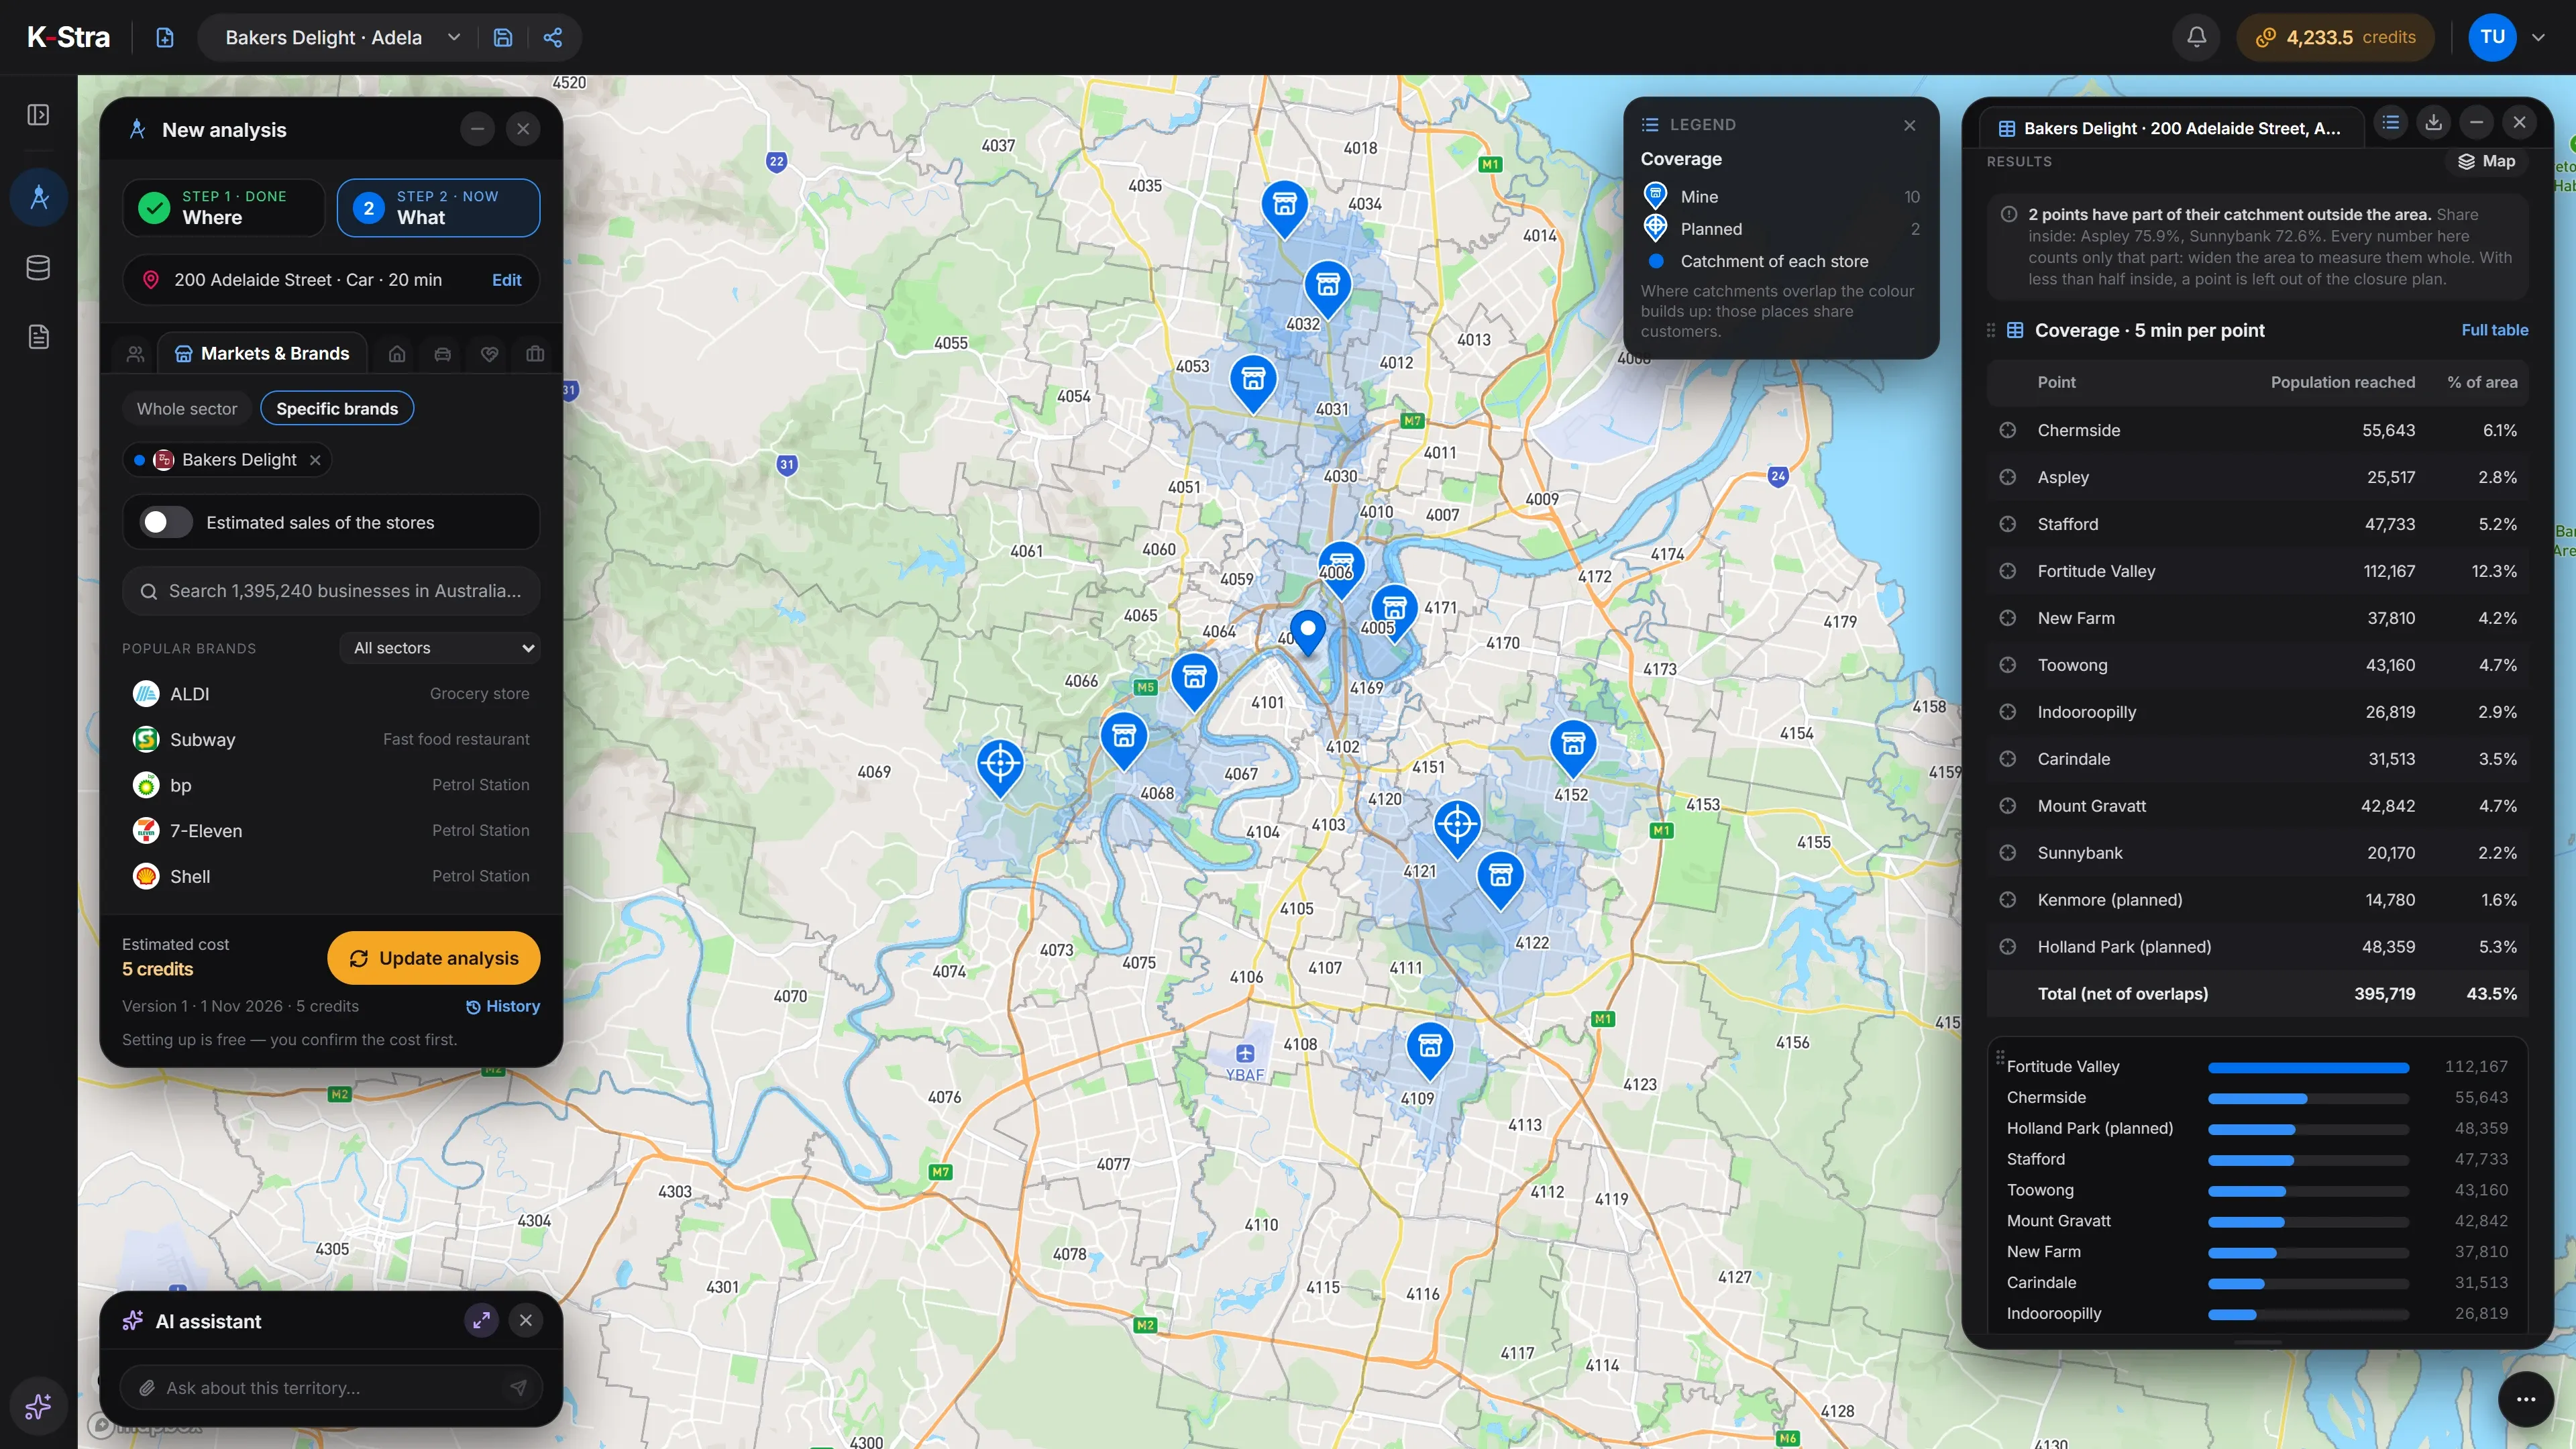 Sample data · Brisbane
How do you plan a store network, step by step?
List every store
Open stores and candidate sites, each with coordinates or an address of the place.
Use one catchment for all
The same drive time around every store, so a store on a motorway and one on a busy strip are measured the same way.
Count what each store holds alone
For each store, the residents no other store of yours reaches. That is what you would lose by closing it.
Rank the closures
Close, on paper, the store whose loss leaves the fewest residents uncovered; measure again on the stores left; repeat.
Rank the openings
Open, on paper, the candidate that adds the most residents none of your stores reaches; measure again; repeat.
Check what each opening takes from you
A candidate that adds many residents can still draw heavily on a store you already have nearby.
Decide, then measure again
Keep the plan as a sequence, not a list: every change moves the numbers of the stores around it.
What data do you need to plan a store network?
A list of your stores and the sites you are considering. Population, spending and the road network come with the analysis.
Your stores
A CSV or Excel file with a code, a name and coordinates or the address of each store.
File formats and limitsCandidate sites
Points dropped on the map, or rows of the same file, marked as planned rather than existing.
Retail site selectionResidents on the road network
ABS population estimates at 30 June 2025, counted once even when several catchments reach them.
Population dataResident spending by sector
Household spending of the residents, to see how a new store would share it with the stores around it.
Income and spending data
K-Stra runs on a dedicated server in Sydney: your datasets, your analyses and your results stay in Australia. Map tiles, payments and sign-in never see your files. Three steps can: geocoding sends only the address text, and only after you confirm; the AI assistant reads column names and values when you ask it about a dataset; email notifications carry figures from your analysis.Where your data lives. Mark a dataset “session only” and it is deleted 24 hours after upload.
How do you plan a network in K-Stra?
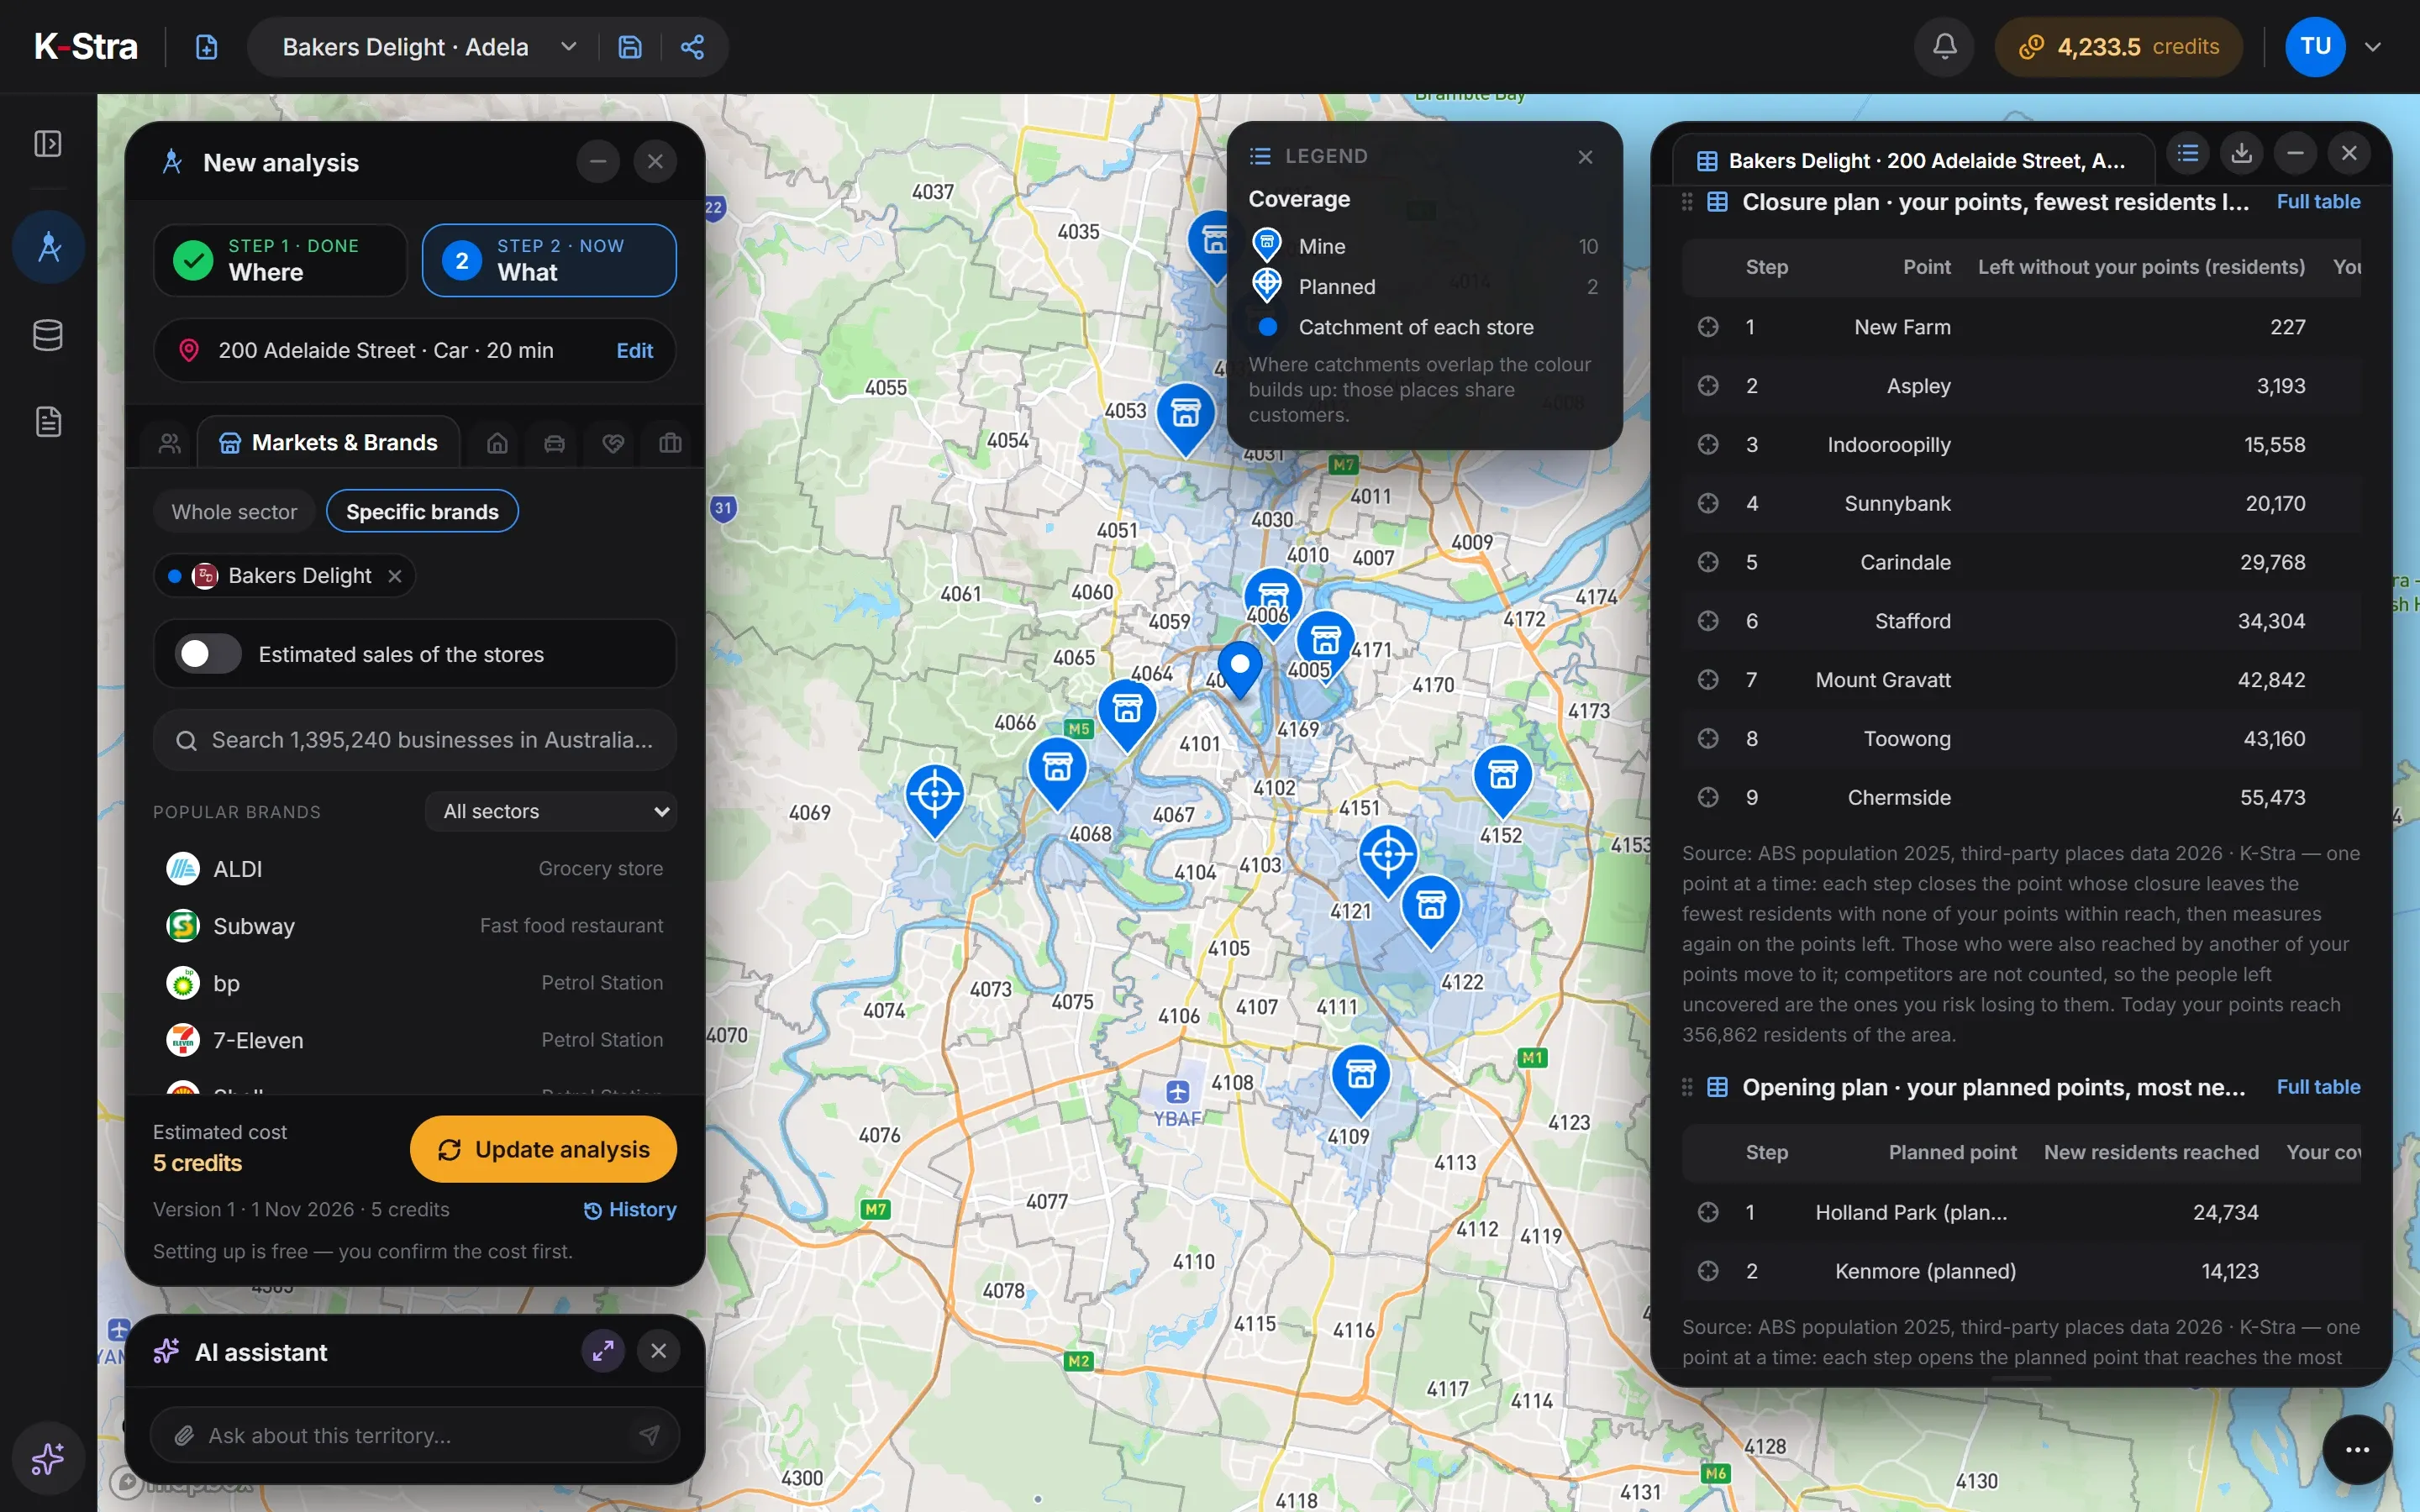
Coverage reads the whole network at once. Each point is yours or a competitor’s, existing or planned, and the results come in four tables.
- Add the networkFrom a Markets & Brands analysis, open Coverage and add your stores from My Data or by clicking the map. 5 credits per store or candidate.
- Mark each pointExisting or planned, yours or a competitor’s. Choose the minutes of the catchment, up to 30.
- Closure planYour stores in the order that loses the fewest residents, with the coverage left after each step.
- Opening planYour planned sites in the order that adds the most new residents, and what each would take from the stores you already have.
Coverage also models how much of the catchment residents’ spending each point would capture, and from whom. It is a model on residents only, built to compare sites of the same sector in the same area: read the size as an order of magnitude.
What does a closure plan look like in numbers?
A sample chain of 10 bakery-cafés in Brisbane QLD, each with a 5-minute catchment by car, inside an area of 909,837 residents. Today the network reaches 356,862 of them, 39.2%. The closure plan removes one store at a time, always the one whose loss leaves the fewest residents with none of the chain’s stores in reach.
| Store | Residents reached | Shared with own stores | Closure step | Left uncovered at that step |
|---|---|---|---|---|
| New Farm | 37,810 | 99.4% | 1 | 227 |
| Aspley | 25,517 | 87.5% | 2 | 3,193 |
| Indooroopilly | 26,819 | 44.4% | 3 | 15,558 |
| Sunnybank | 20,170 | 0% | 4 | 20,170 |
| Carindale | 31,513 | 5.8% | 5 | 29,768 |
| Stafford | 47,733 | 28.1% | 6 | 34,304 |
| Mount Gravatt | 42,842 | 59% | 7 | 42,842 |
| Toowong | 43,160 | 26.1% | 8 | 43,160 |
| Chermside | 55,643 | 59.3% | 9 | 55,473 |
| Fortitude Valley | 112,167 | 35.4% | last | — |
Sources: sample store network of a fictional chain in a K-Stra sample account; ABS population at 30 June 2025; K-Stra Coverage of 1 November 2026, 5 minutes by car per store. Aspley has 75.9% and Sunnybank has 72.6% of its catchment inside the area: its figures count only that part.
What does the plan say about the Brisbane network?
New Farm is the first candidate for closure: 99.4% of its residents are also within 5 minutes of another store, mostly Fortitude Valley, and closing it would leave 227 people uncovered. Aspley follows, in the shadow of Chermside.
Sunnybank comes fourth although it shares no residents with any other store. The reason is size: its 20,170 residents are all its own, and three closures leave fewer people behind. Neither result is a verdict on the stores; it is where to look first.
Of the two planned sites, Holland Park adds the most new residents, 24,734, and Kenmore 14,123. But Holland Park sits close to Mount Gravatt: the model moves Mount Gravatt from A$26.42 to A$18.24 million a year of captured spending, −31%.
Kenmore reaches fewer people but barely touches the network: Indooroopilly, the nearest store, changes by −1.6%. Together the two sites would capture A$38.84 million a year of residents’ spending, A$8.4 million of it from the chain’s own stores and A$30.44 million from the rest of the market.
The chain and its stores are invented for this example and loaded into a K-Stra sample account; suburbs, population and spending are real. Captured spending is a model of the spending of the residents only, on the bars-and-cafés spending model: workers, commuters and visitors are not in it, so stores near the centre, such as Fortitude Valley, come out underestimated.
How much does it cost to plan a store network?
Coverage is priced per point, yours or a competitor’s, existing or planned. The closure plan, the opening plan and the captured spending come in the same run, at no extra cost.
Stores without coordinates are geocoded at 1.5 credits per 1,000 addresses, charged when the run ends; a run you stop pays only for the addresses already processed.
- Markets & Brands, one brand5 credits per brand · any brand, to frame the area5 credits
- Coverage, 10 stores and 2 planned sites5 credits per store or candidate60 credits
- Store file import1 credit per 10,000 rows1 credit
- Map, closure and opening plans, exportsFree
- This network plan= 66 credits
- ≈ A$101 at the Single report pack rate of A$1.53 a credit; less with larger packs and monthly plans.
The app quotes each step first and runs nothing until you confirm; a failed run costs nothing.
What else do people ask about store network planning?
What is the difference between store network planning and cannibalisation analysis?
Cannibalisation analysis measures how much your stores overlap. Network planning uses that overlap to decide: which store could close with the least loss, which candidate would add the most, and in what order.
Why rank closures one store at a time?
Because every closure changes the others. Once a store closes, the residents it shared move to a neighbour, which then holds more on its own. Measuring again after each step gives an order that holds up, rather than a ranking that is only true for the first store.
Does a closure plan count the competitors?
No. It counts the residents left with none of your stores within reach. Those are the people you risk losing to a competitor, which is why the result reads as a risk, not as lost sales.
Can I test a site before signing a lease?
Yes. Drop a point on the map and mark it as planned. The analysis shows the new residents it would add, the resident spending it would capture and how much of that it would take from your existing stores.
What does captured spending measure, and what does it leave out?
It is the potential spending of the catchment’s residents that a site would capture: a figure for comparing sites of the same sector and area, whose absolute value is an order of magnitude. Workers, commuters, tourists and passing trade are not in it, so CBD, tourist and station sites come out underestimated.
Open, keep or close
on measured numbers.
Load your stores, add the sites you are weighing and see the order that loses least and adds most.
Open the app — free to exploreCoverage 5 credits per store, after you confirm the estimate