
How does K-Stra measure income and spending in an area?
Whether people can afford what you sell matters as much as how many there are. These are the figures K-Stra uses to tell, and their limits.
K-Stra measures income with an index where 100 is the Australian average, built from ABS personal income tax data for 2022–23 and measured in 543 councils and 2,405 SA2 areas. Spending per resident in 13 categories follows from that index and the national accounts for 2024–25; employment comes from the 2021 Census.
Which work and income variables are there?
Seven variables in three topics of People & Economy: Employment, Income and Spending. Each topic costs 2 credits.
| Variable | Source | Reference period | Measured at |
|---|---|---|---|
| Labour force, employed, unemployed and not in the labour force (aged 15 and over)Employment | ABS Census 2021 | Census 2021 | SA1, spread onto addresses |
| Participation, employment and unemployment rates; employed per 100 residents aged 15 and overEmployment | ABS Census 2021 | Census 2021 | Derived |
| Income index, where 100 is the Australian averageIncome | ABS Personal Income · K-Stra model | 2022–23 financial year | Measured in 543 councils and 2,405 SA2 areas, modelled elsewhere |
| Consumption index and consumption per head in A$ a yearIncome | ABS Personal Income · ABS National Accounts | 2022–23 income, 2024–25 spending | Derived from the income index |
| Income index by travel-time band, against the catchment and AustraliaIncome | ABS Personal Income | 2022–23 financial year | Address |
| Household spending in 13 categories: per head, total in A$ a year and shareSpending | ABS National Accounts | 2024–25 financial year | Area consumption index × national coefficients |
| Potential market by travel-time band, in A$ a yearSpending | ABS National Accounts · ABS population estimates | 2024–25 spending, 2025 residents | Address |
Where is income measured, and where is it estimated?
The ABS publishes personal income from tax returns for 543 councils and 2,405 SA2 areas. There the index is measured: each address takes the value of its SA2, and inside a council the addresses are told apart by the value of their properties.
Where the ABS publishes nothing, a K-Stra model estimates the index. The source note under every income table says both: measured where the ABS publishes it, estimated elsewhere.
Spending is different. No official source measures what households spend suburb by suburb, so K-Stra takes national spending per head in each category from the national accounts and scales it by the consumption index of the area.
The consumption index moves with income but less steeply: an area with 10% more income spends a little under 10% more. Employment rates come straight from the 2021 Census, the only source of work status for small areas.
What does spending look like around one address?
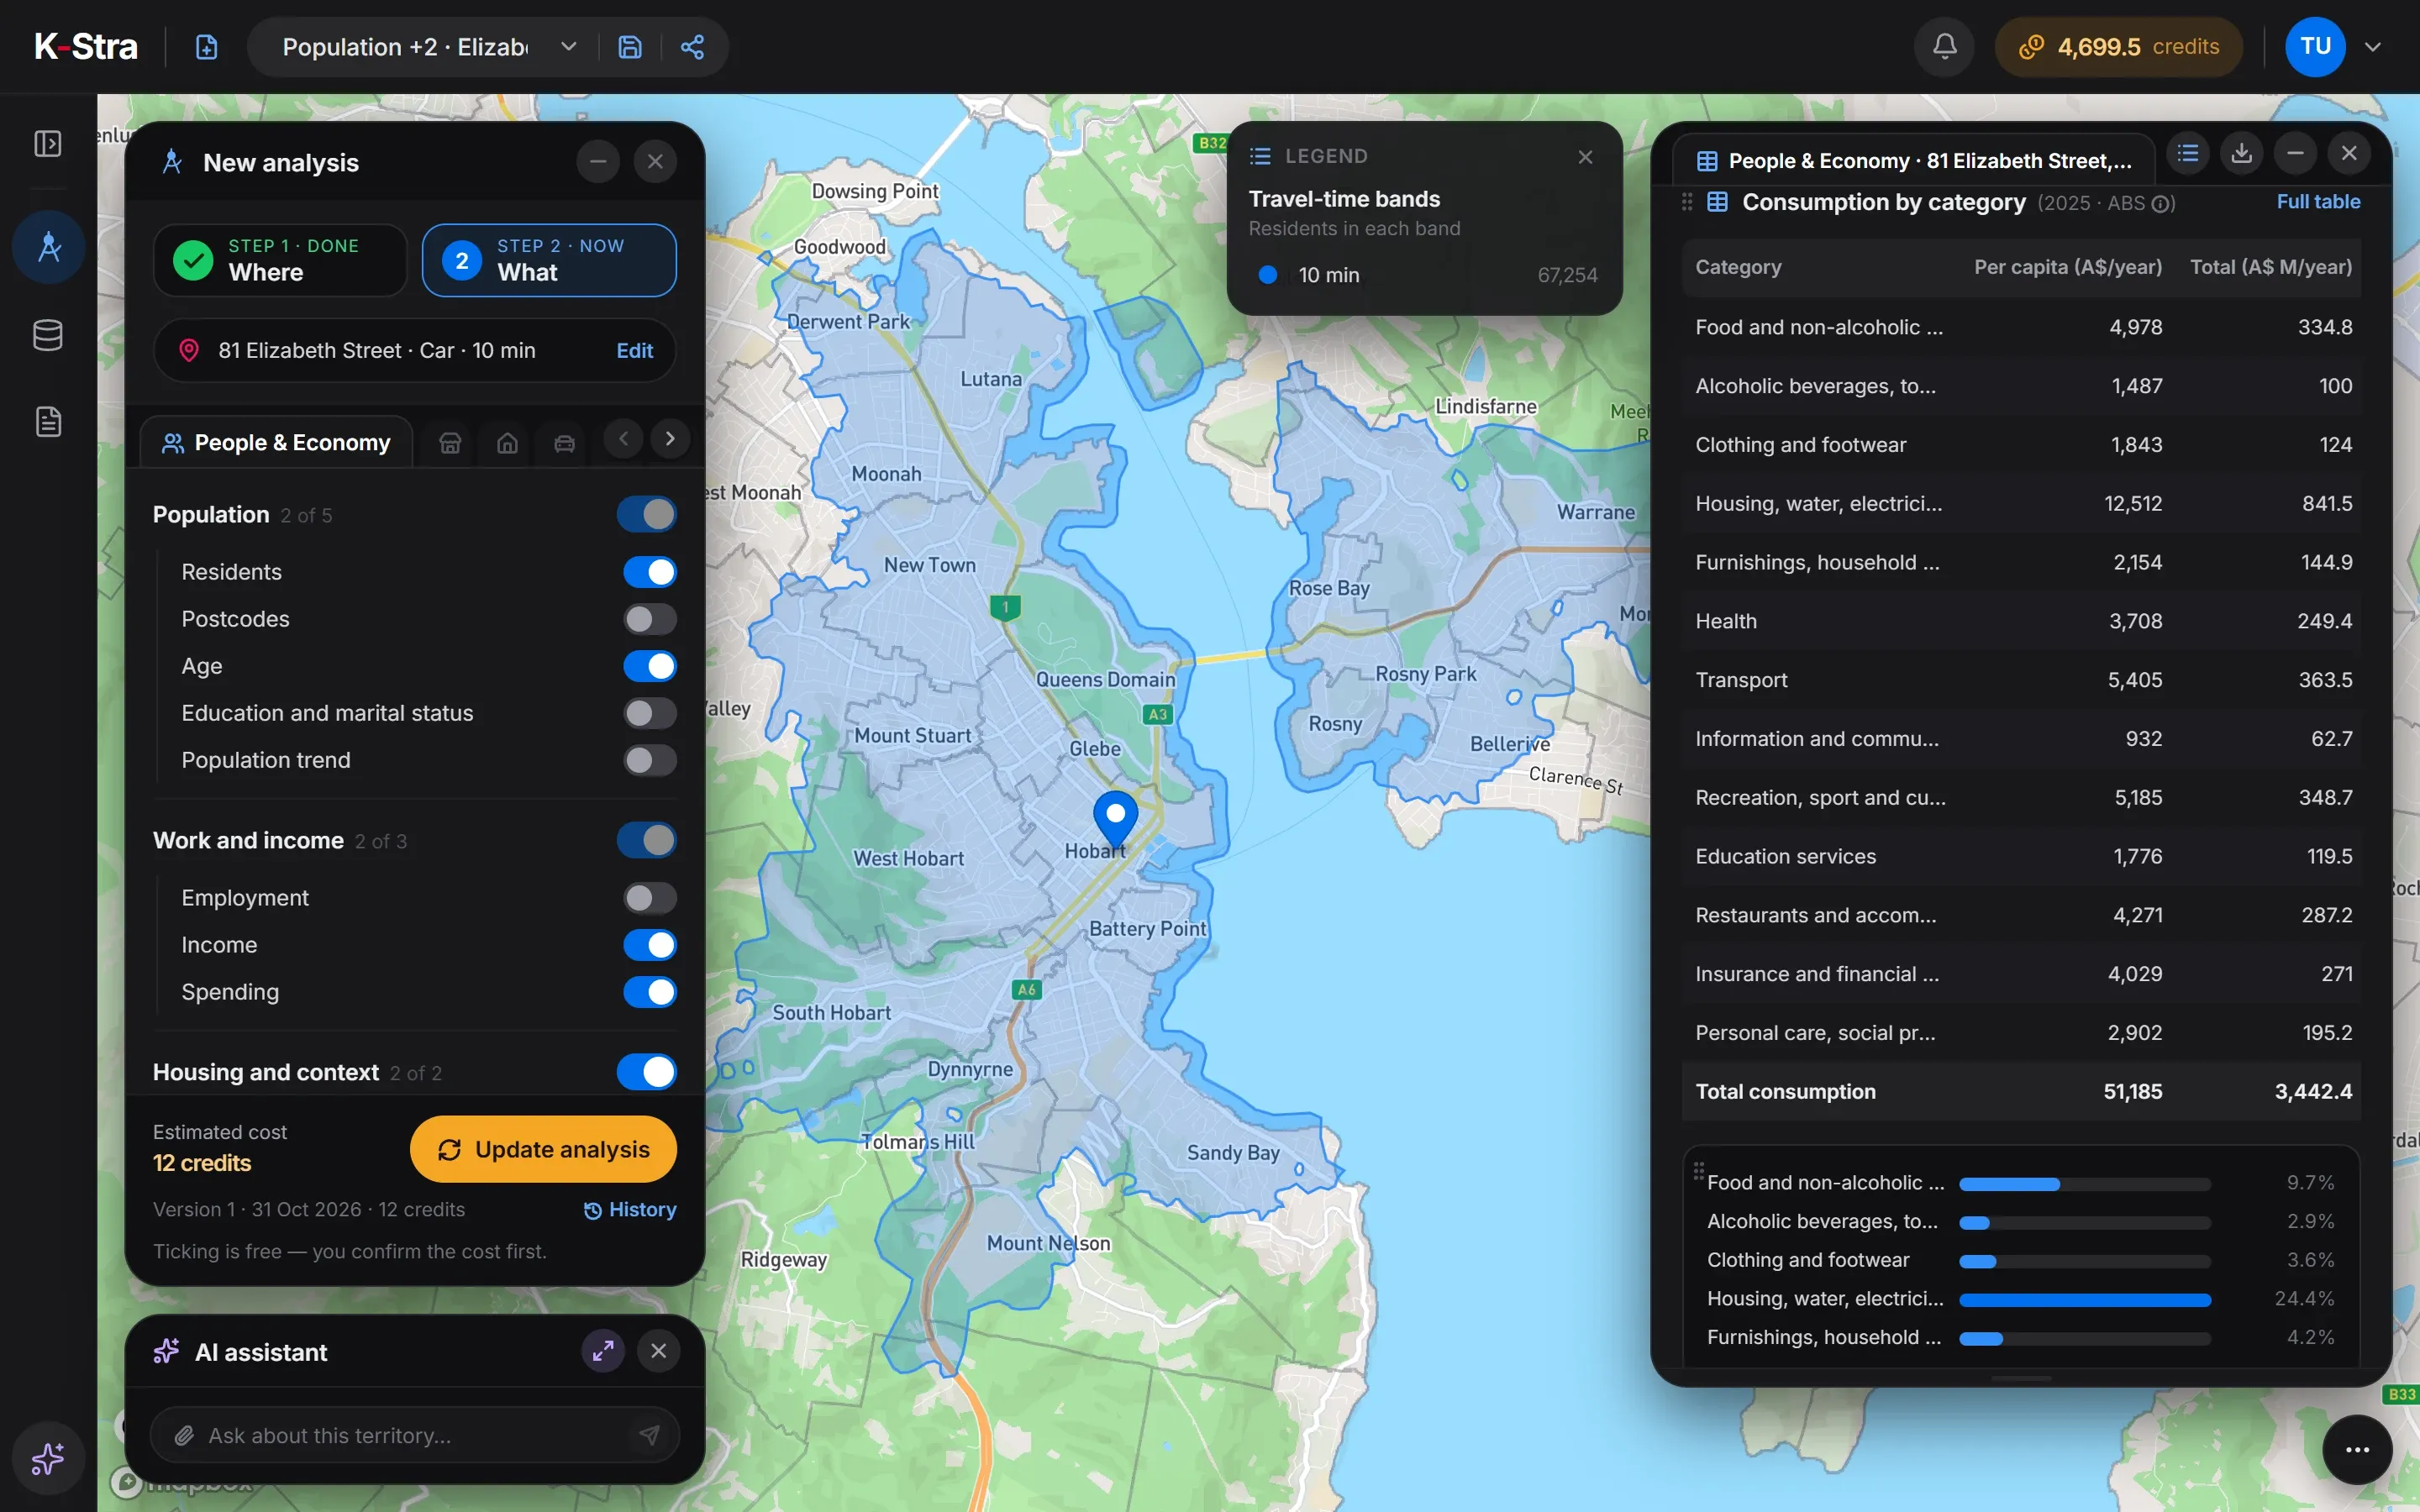 Hobart, TAS
Residents within 10 minutes of 81 Elizabeth Street, Hobart TAS spend about A$51,185 each a year, against A$52,583 for Australia, because their consumption index is 97.3. Together that is about A$3.44 billion a year.
| Category | A$ per head | Share |
|---|---|---|
| Housing, water, electricity, gas and other fuels | 12,512 | 24.4% |
| Transport | 5,405 | 10.6% |
| Recreation, sport and culture | 5,185 | 10.1% |
| Food and non-alcoholic beverages | 4,978 | 9.7% |
| Restaurants and accommodation services | 4,271 | 8.3% |
The 2021 Census adds work: 62.6% of residents aged 15 and over were in the labour force, and 7.1% of them unemployed, against 5.1% nationally.
Source: K-Stra analysis of 31 October 2026; ABS national accounts 2024–25, Personal Income 2022–23, Census 2021.
When are the income and spending sources updated?
| Source | Edition in K-Stra | Published | Next update of the source |
|---|---|---|---|
| ABS Census of Population and Housing 2021 | Census night, 10 August 2021 | 28 June 2022 | June 2027, first results of the 2026 Census |
| ABS Personal Income in Australia (tax data) | 2022–23 financial year | 14 November 2025 | 27 November 2026 (2023–24) |
| ABS Australian System of National Accounts (5204.0), household consumption | 2024–25 financial year | 24 October 2025 | Newer edition outThe 2025–26 edition came out on 23 October 2026 and is not loaded yet |
What else do people ask about income data?
Is the income index a salary in dollars?
No. It compares the income per resident of an area with the Australian average, set at 100. An index of 97.2 means about 3% less than average. K-Stra does not show incomes in dollars or by income band.
Why does spending follow income?
Because no survey measures household spending below the state: the last Household Expenditure Survey covers 2015–16. K-Stra derives a consumption index from income, rising less steeply than income, and multiplies it by national spending per head in each category.
How reliable is the income index where it is modelled?
Income is measured from tax data in 543 councils and 2,405 SA2 areas; only where no measured value exists is it modelled. Tested against the councils where income is measured, the model reaches a correlation of 0.49 and an average error of 10.3 index points: enough to tell a high-income area from a low-income one, not to separate two areas a few points apart. It is never used in place of a measured value.
When will the income figures be updated?
ABS Personal Income for 2023–24 is due on 27 November 2026. The national accounts for 2025–26 came out on 23 October 2026; K-Stra still uses 2024–25, and the data updates log will show when that changes.
See what an area
spends, and on what.
Switch on Income and Spending for any address or area and read the 13 categories.
Open the app — free to exploreDrawing the area is free