
Which housing data does K-Stra have?
Renters and owners, flats and houses, one car or three: the way people live shapes how they shop and how far they go.
K-Stra has three housing variables from the 2021 Census: tenure (owned, mortgaged, rented, social housing), dwelling type (house, townhouse, flat, buildings of four storeys or more) and cars per dwelling. A separate comparison puts sixteen indicators of an area beside its suburb, council, state and Australia, each with its own year.
Which housing variables are there?
Two topics of People & Economy: Housing, and Comparison with the surrounding areas. Each costs 2 credits; switching the comparison on and off afterwards is free.
| Variable | Source | Reference period | Measured at |
|---|---|---|---|
| Housing tenure: owned outright, with a mortgage, rented (social housing shown apart), otherHousing | ABS Census 2021 | Census 2021 | SA1, spread onto addresses |
| Dwelling type: separate house, semi-detached or townhouse, flat (4+ storeys shown apart), otherHousing | ABS Census 2021 | Census 2021 | SA1, spread onto addresses |
| Cars per dwelling: none, one, two, three or moreHousing | ABS Census 2021 | Census 2021 | SA1, spread onto addresses |
| Sixteen indicators for the area, its suburb, council, state and Australia side by sideComparison with the surrounding areas | ABS population estimates · ABS Census 2021 · ABS Personal Income | 2025, 2021 and 2022–23 by indicator | Address for the area; ABS areas for the references |
How different can housing be ten minutes apart?
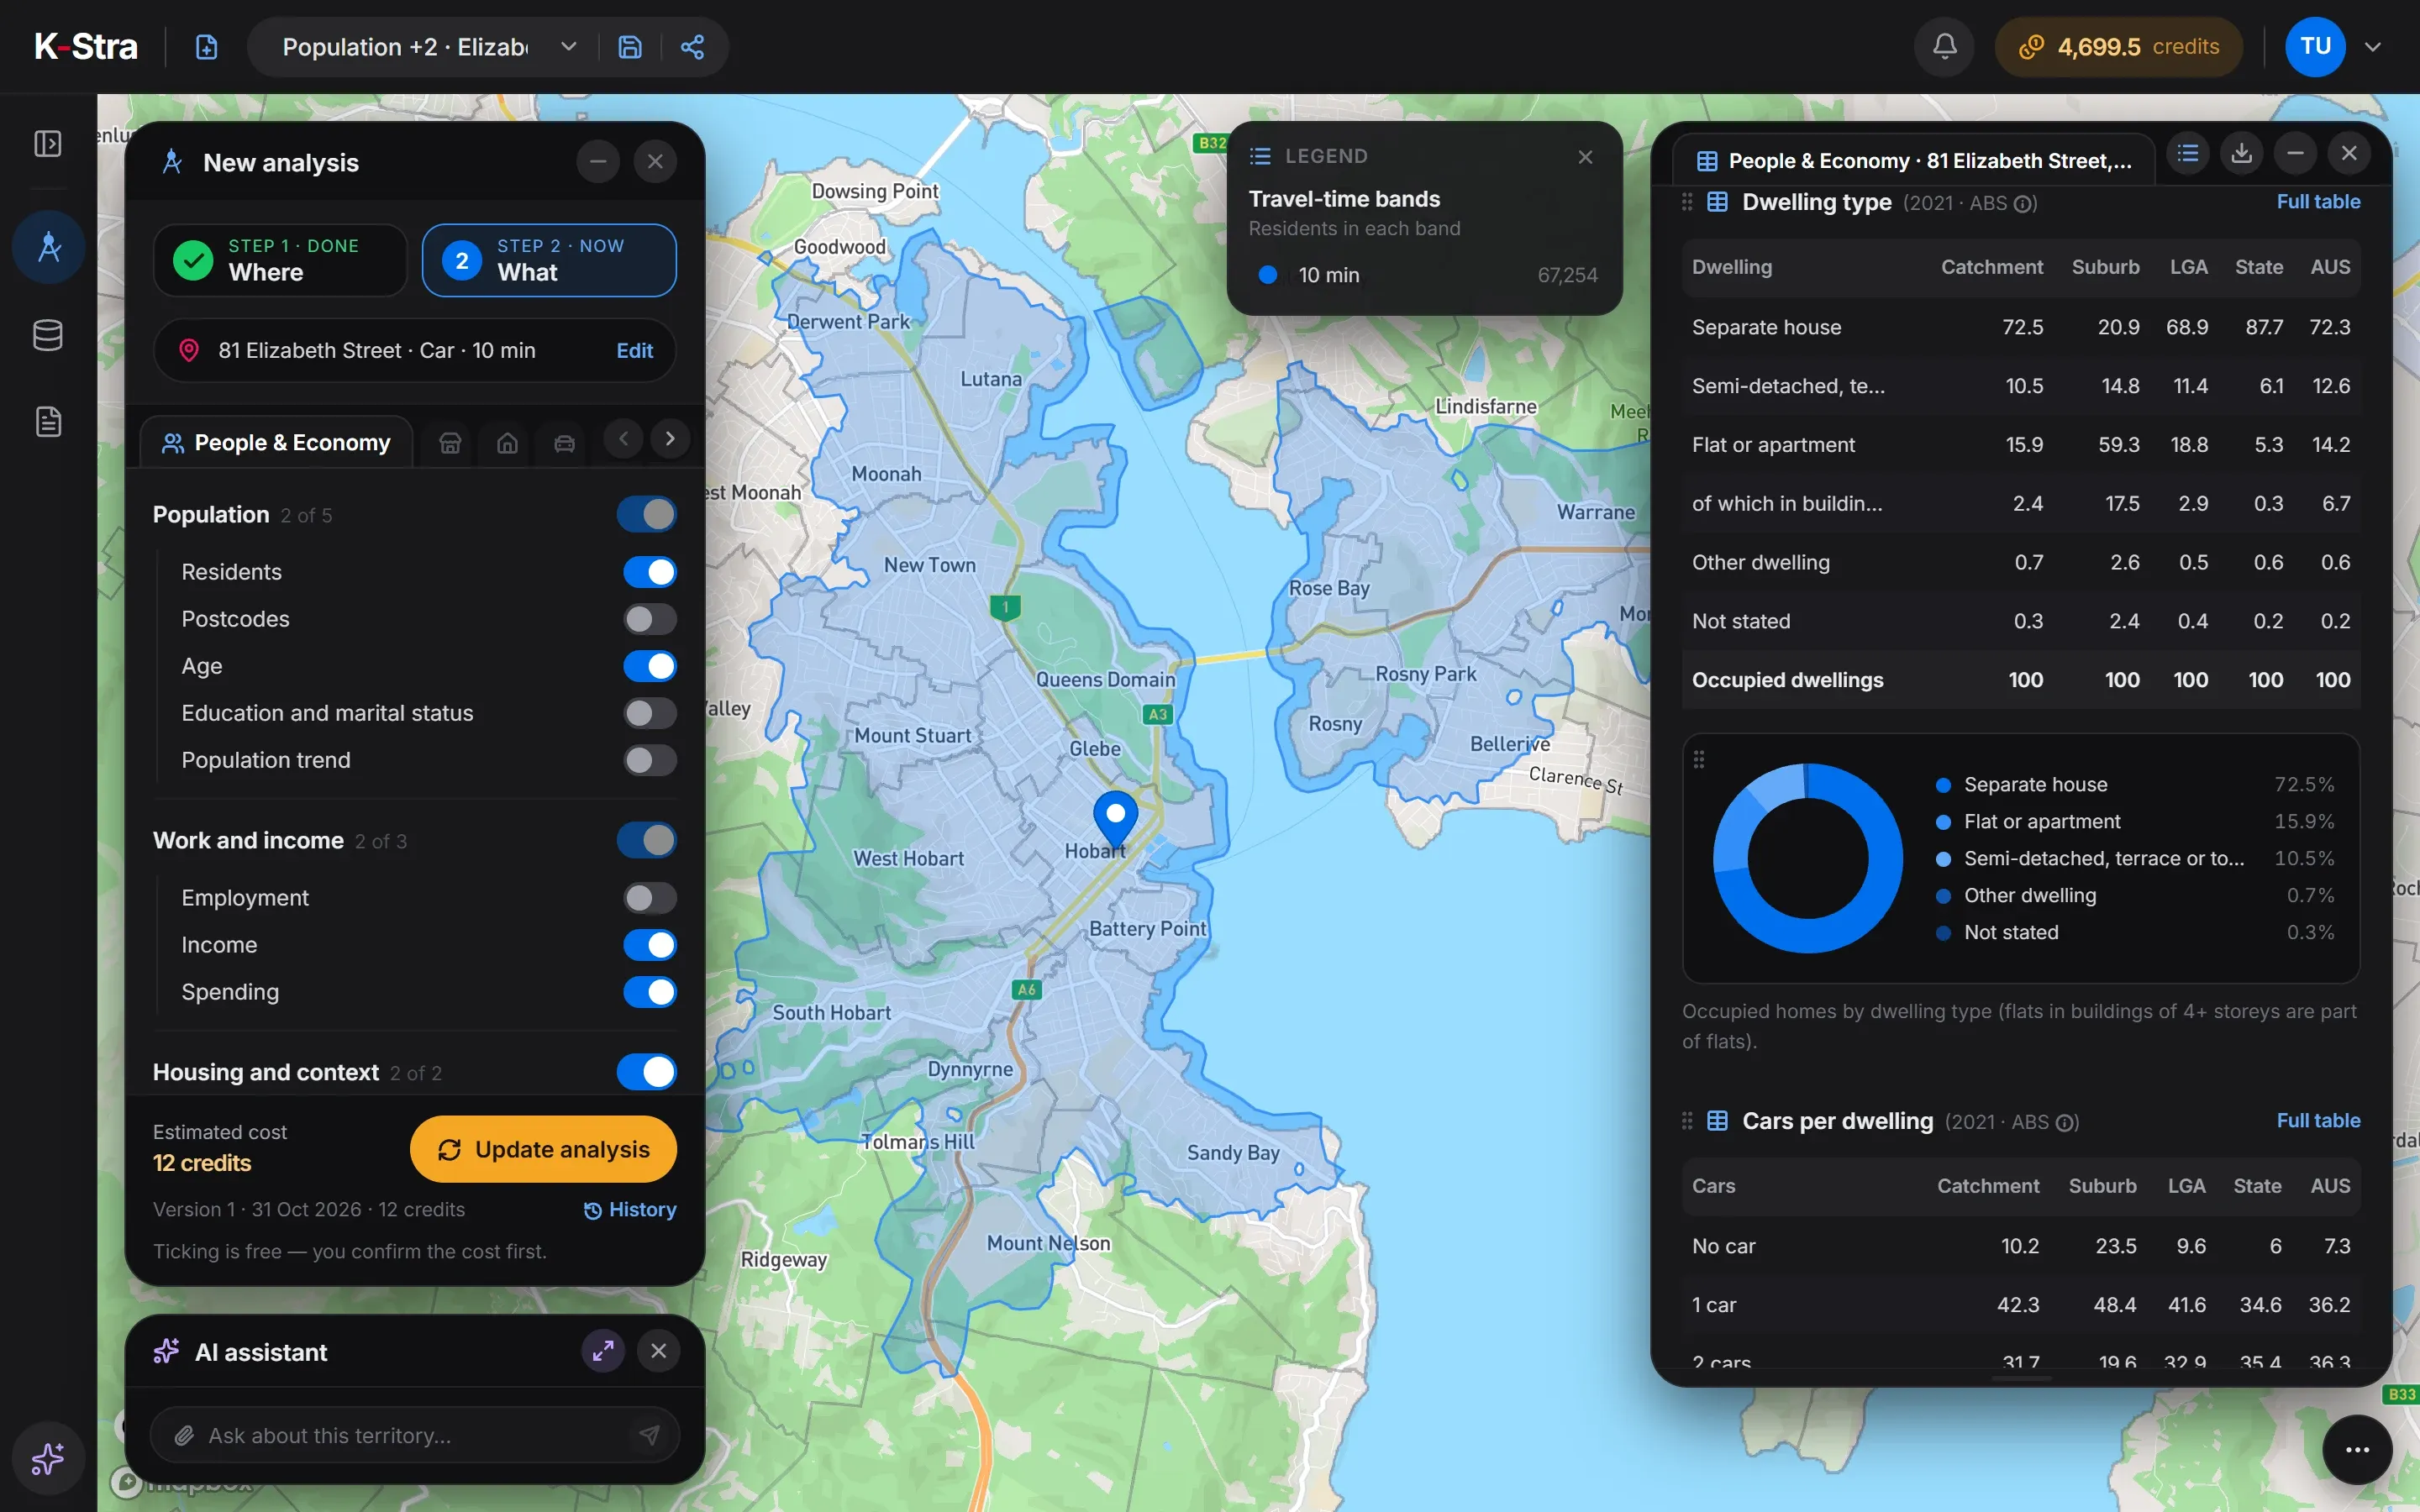 Hobart, TAS
In the suburb of Hobart, the city centre, 59.3% of homes are flats and 23.5% have no car. Across the 10-minute catchment, separate houses are back to 72.5%, almost exactly the Australian 72.3%.
Social housing is 5.5% of homes in the catchment and 13.2% in the centre, against 3.8% nationally. Tasmania as a whole leans the other way: 87.7% separate houses and 22.5% of homes with three or more cars.
| Share of occupied homes | Catchment | Suburb of Hobart | City of Hobart | Tasmania | Australia |
|---|---|---|---|---|---|
| Homes rented (%) | 36.2 | 65.6 | 35.6 | 26.4 | 30.6 |
| of which social housing (%) | 5.5 | 13.2 | 4.2 | 5.3 | 3.8 |
| Separate houses (%) | 72.5 | 20.9 | 68.9 | 87.7 | 72.3 |
| Flats and apartments (%) | 15.9 | 59.3 | 18.8 | 5.3 | 14.2 |
| Homes with no car (%) | 10.2 | 23.5 | 9.6 | 6 | 7.3 |
| Homes with three or more cars (%) | 14.6 | 5.2 | 14.9 | 22.5 | 18.8 |
Source: K-Stra analysis of 31 October 2026, 10 minutes by car from 81 Elizabeth Street, Hobart TAS; ABS Census 2021, tables G34, G36 and G37.
How does the comparison with the surrounding areas work?
One switch adds four columns to the tables of the analysis: the suburb, the council and the state where the address sits, and Australia. The area itself is counted address by address; the four references are the official areas, so each column can be checked against the ABS.
The Comparison topic adds one more table, sixteen indicators in five columns, mixing years by necessity: population from 2025, work and families from 2021, income from 2022–23. Each row keeps its own source, written under the table.
When are the housing sources updated?
| Source | Edition in K-Stra | Published | Next update of the source |
|---|---|---|---|
| ABS Regional population (Estimated Resident Population) | 30 June 2025, by council | 31 March 2026 | 25 March 2027 (30 June 2026) |
| ABS Census of Population and Housing 2021 | Census night, 10 August 2021 | 28 June 2022 | June 2027, first results of the 2026 Census |
| ABS Personal Income in Australia (tax data) | 2022–23 financial year | 14 November 2025 | 27 November 2026 (2023–24) |
What else do people ask about housing data?
Why are housing figures from 2021?
Because only the census counts homes by tenure, type and number of cars for small areas. The 2026 Census results start in June 2027; until then the 2021 figures are the most recent available for any suburb or street.
Why do some housing counts have decimals?
The ABS adds small random changes to census counts to protect privacy, and K-Stra spreads them onto addresses without rounding. A council total can differ from the published one by up to 16 dwellings; shares barely move.
What are the sixteen indicators of the comparison?
Population, area, density, average yearly change, families, residents per family, males, females, born overseas, average age, old-age index, participation rate, not in the labour force, unemployment rate, and the income and consumption indices.
Compare an area
with its surroundings.
Switch on Housing and the comparison, and read five columns side by side.
Open the app — free to exploreSwitching the comparison on is free