
How do you see traffic and footfall on every road in Australia?
How many vehicles pass along a road, and how busy a street is on foot, read in bands for any area you draw.
Traffic & Footfall is the K-Stra module that estimates traffic on every road of an area: vehicles a day in seven bands, from under 1,000 a day to over 60,000 a day, and pedestrians as a footfall index in five grades. Official counts are shown as measured, with their year. It costs 30 credits per area.
What does Traffic & Footfall show for an area?
Choose an area in the Where step, then Traffic & Footfall in the What step, vehicles or pedestrians, and the period. The result has four parts.
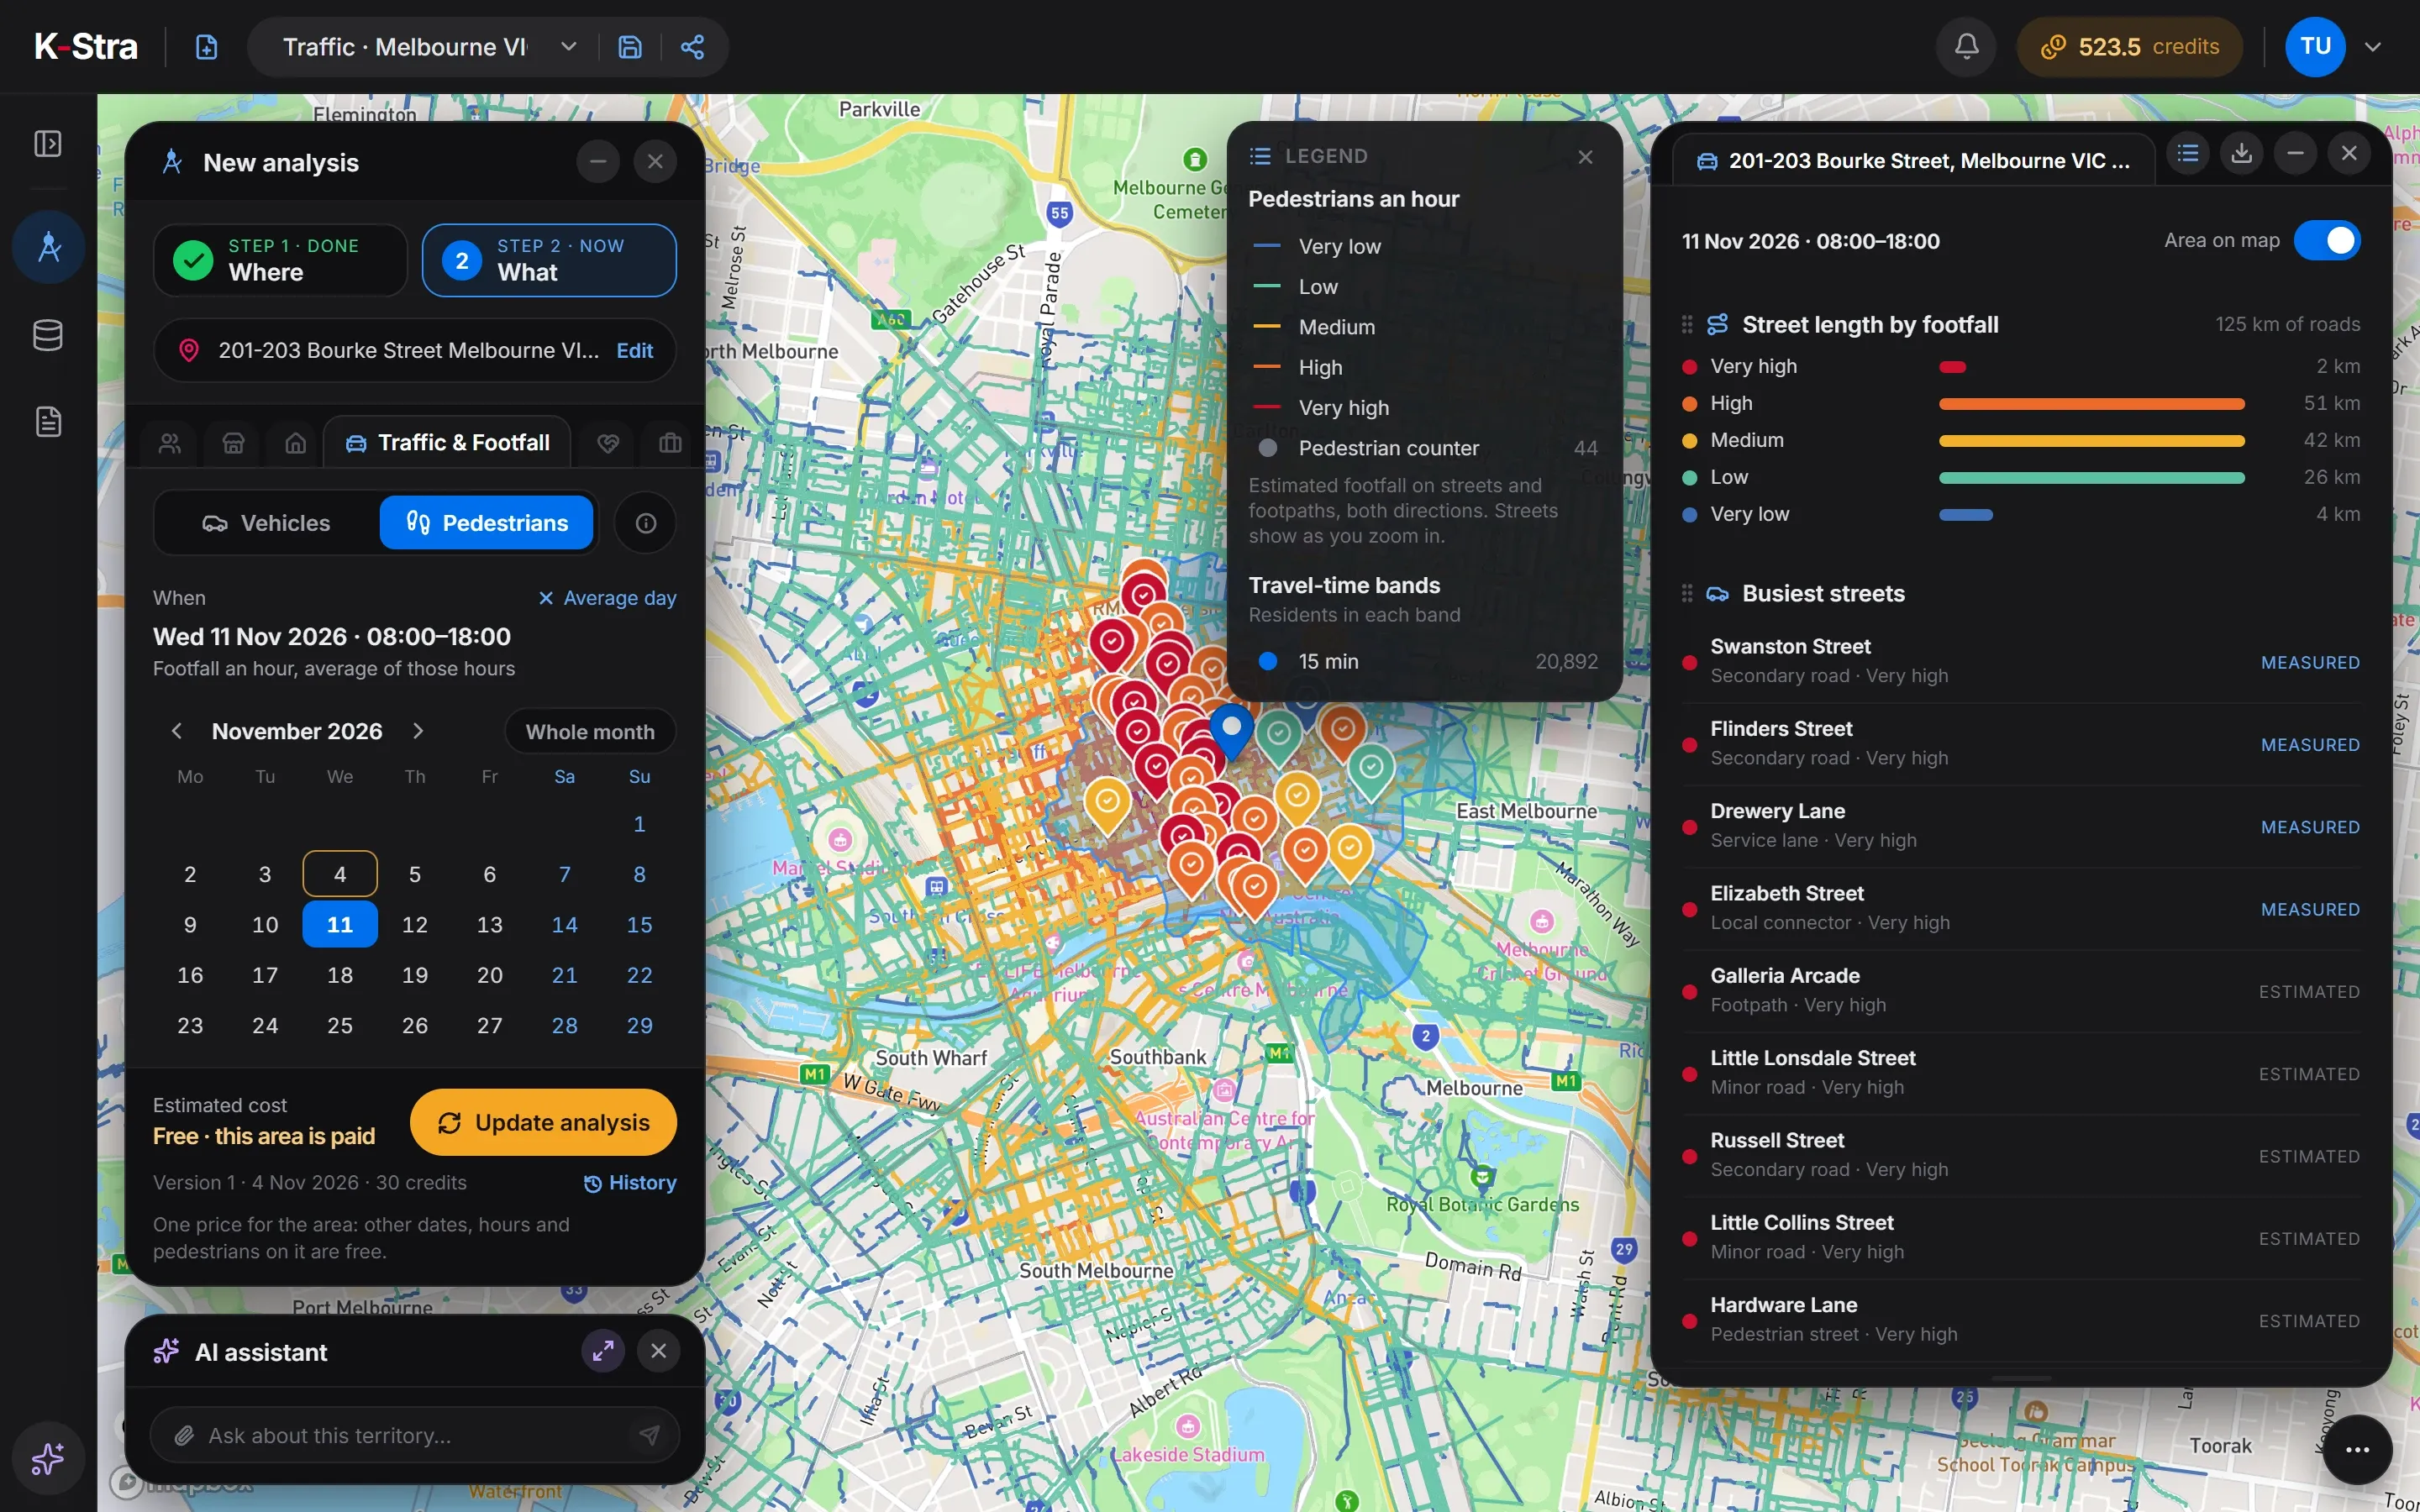 Traffic & Footfall
The roads coloured by traffic
Every road of the area on the map in the colour of its band, thicker where traffic is heavier. Official counts appear as markers in the colour of the measured band.
The busiest roads
The busiest named roads of the area, each with its type and band, and the tag Measured or Estimated. For pedestrians, the busiest streets, footpaths and arcades.
Kilometres in each band
How many kilometres of road fall in each band, so two areas can be compared at a glance. For pedestrians, the length of street in each grade.
The official counts in the area
Each count taken inside the area, with the road, the measured band, the public agency that took it and the year of the count.
Transcript
Traffic & Footfall shows how busy every road is: vehicles a day, and people on foot. Draw or pick an area — here, part of western Sydney with its motorways — and choose vehicles or pedestrians. Every road is coloured in one of seven bands of vehicles a day, estimated from trips on the road network and calibrated on official counts. Where a count was taken, the road is marked as measured. Pedestrians come in five grades, and you can pick a date, a range of days or the hours. One price per area: other days, hours and pedestrians on it cost nothing more. Exploring and setting up are free. You only spend credits when you run the analysis.
How are vehicles and pedestrians measured?
Traffic is never a single number. Vehicles fall in seven bands, both directions together; pedestrians in five grades of footfall, on streets, footpaths and pedestrian ways.
| Vehicles a day |
|---|
| Under 1,000 a day |
| 1,000–3,000 a day |
| 3,000–8,000 a day |
| 8,000–15,000 a day |
| 15,000–30,000 a day |
| 30,000–60,000 a day |
| Over 60,000 a day |
| Vehicles in an hour |
|---|
| Under 50 in the hour |
| 50–150 in the hour |
| 150–400 in the hour |
| 400–750 in the hour |
| 750–1,500 in the hour |
| 1,500–3,000 in the hour |
| Over 3,000 in the hour |
| Pedestrians |
|---|
| Very low |
| Low |
| Medium |
| High |
| Very high |
Every value carries one of two tags. Measured means an official count was taken on that road, and its band is shown as it was counted, with the year. Estimated means the band comes from the model.
Estimates are given in bands. They are closest on main roads and wider on local streets and motorways; a measured count, where there is one, always comes first.
Where do the traffic estimates come from?
K-Stra does not count cars or people one by one. It rebuilds the trips between where people live, where they work and where they shop, and routes them on its road network, the same one that draws the travel-time bands.
The model is then calibrated on what was actually counted: official traffic counts in New South Wales, Victoria, Queensland, South Australia and Western Australia for vehicles, and pedestrian counters in Melbourne, Brisbane, Casey and Sydney for footfall.
Which day and hour can you look at?
The calendar in the panel chooses the period. Public holidays count as Sundays.
Average day of the year
Where the panel starts: no date, all day. The bands are vehicles a day, both directions.
A day, a range or a month
Click a day in the calendar, then a second one to close a range, or take the whole month. A range shows the average day of the days inside it.
An hour or a range of hours
Pick hours on the bar of the 24 hours. With an hour the bands become vehicles in the hour; a range of hours shows its average hour.
What does traffic look like around central Sydney?
The area within 15 minutes by car in average traffic of 483 George Street, Sydney, on the average day of the year: 2,682 km of roads, 66 of them with an official count inside the area.
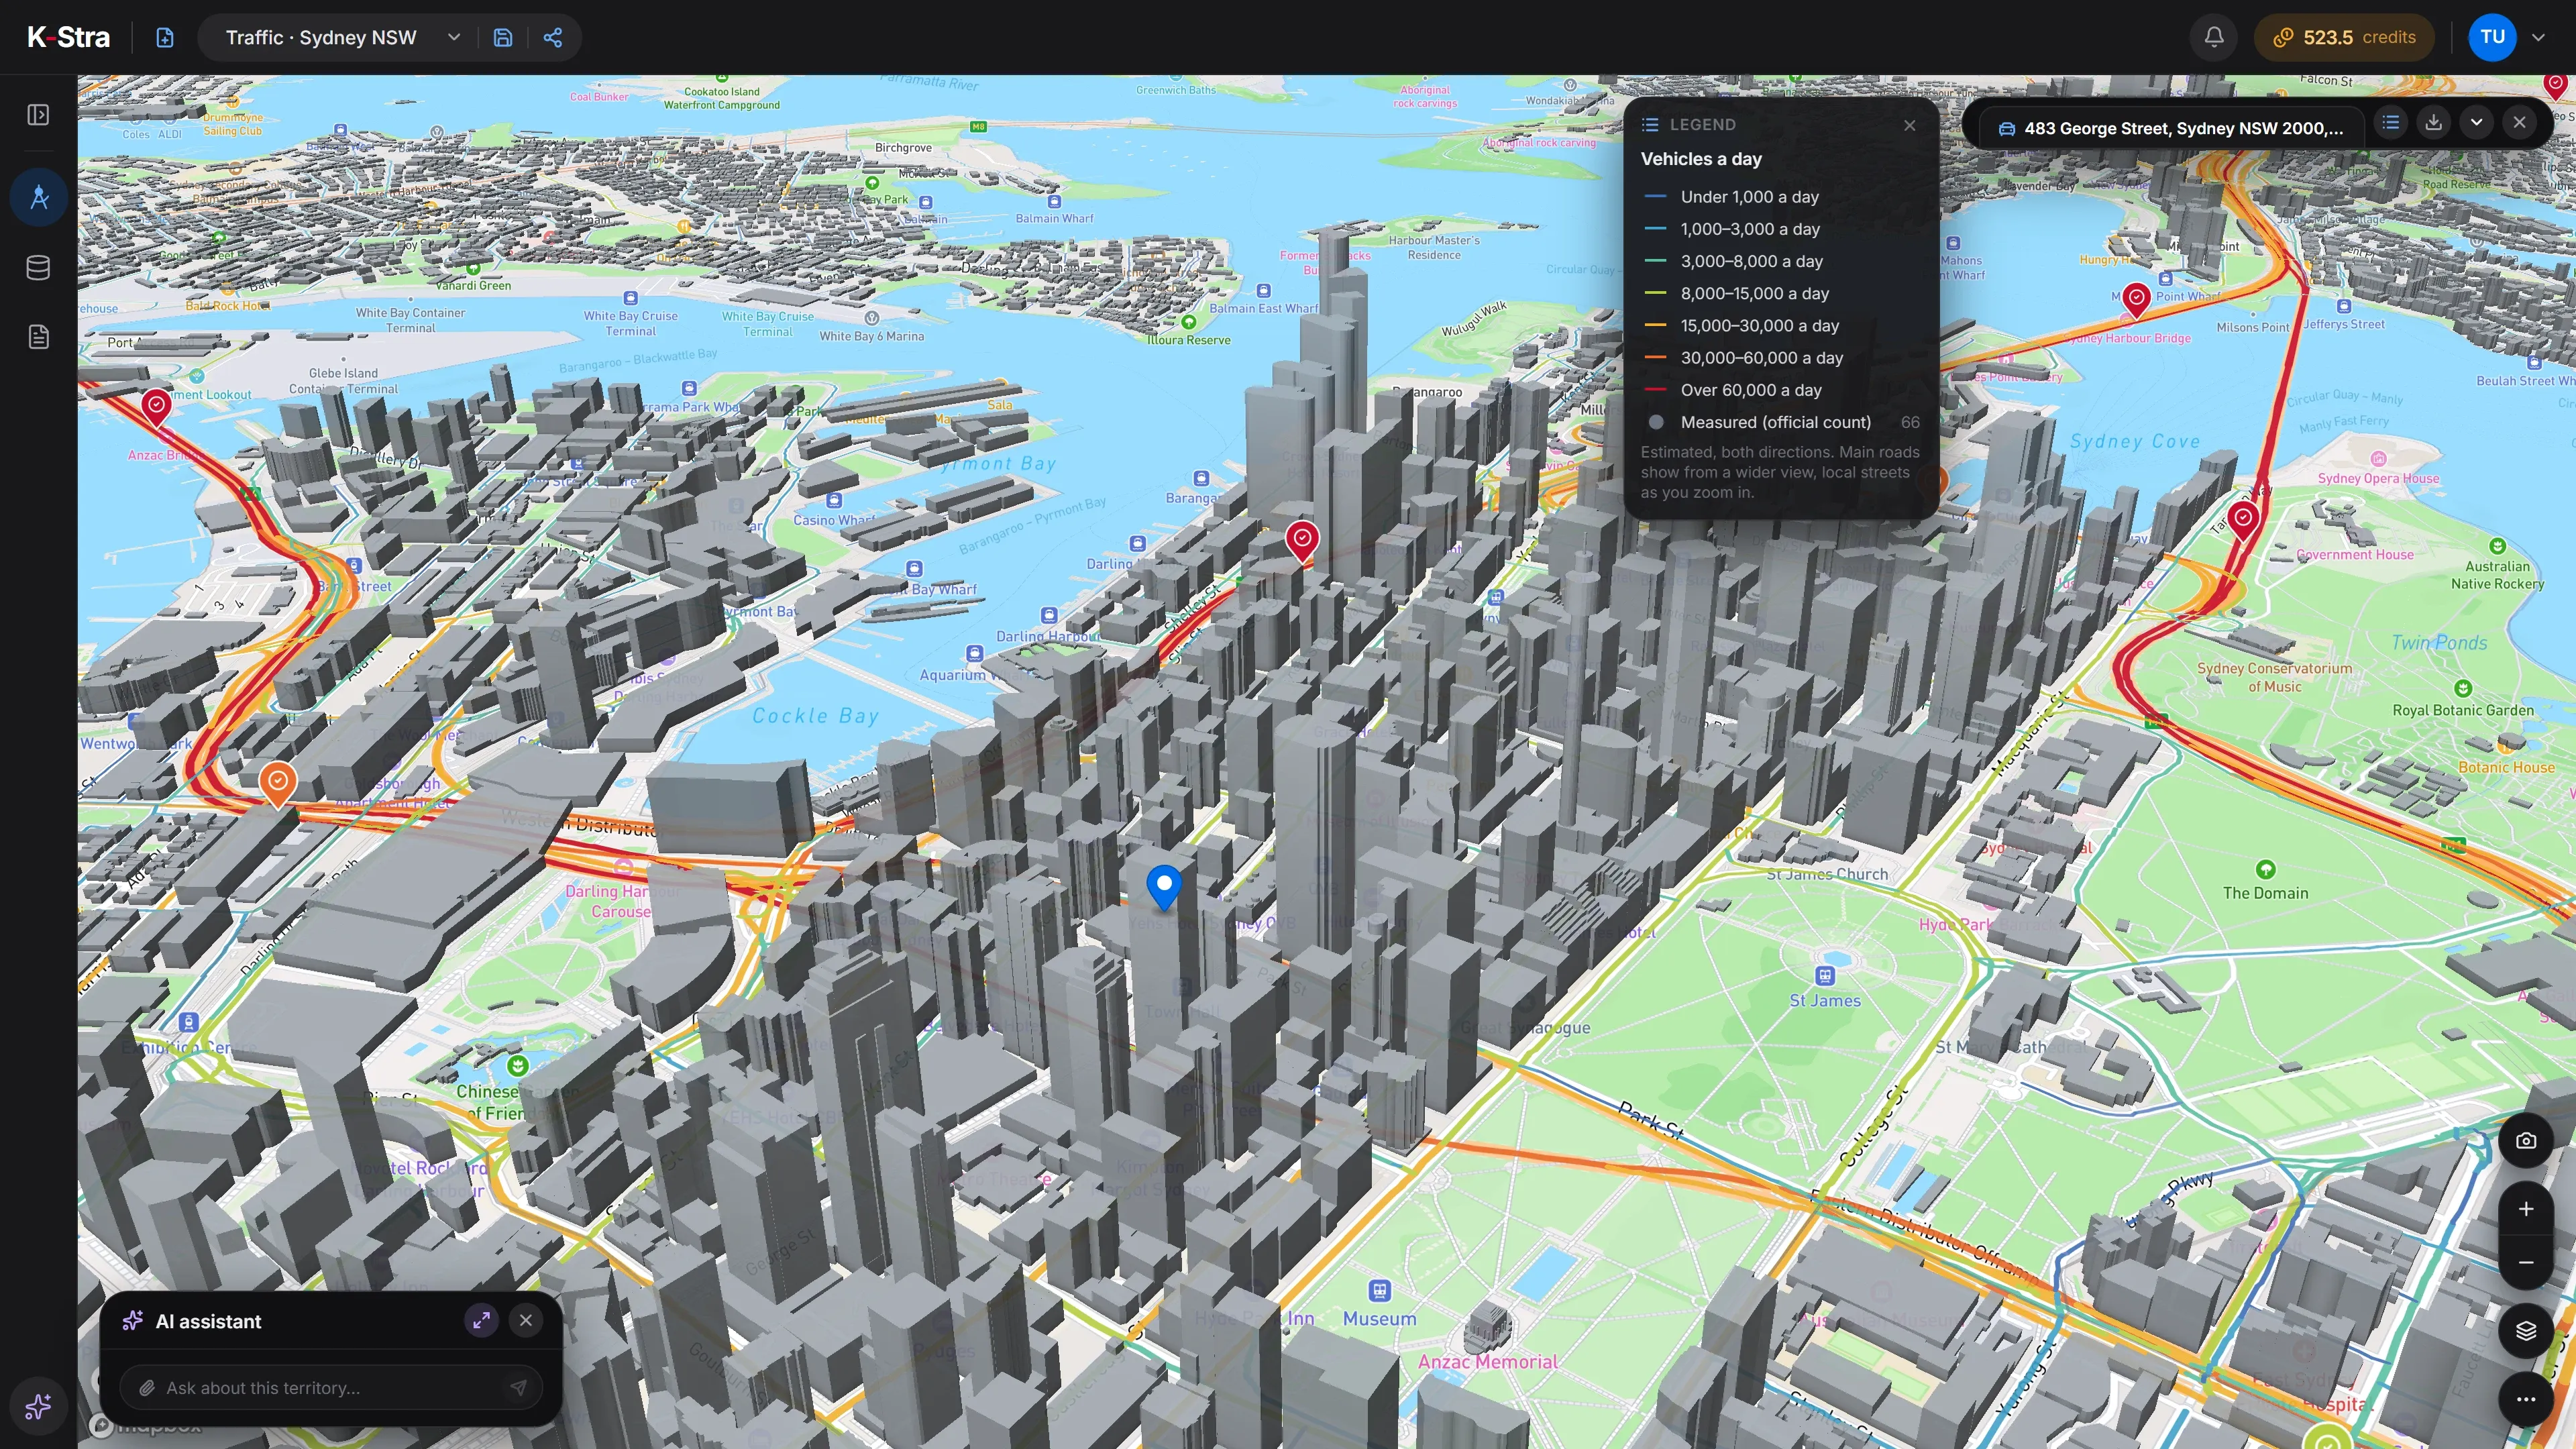 Vehicles a day
| Vehicles a day | Road (km) |
|---|---|
| Over 60,000 a day | 65 |
| 30,000–60,000 a day | 195 |
| 15,000–30,000 a day | 322 |
| 8,000–15,000 a day | 221 |
| 3,000–8,000 a day | 330 |
| 1,000–3,000 a day | 624 |
| Under 1,000 a day | 926 |
Source: K-Stra analysis of 4 November 2026, 15 minutes by car in average traffic; K-Stra traffic estimates and official traffic counts. Measured in the area, among others: Cahill Expressway, Western Distributor, Sydney Harbour Tunnel and Southern Cross Drive.
What does Traffic & Footfall cost?
- 30 credits per area, whatever its size and the period you choose.
- Other days, other hours and pedestrians on an area already paid: free.
- Reopening the analysis, its versions and its exports: free.
- A failed run charges nothing.
The price is shown before anything runs. After an update of the road network the same place counts as a new area, and is paid again the first time.
What does Traffic & Footfall not tell you?
- How many people walk into a store: footfall is on the street, not through the door.
- An exact count of vehicles on a road that has no official count: only a band.
- Single events, such as a match or a concert, and school holidays: they are not in the model.
- Calibration on local counts in Tasmania, the ACT and the Northern Territory: there the estimates come from the model alone.
Questions about Traffic & Footfall
Can K-Stra tell me exactly how many cars pass an address?
No, and it says so. Every road gets a band, such as 8,000–15,000 vehicles a day, never a single number, and pedestrians get a grade from very low to very high. Where an official count exists, its band is shown as measured, with its year.
How are the estimates made?
From a model of trips between where people live, work and shop, routed on the road network. Vehicles are calibrated on official traffic counts in New South Wales, Victoria, Queensland, South Australia and Western Australia; pedestrians on pedestrian counters in Melbourne, Brisbane, Casey and Sydney. Estimates are given in bands. They are closest on main roads and wider on local streets and motorways; a measured count, where there is one, always comes first.
Does changing the day or switching to pedestrians cost more?
No. The price is 30 credits per area, whatever its size and the period. Once your organisation has paid an area, other days, other hours and pedestrians on the same area are free.
Does it cover all of Australia?
Yes: there is an estimate for every road in Australia. In Tasmania, the ACT and the Northern Territory the estimates come from the same model without local counts to calibrate them, and the results say so when an area falls there.
Can I put traffic in a report?
Yes. The tables of the results can be dragged into a report like those of the other modules, and the map view with the coloured roads can be captured and placed next to them.
Every road.
In bands you can trust.
Draw an area, choose vehicles or pedestrians and a day. One price for the area: 30 credits, then other periods are free.
Open the app — free to explore40 credits when you sign up · no card required