
How do I find out who lives around a location?
Before a lease, a campaign or a new service, you need to know who is nearby. Here is how to build that profile, and how to read it without fooling yourself.
A demographic analysis describes the people who live in an area: how many there are, their ages, households, income, spending and housing. Draw the area people can actually reach, read every figure against the council, the state and the national average, and check which year each number comes from before you decide.
Why are demographic figures easy to misread?
The official figures are published for statistical areas that never match the area you care about. A catchment cuts through dozens of them, so the numbers have to be added up piece by piece, and a council total says little about the streets around one address.
They also come from different years. Population is estimated every year, while most of the detail — housing, jobs, education, birthplace — comes from a census held every five years. A profile that mixes them without saying so looks more current than it is.
And a figure alone is not an insight. One resident in five aged over 65 sounds old until you learn that the state average is higher; a third of homes rented sounds normal until you see the national share. Every number needs a reference next to it.
when the first results of the 2026 Census are due. Until then, housing, work and education for small areas still describe August 2021.
Australian Bureau of Statistics (2026), “2026 Census topics and data release”, abs.gov.au.
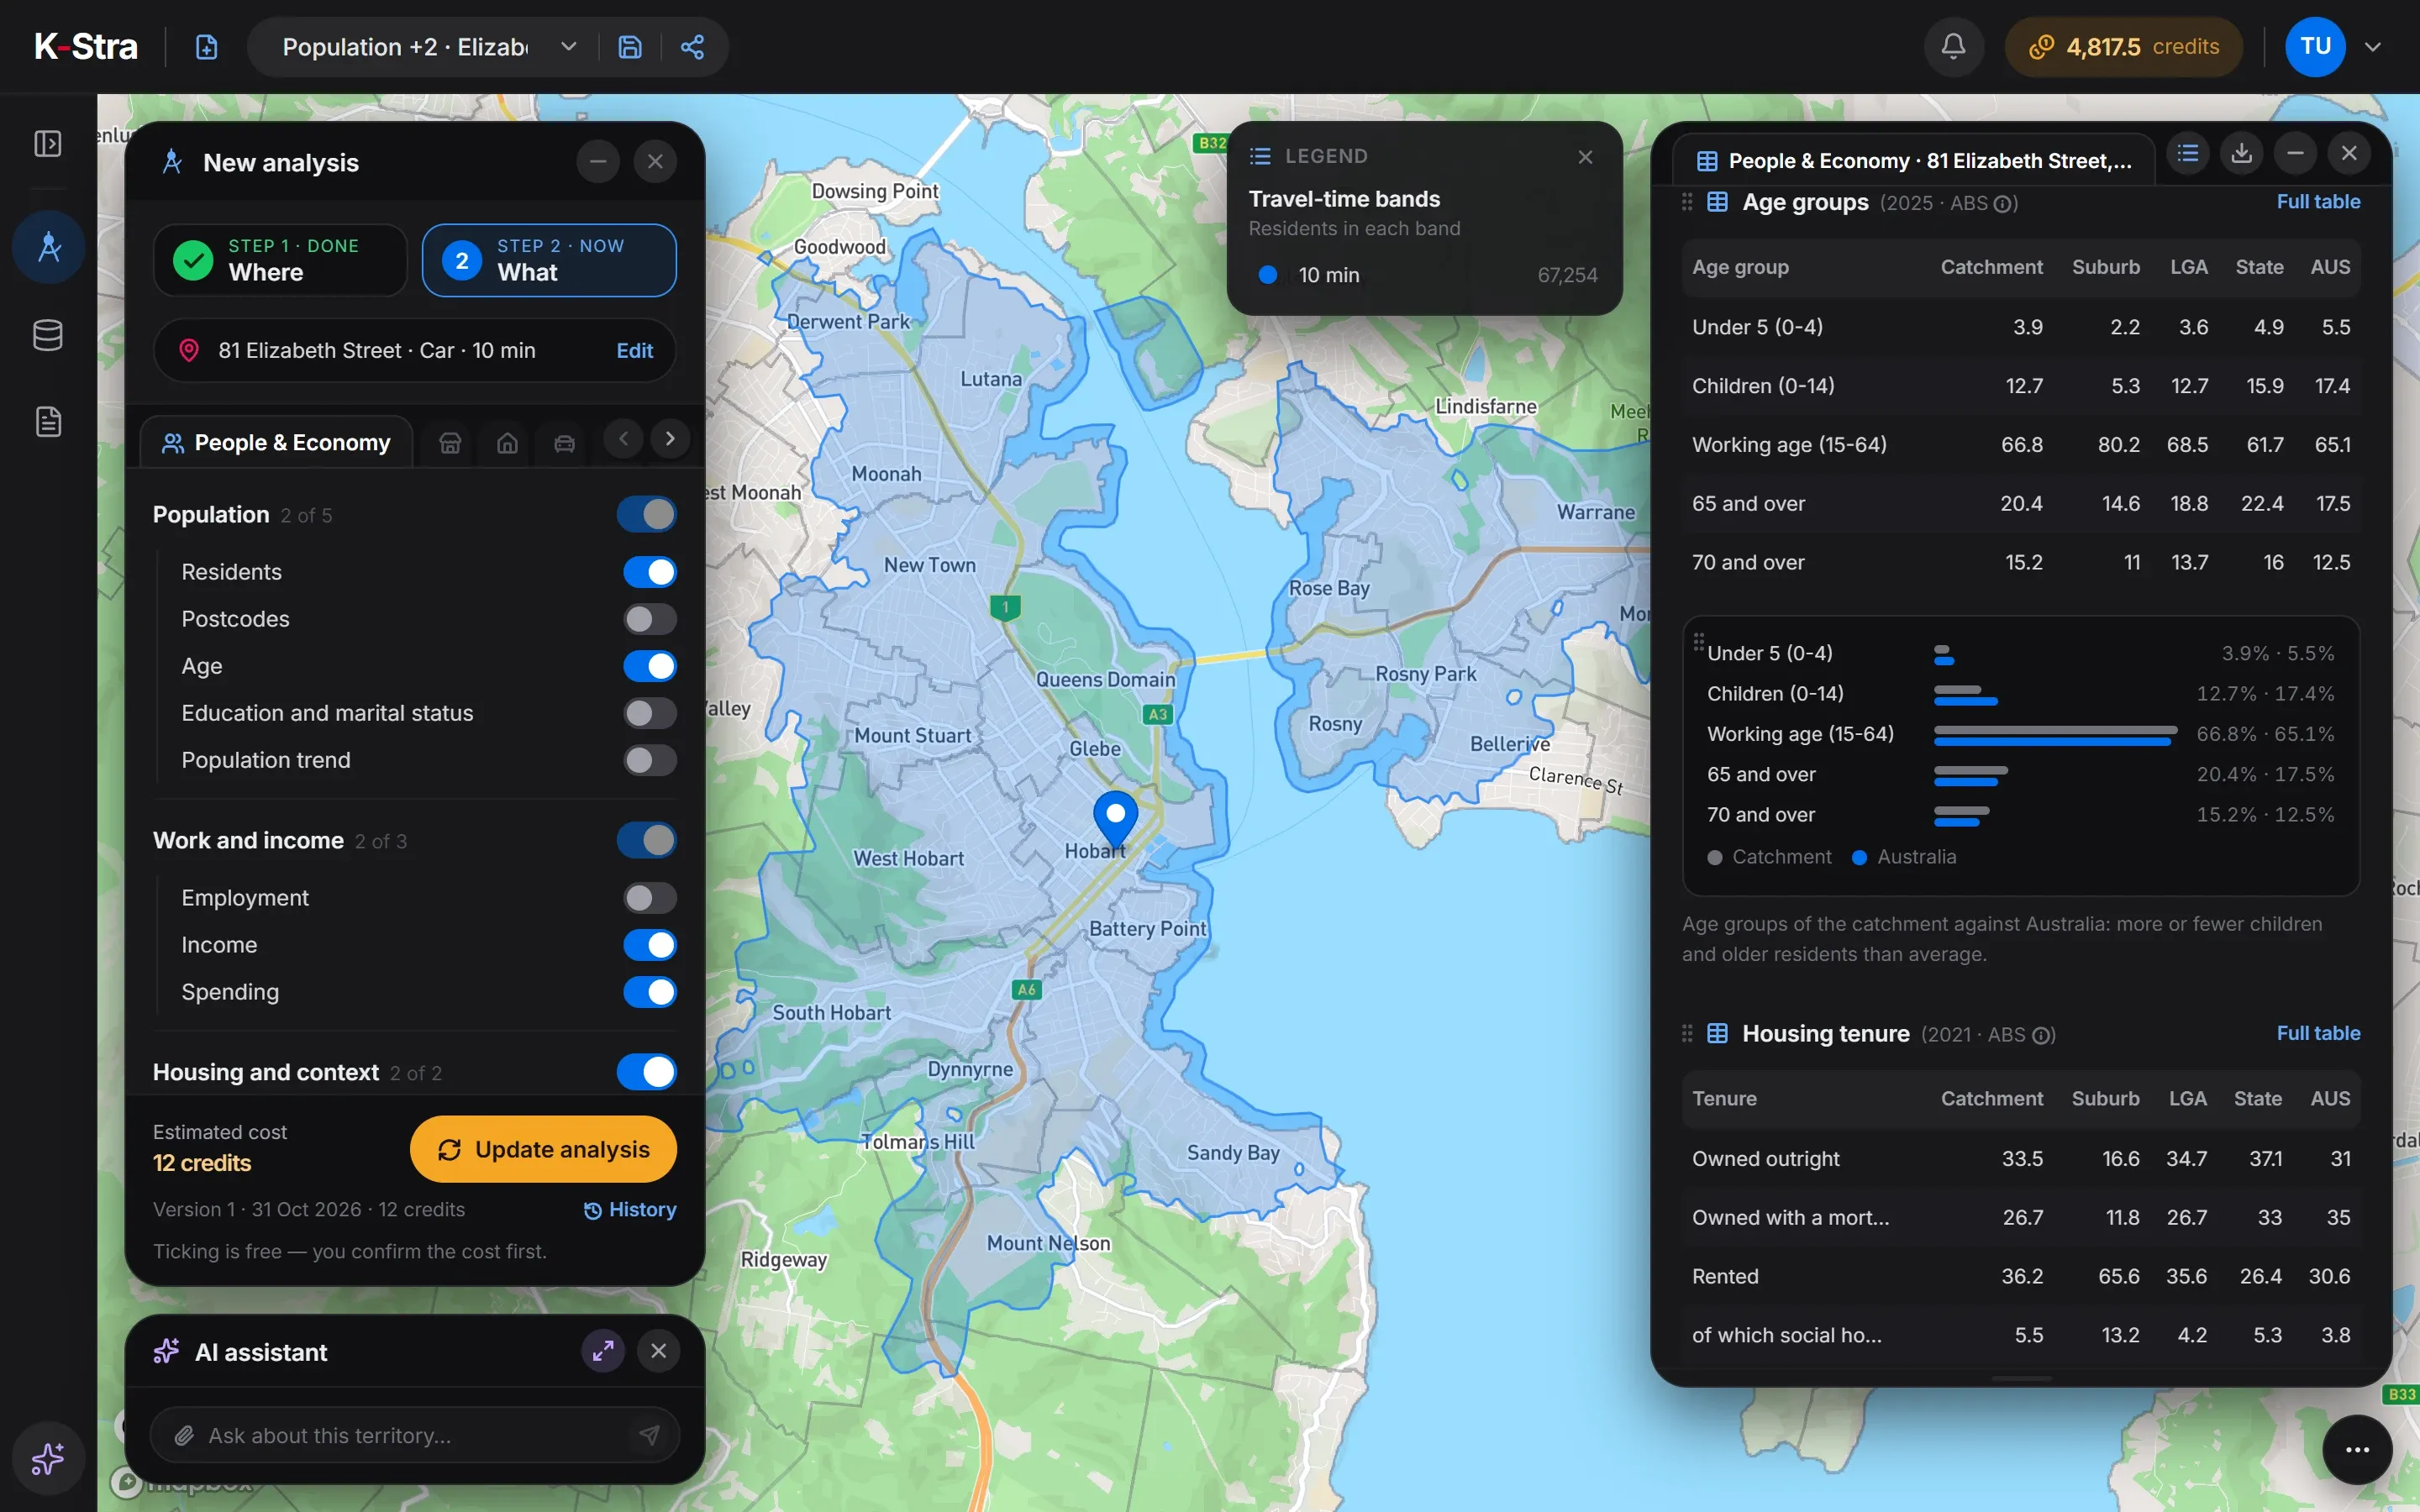 Compare with the area
How do you build a demographic profile, step by step?
Draw the area people can reach
Use a drive or walk time from the address rather than a circle. Rivers, bridges and hills decide who is really nearby.
Count residents and households
Start with the size of the market: residents, families and people per family. Everything else is a share of these.
Read the age profile
Children, working age and over-65s point to different needs. Compare five-year classes, not only the average age.
Look at income and spending
An income index shows whether the area earns above or below the national average; spending by category shows where the money goes.
Check housing and cars
Renters, apartments and households without a car change how people shop and how far they travel.
Compare with the surroundings
Put each figure next to the suburb, the council, the state and Australia. A number means little until it has a reference.
Note the year of each figure
Population is estimated every year, the census every five. Write the year next to every number you quote.
What data do you need for a demographic analysis?
Only an address or an area. The population, census and spending figures are already loaded and spread onto 14.5 million address points.
An address or an area
One to ten addresses with their travel-time bands, shapes drawn on the map, or administrative areas such as councils and postcodes.
Drawing a catchmentPopulation estimates
ABS Estimated Resident Population at 30 June 2025: 27.6 million people, by sex and age, updated every year.
ABS populationCensus 2021
Households, housing, cars, education, work and birthplace from the census of 10 August 2021, the latest with results for small areas.
ABS Census 2021Income and spending
Personal income from tax data for 2022–23 and household spending from the national accounts for 2024–25, by spending category.
Income and spending data
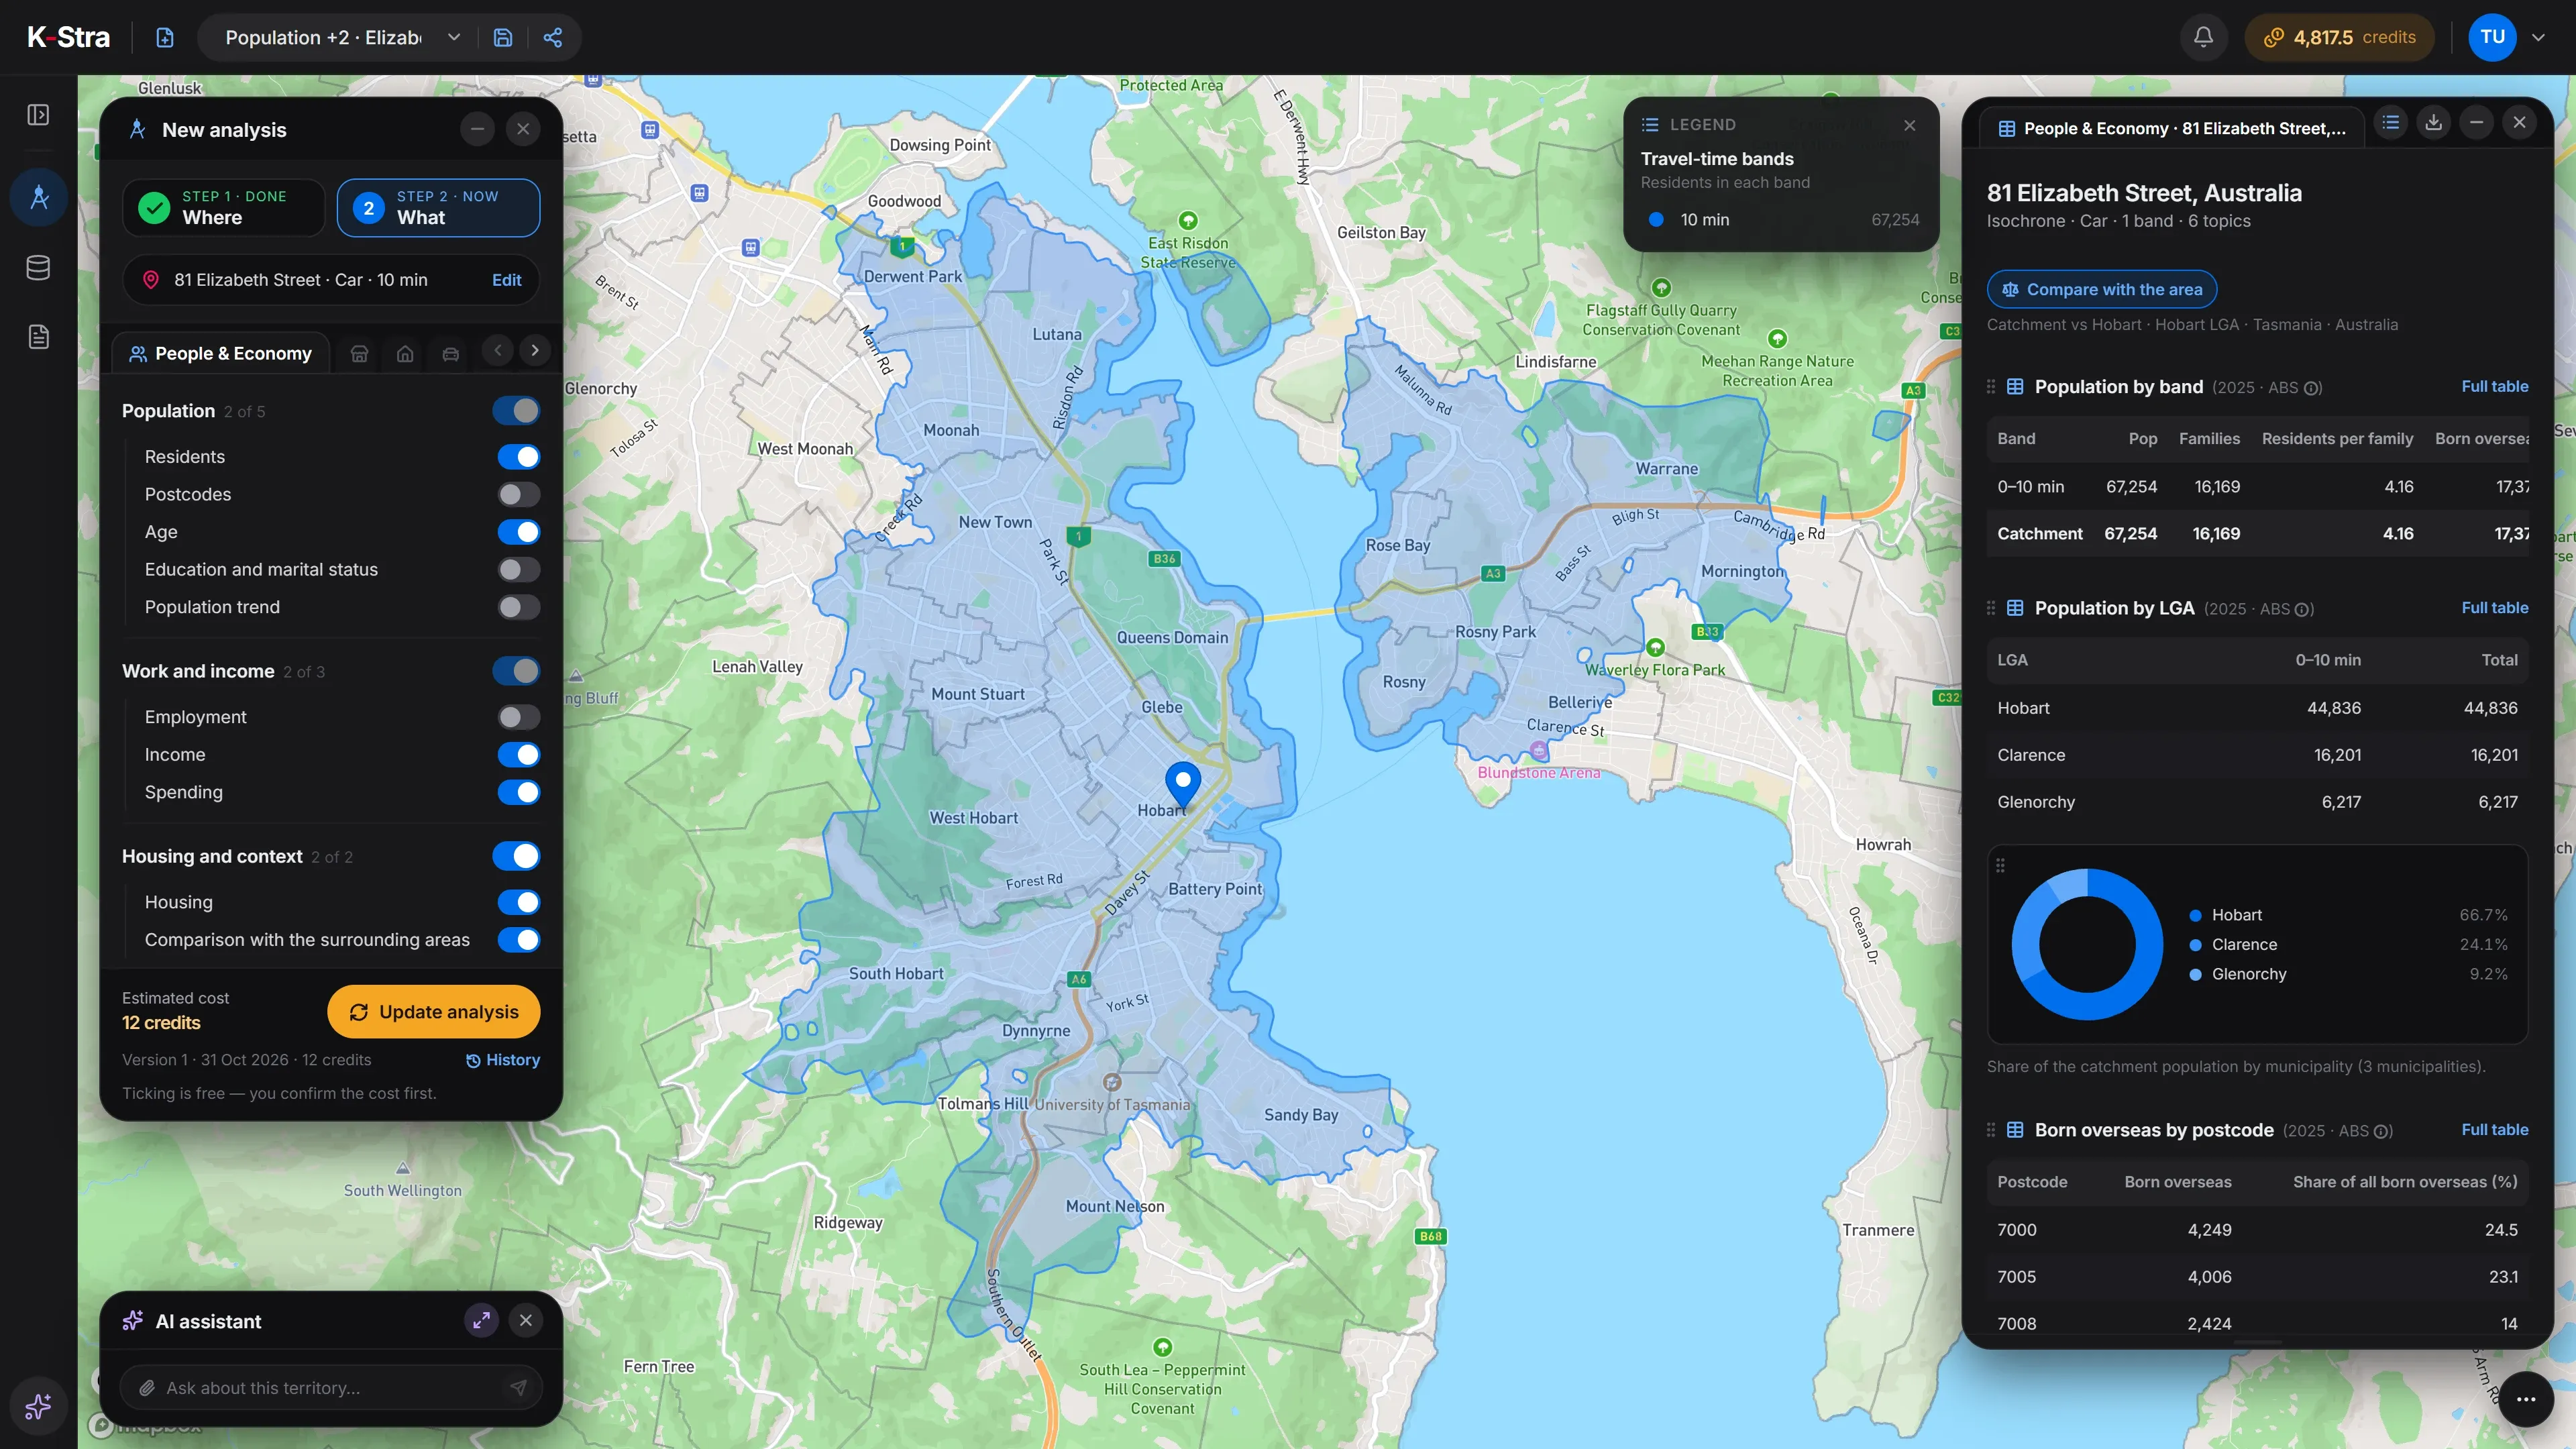
How do you run a demographic analysis in K-Stra?
People & Economy is a module of the What step. You choose the area in the Where step, tick the topics you want and confirm the cost before anything runs.
- WhereType an address and keep the drive-time bands, or switch to walking, distance or a drawn area. One to six bands, up to ten addresses.
- WhatTen topics in three groups: population, work and income, housing and context. Each one adds its own tables and charts.
- Compare with the areaOne switch adds four columns to every table: the suburb, the council, the state and Australia. It costs nothing.
Every table opens in full below the map and exports to PDF, Excel, CSV or KML at no cost. The comparison table holds sixteen indicators — from density and population change to unemployment and the income index — for all five areas at once.
What does the comparison look like in the app?
On-screen text
People & Economy · Compare with the area. Who lives there, next to everyone else. 10 minutes by car from Elizabeth Street, Hobart. Residents, age, income, spending, housing. 66,933 residents within 10 minutes. Compare: suburb, LGA, Tasmania, Australia. Average age 41.3 · Tasmania 42.9 · Australia 39.9. Renting: 37.5% here, 30.6% across Australia. Income index 97.6, where Australia is 100. A$51,402 spent per person each year. Know the people, not just the place. Sources: ABS population estimates 2025, Census 2021 (housing), income 2023, household spending 2025.
What does the comparison with the surrounding areas show?
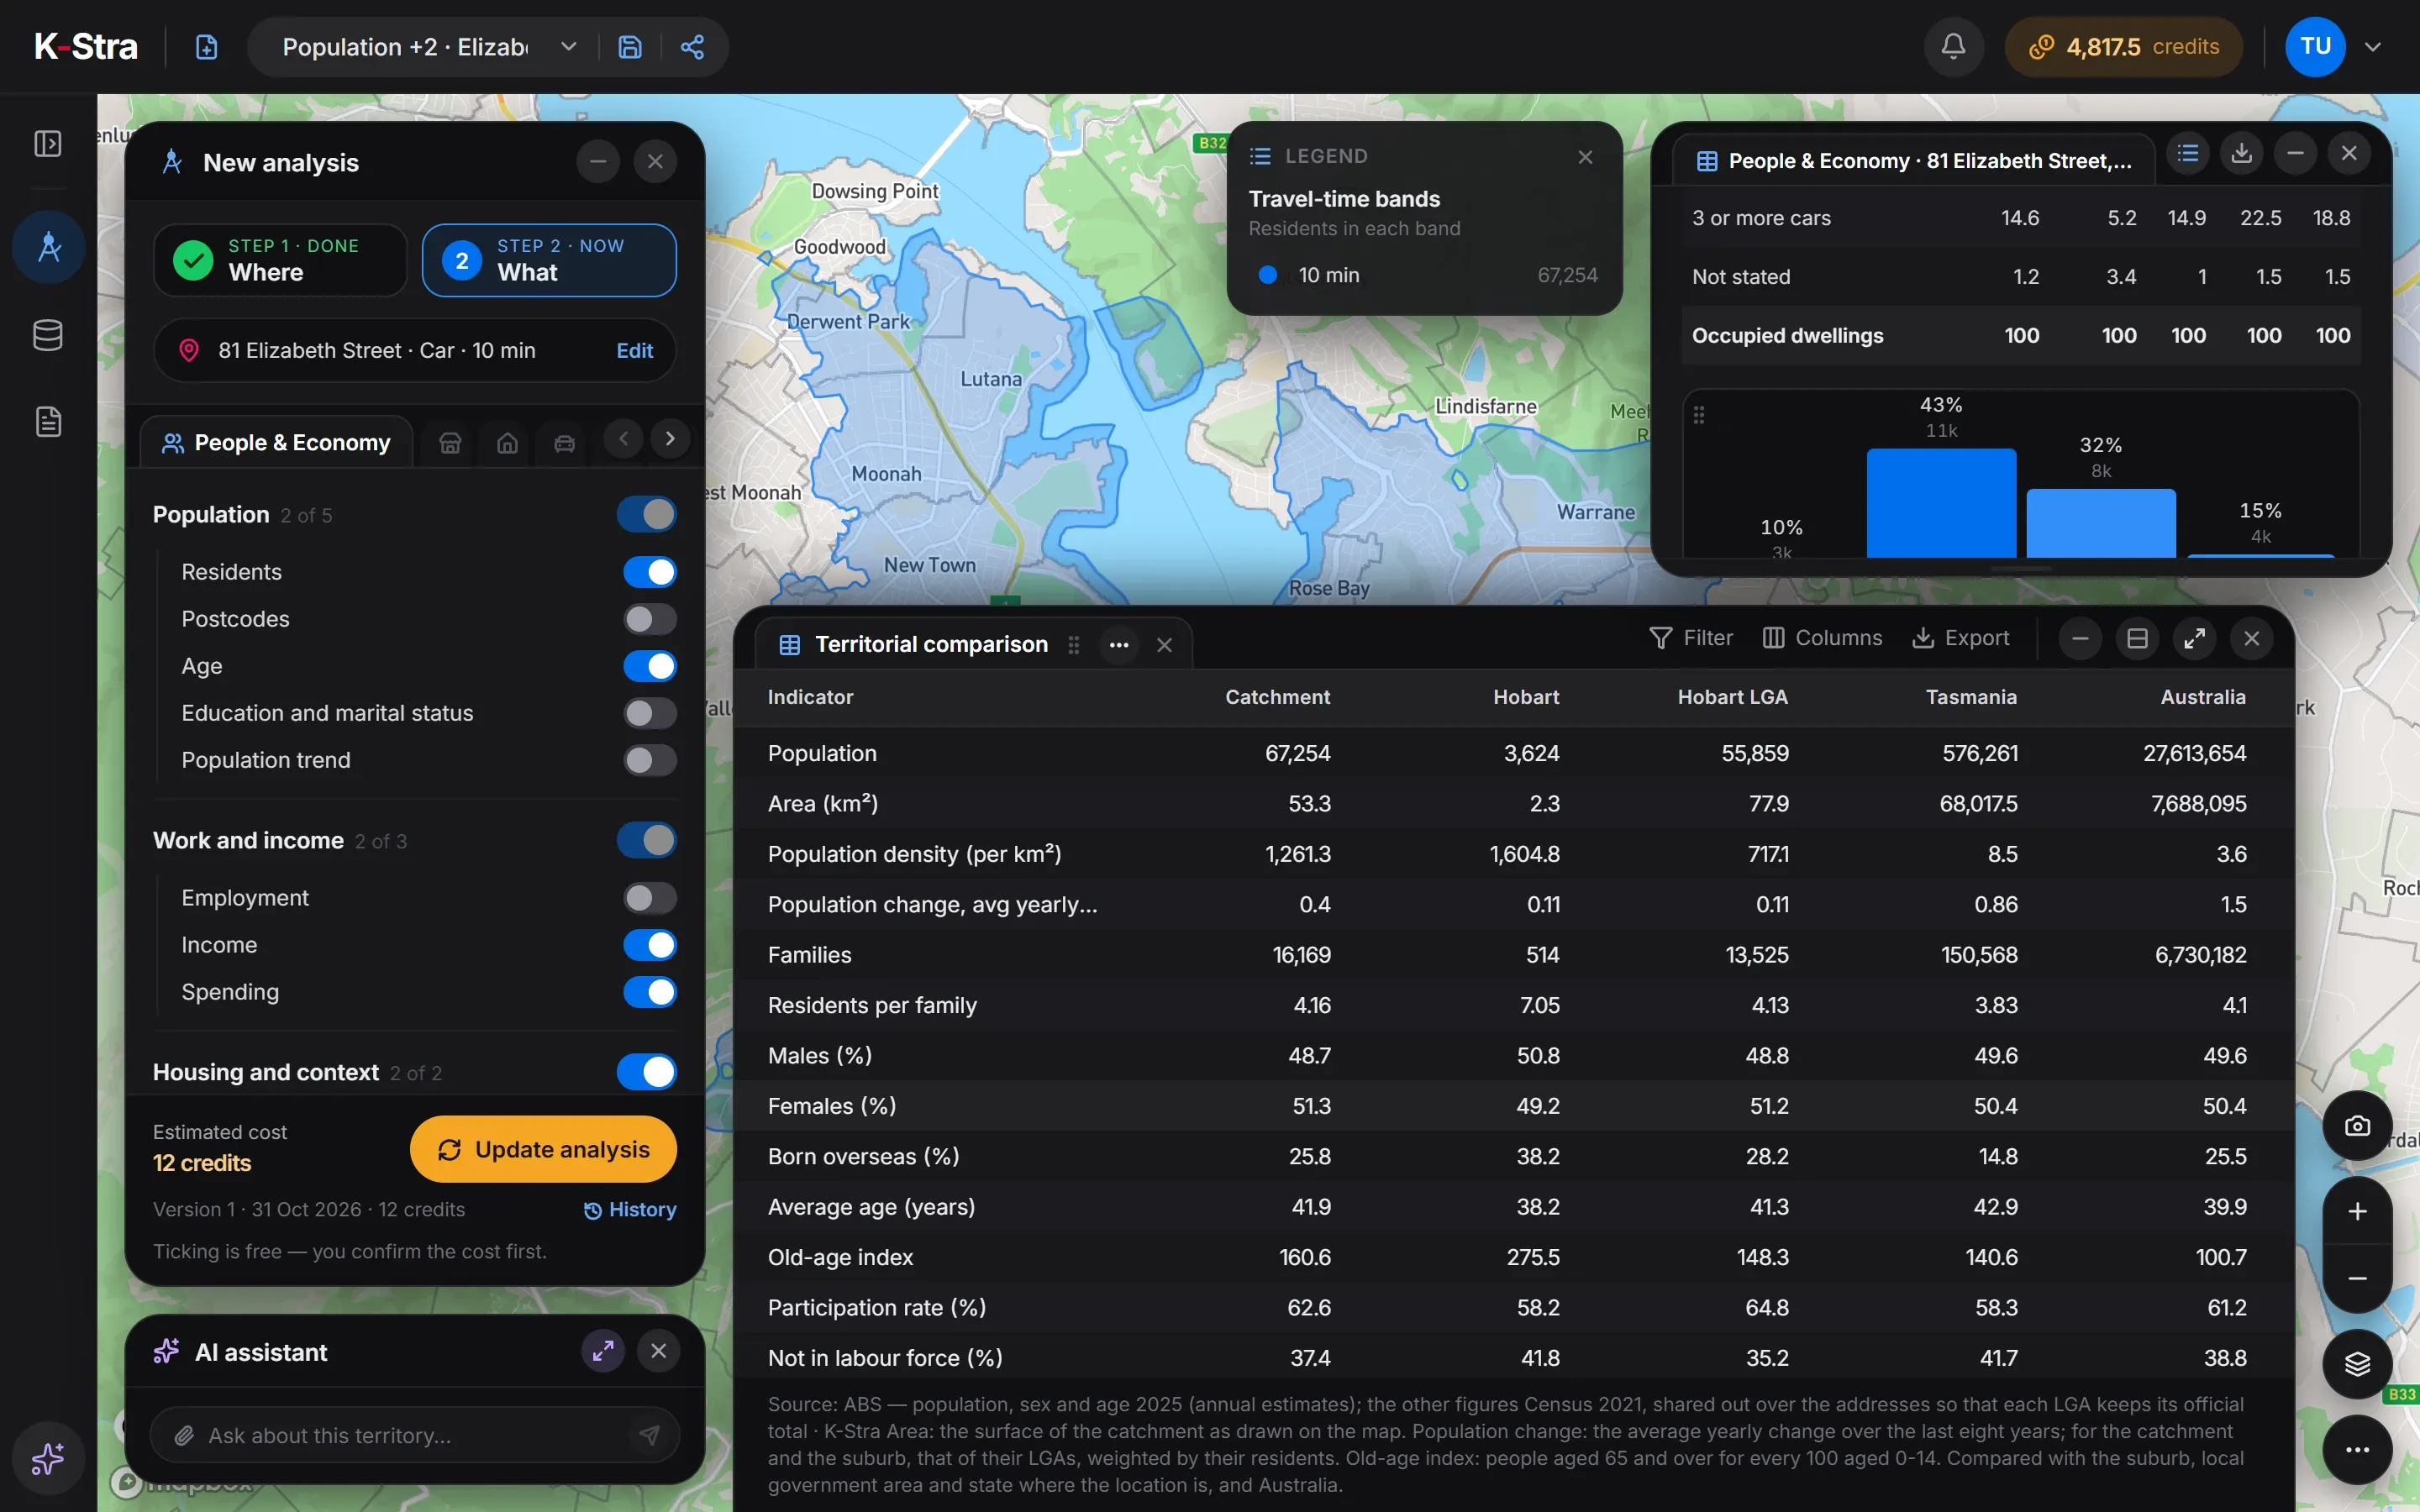 Territorial comparison
The suburb column is the most surprising. The suburb of Hobart, the city centre, has 3,624 residents: 34.3% are in their twenties, 65.6% of homes are rented and 23.5% have no car.
Ten minutes by car change the picture. Across the whole catchment only 36.2% of homes are rented and 10.2% have no car, closer to the council than to the centre. A shop that relies on foot traffic and one that relies on parking are reading two different columns.
What does a demographic profile look like?
A 10-minute drive from 81 Elizabeth Street, Hobart TAS, in average traffic, reaches 67,254 residents in 16,169 families. Their spending comes to about A$3.44 billion a year, or A$51,185 per resident against A$52,583 for Australia.
| Indicator | Catchment | City of Hobart | Tasmania | Australia |
|---|---|---|---|---|
| Residents, 2025 | 67,254 | 55,859 | 576,261 | 27,613,654 |
| Average age, 2025 (years) | 41.9 | 41.3 | 42.9 | 39.9 |
| Aged 65 and over, 2025 (%) | 20.4 | 18.8 | 22.4 | 17.5 |
| Aged under 15, 2025 (%) | 12.7 | 12.7 | 15.9 | 17.4 |
| Born overseas (%) | 25.8 | 28.2 | 14.8 | 25.5 |
| Homes rented, 2021 (%) | 36.2 | 35.6 | 26.4 | 30.6 |
| Flats and apartments, 2021 (%) | 15.9 | 18.8 | 5.3 | 14.2 |
| Homes with no car, 2021 (%) | 10.2 | 9.6 | 6.0 | 7.3 |
| Income index, 2022–23 (Australia = 100) | 97.2 | 98.7 | 90.3 | 100 |
Sources: K-Stra analysis of 31 October 2026: 10-minute drive in average traffic from 81 Elizabeth Street, Hobart. Residents, age and sex: ABS Estimated Resident Population at 30 June 2025, spread onto addresses by K-Stra. Housing, cars and birthplace: ABS Census 2021. Income index: ABS Personal Income 2022–23. Spending: ABS national accounts (5204.0), 2024–25.
How much does a demographic analysis cost?
You pay per topic, not per resident or per square kilometre: the Hobart profile above costs the same as one covering all of Sydney. Residents alone cost 2 credits; all ten topics cost 20.
Reopening a saved analysis, switching the comparison on and off and downloading its tables are free, as many times as you like.
- People & Economy, 6 topics2 credits per topic12 credits
- Drive-time area, any sizeFree
- Compare with the area, exports, area dashboardsFree
- Total= 12 credits
- ≈ A$18 at the Single report pack rate of A$1.53 a credit; less with larger packs and monthly plans. A new free account’s 40 welcome credits cover it.
The estimate appears before anything runs; a run that fails is not charged.
What else do people ask about demographic analysis?
Which year are the figures from?
Residents, age and sex come from the ABS estimates at 30 June 2025. Housing, cars, education, work and birthplace come from the 2021 Census, because the 2026 Census results start in June 2027. The income index uses ABS personal income for 2022–23, and spending the national accounts for 2024–25. Every table in K-Stra shows its year and source.
What do the income and consumption indices mean?
Both put an area on a scale where 100 is the Australian average, weighted by population. An income index of 97.2 means residents earn about 3% less per head than the national average. The consumption index follows income, because households with more income spend more but not in the same proportion.
Does the analysis count people who work or study in the area?
No. Every figure is about residents. A city centre has many more people in the day than at night: the suburb of Hobart has 3,624 residents, while office workers, students and visitors do not appear in any table.
What if the area crosses a council border?
The residents are split by council, and every council is counted. In the Hobart example 22,418 of the 67,254 residents live in Clarence and Glenorchy. The “LGA” column of the comparison is the council where the address sits, so it is a reference, not the area itself.
Can I analyse a council or a postcode instead of a drive time?
Yes. An analysis can cover up to 12 administrative areas — states, SA4 regions, councils, postcodes or suburbs — or up to 10 shapes you draw on the map. The topics and the cost per topic are the same whatever the area.
Can I shade the map by age or income?
Not from this analysis: its results are tables and charts, and the map shows the area. Clicking the name of a council on the map opens a free dashboard of that area, and your own figures by area can colour the map through My Data.
Type an address,
meet the neighbours.
Keep the default drive times, tick the topics you need and read them against the council, the state and Australia.
Open the app — free to exploreComparing with the area is free