
Where are Australia’s youngest and oldest communities?
Age decides what an area buys. A ranking of the 231 councils with more than 20,000 residents by median age, children and over-65s, with the services each group uses counted against it.
Australia’s oldest councils are on the coast: Eurobodalla on the NSW South Coast has a median age of 55.0, against 38.5 nationally. The youngest are city centres full of students, led by the City of Melbourne at 29.5, and the outer suburbs, where Wyndham has the highest share of children: 25.0% under 15.
Which Australian councils have the oldest population?
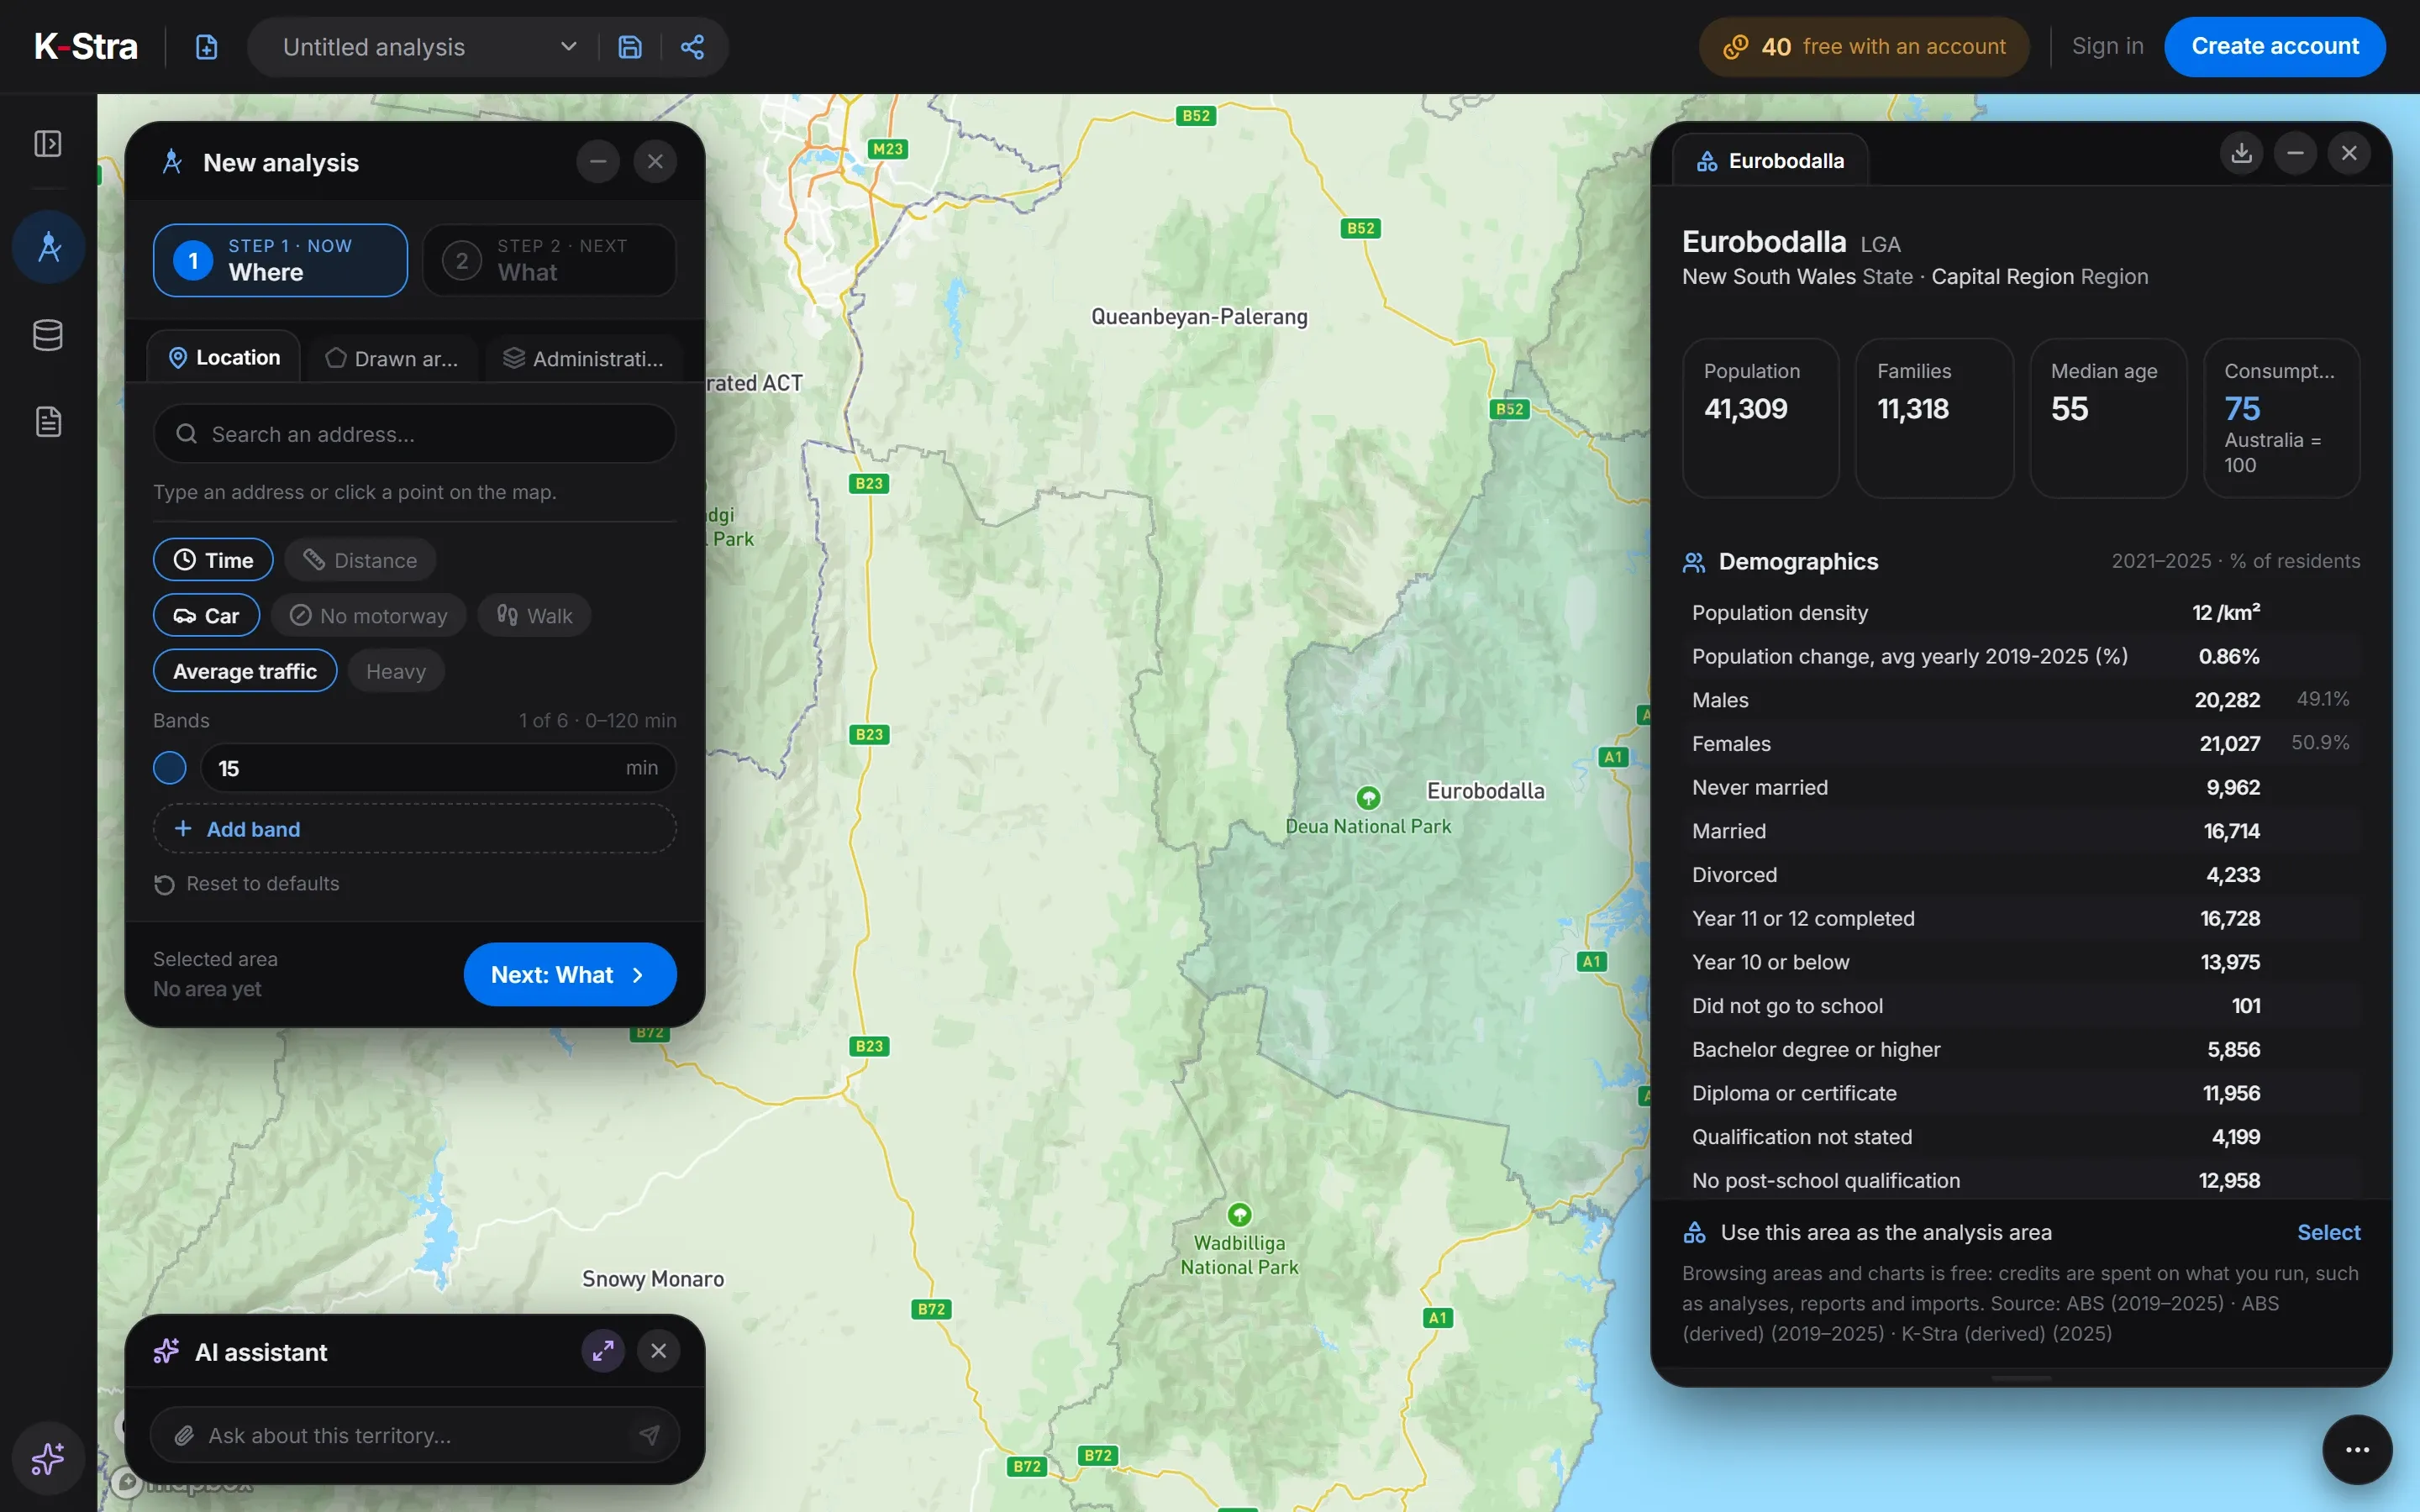 Free area dashboard · Eurobodalla
Nine of the ten oldest councils are on the coast, from the NSW South Coast and Mid North Coast to Gippsland and the Fraser Coast; the tenth, Mount Alexander around Castlemaine, is in central Victoria. In Eurobodalla more than a third of residents are 65 or over.
Eleven councils with more than 20,000 residents have a median age of 50 or more; 27 have one under 35. Between the oldest and the youngest council the median age differs by 25.5 years.
| Council | State | Residents 2025 | Median age | Aged 65 and over | Average yearly change |
|---|---|---|---|---|---|
| Eurobodalla | NSW | 41,309 | 55.0 | 34.5% | 0.86% |
| Mid-Coast | NSW | 99,448 | 54.4 | 34.8% | 0.81% |
| Alexandrina | SA | 31,427 | 54.2 | 34.5% | 2.16% |
| East Gippsland | VIC | 49,669 | 53.0 | 33.1% | 0.77% |
| Bega Valley | NSW | 36,921 | 52.6 | 31.6% | 0.90% |
| Nambucca Valley | NSW | 21,237 | 52.4 | 32.0% | 0.90% |
| Bass Coast | VIC | 44,377 | 52.2 | 31.8% | 3.09% |
| Mount Alexander | VIC | 20,939 | 52.2 | 30.9% | 1.05% |
| Fraser Coast | QLD | 122,924 | 51.9 | 31.4% | 2.28% |
| Noosa | QLD | 59,551 | 51.2 | 29.2% | 1.04% |
| Australia | 27,613,654 | 38.5 | 17.5% | 1.50% |
ABS population by five-year age group at 30 June 2025; median age worked out from the age groups. Average yearly change 2019–2025 worked out as in the K-Stra area dashboard: (2025 ÷ 2019 − 1) ÷ 6 years.
Which councils are youngest, and where do families with children live?
There are two kinds of young council. City centres have the lowest median ages but very few children: in the City of Melbourne only 5.3% of residents are under 15, because the young adults there are students and early-career renters.
Families with children concentrate on the growing edges of the capitals. Wyndham, Camden and Melton have about a quarter of their residents under 15, and so do Palmerston near Darwin and the mining town of Karratha.
| Council | State | Residents 2025 | Median age | Aged under 15 | Aged 65 and over |
|---|---|---|---|---|---|
| Melbourne | VIC | 194,481 | 29.5 | 5.3% | 6.3% |
| Adelaide | SA | 30,173 | 31.7 | 4.5% | 15.1% |
| Palmerston | NT | 43,193 | 32.3 | 24.5% | 6.9% |
| Karratha | WA | 25,429 | 33.0 | 23.7% | 3.8% |
| Strathfield | NSW | 49,203 | 33.1 | 13.2% | 11.9% |
| Perth | WA | 35,673 | 33.1 | 5.4% | 10.9% |
| Burwood | NSW | 43,927 | 33.2 | 10.2% | 14.5% |
| Sydney | NSW | 241,797 | 33.3 | 6.9% | 9.2% |
| Melton | VIC | 231,567 | 33.3 | 24.3% | 8.9% |
| Playford | SA | 115,790 | 33.3 | 22.5% | 12.3% |
| Council | State | Residents 2025 | Aged under 15 | Children under 15 | Median age |
|---|---|---|---|---|---|
| Wyndham | VIC | 347,830 | 25.0% | 86,952 | 33.4 |
| Camden | NSW | 146,483 | 24.8% | 36,392 | 33.5 |
| Palmerston | NT | 43,193 | 24.5% | 10,573 | 32.3 |
| Melton | VIC | 231,567 | 24.3% | 56,218 | 33.3 |
| Serpentine-Jarrahdale | WA | 40,531 | 23.8% | 9,636 | 33.6 |
| Karratha | WA | 25,429 | 23.7% | 6,030 | 33.0 |
| Playford | SA | 115,790 | 22.5% | 26,071 | 33.3 |
| Central Highlands (Qld) | QLD | 29,481 | 22.5% | 6,625 | 34.9 |
| Ipswich | QLD | 268,272 | 22.4% | 60,085 | 33.8 |
| Armadale | WA | 113,003 | 22.4% | 25,362 | 35.1 |
| Australia | 27,613,654 | 17.4% | 4,803,134 | 38.5 |
ABS population by five-year age group at 30 June 2025; median age worked out from the age groups
Do childcare and aged care follow the people who need them?
Only partly. The 20 councils with the highest share of children have 28.3 childcare centres per 10,000 children, below the national 30.1; the 20 oldest councils have 13.9 aged care and retirement businesses per 10,000 residents over 65, against 14.3 for Australia.
Other services follow age more closely. The oldest councils have 3.1 pharmacies per 10,000 residents, above the national 2.6 and well above the youngest-family councils, and, perhaps less expected, more gyms and fitness studios per resident too.
| Group | Residents | Childcare per 10,000 under 15 | Aged care per 10,000 over 65 | Pharmacies per 10,000 | Gyms per 10,000 |
|---|---|---|---|---|---|
| The 20 oldest councils | 1,089,356 | 33.1 | 13.9 | 3.1 | 8.9 |
| The 20 councils with most children | 3,635,347 | 28.3 | 11.6 | 1.8 | 4.9 |
| Australia | 27,613,654 | 30.1 | 14.3 | 2.6 | 7.1 |
K-Stra places catalogue, October 2026, as the app classifies each business; residents at 30 June 2025. Aged care counts the listed businesses of the app’s aged care and retirement living sector, not beds. Councils with more than 20,000 residents.
How should age change a location decision?
Median age summarises, but a business serves a slice: a childcare centre needs the number of children within ten minutes, an aged care operator the number of residents over 70. Both are in the age classes of every area in K-Stra, free to browse.
Age also hints at the future market. Coastal councils with old populations depend on newcomers to keep growing, while the young outer suburbs will need secondary schools and teen services in ten years, not only childcare today.
What else do people ask about age?
What is the oldest council in Australia?
Among councils with more than 20,000 residents, Eurobodalla on the NSW South Coast, with a median age of 55.0 in 2025 and 34.5% of residents aged 65 or over.
Which council has the most children?
Wyndham, in Melbourne’s west, has the highest share of residents under 15 (25.0%) and 86,952 children in total.
How is the median age worked out?
From the ABS population by five-year age group at 30 June 2025, interpolating within the group where half the residents are older and half younger, as the K-Stra area dashboard does.
Can I count children or seniors around a site?
Yes. A K-Stra catchment analysis adds up residents by age class inside the drive time you choose; browsing the age profile of any area on the map is free.
See the age profile
of any area.
Children, adults and seniors by five-year class, for every council, postcode and suburb, free on the map.
Open the app — free to exploreBrowsing areas and their dashboards is free; you pay only for the analyses you run