
How do I choose a location for a supermarket?
Grocery shopping is a weekly trip by car, and every supermarket along the way takes its share. Here is how to read a site the way the market does.
Choose a supermarket location by measuring the residents and the grocery spending within about a ten-minute drive, then the supermarkets already pulling on the same streets, weighed by their size. Compare the stores per 10,000 residents with the council, the state and Australia, and look for places where spending is high and competition thin.
Which grocery formats does K-Stra map?
K-Stra sorts grocery retail into six sectors, each analysed on its own: a supermarket is not measured against a petrol-station convenience store, and a liquor store has its own market. The counts come from 2M+ Australian businesses in public online listings, refreshed every month.
Formats still compete across the line. That is why a supermarket analysis can add the neighbouring categories — the other grocery formats, pharmacies, cafés, take-away, fuel stations, post offices, banks and shopping centres — counted per 10,000 residents in the same area.
| Sector in the app | Locations | What it counts |
|---|---|---|
| Supermarkets | 8,070 | Full-line supermarkets and larger grocers, chains and independents. |
| Hypermarkets | 27 | Very large stores selling groceries and general merchandise. |
| Discount stores | 838 | Discount variety and grocery stores. |
| Minimarkets & convenience stores | 6,694 | Convenience stores, corner shops and small grocers. |
| Cash & carry and wholesale clubs | 3,897 | Wholesale clubs and trade grocery suppliers. |
| Liquor stores | 7,629 | Bottle shops and liquor chains. |
Source: the Grocery & Food retail group in the sector list of the K-Stra app on 1 November 2026, with the names the app uses; business catalogue of 23 October 2026, built from public online business listings. The counts here are the whole catalogue, as on the Australia pages; the national figure in the per 10,000 table of the example below counts only the locations K-Stra can place on an Australian address, so it can be a few places lower, which moves its rate by at most a hundredth.
Which numbers matter most for a supermarket?
Residents within a 10-minute drive
The K-Stra sector model measures supermarket demand on a 10-minute drive, because that is the trip most households make for a weekly shop. A walking radius undercounts it, a 30-minute radius dilutes it.
In the app: the Where step, then People & Economy for who those residents are.
Grocery spending within reach
Residents of the Wagga Wagga example spend about A$2,082 a head a year on what supermarkets sell, from ABS household spending for 2024–25. Spending, not headcount, is what a store competes for.
In the app: the Demand map and its table of resident spending by band.
Supermarkets per 10,000 residents
Australia has 2.92. A catchment far above that is crowded or a centre serving a wider region; far below it may be under-served, or simply too thin to support a store.
In the app: the table of stores per 10,000 residents for the catchment, the council, the state and Australia.
Size of the competitors
A full-line chain store and a corner grocer are not equal rivals. The model weighs each store, and estimated annual sales bands show which ones carry the market.
In the app: the competition map and the store table, with estimated annual sales switched on.
Market gap and the right building
Where spending within reach is high against the competition already there, a newcomer has room. A site also needs the floor area of the format: the best locations say when nearby buildings are below it.
In the app: the Market gap and Opportunity maps, and the five best locations at least 500 m apart.
What data do you need to assess a supermarket site?
Stores, residents and spending, already loaded and kept up to date. You can add your own stores from a spreadsheet if you want them on the same map.
Every grocery store
8,070 supermarket locations and five more grocery sectors, with address, rating and number of reviews, from public online business listings.
Business and competition dataResidents
ABS population estimates at 30 June 2025, spread address by address, so a catchment counts the people who live inside it.
Population dataSpending in the sector
Household spending from the ABS national accounts for 2024–25, assigned to supermarkets, which drives demand and opportunity.
Work, income and spendingEstimated annual sales
For existing stores: a sales band with its confidence, high or medium for chains, low for most independents. Estimates, not reported figures.
Competitor analysis
K-Stra runs on a dedicated server in Sydney: your datasets, your analyses and your results stay in Australia. Map tiles, payments and sign-in never see your files. Three steps can: geocoding sends only the address text, and only after you confirm; the AI assistant reads column names and values when you ask it about a dataset; email notifications carry figures from your analysis.Where your data lives. Mark a dataset “session only” and it is deleted 24 hours after upload.
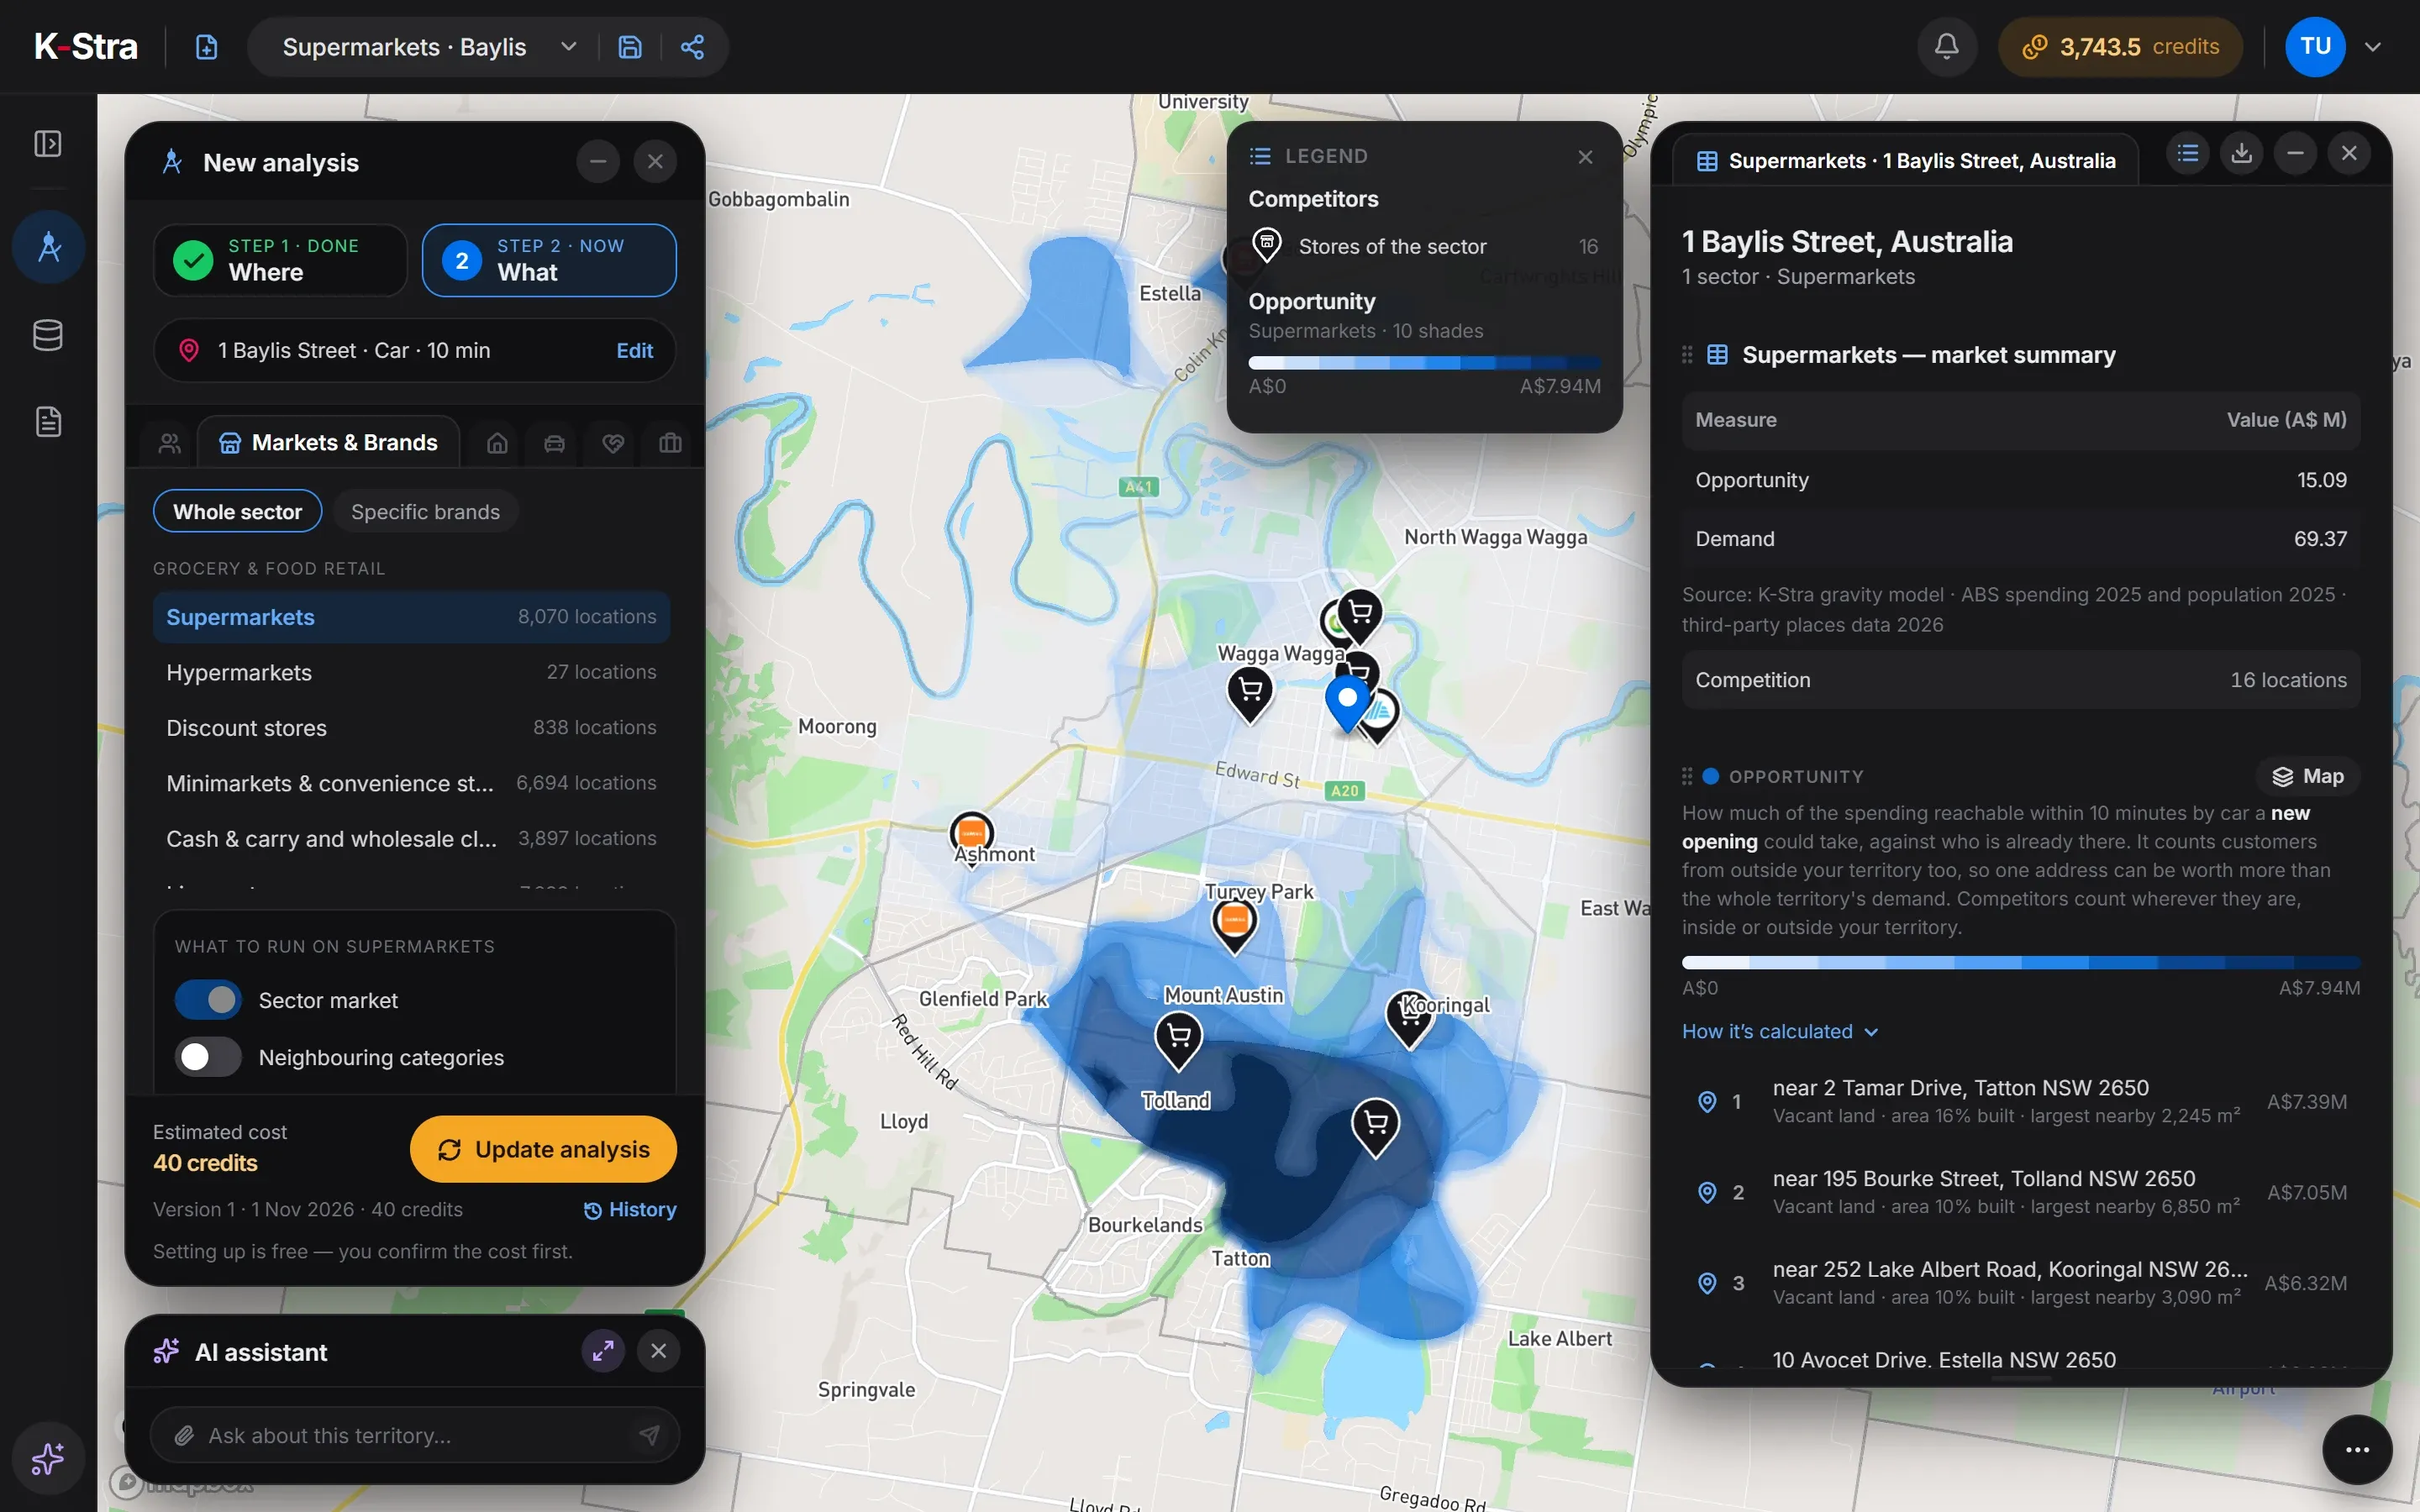
How do you analyse a supermarket site in K-Stra?
Type the address, keep a 10-minute drive, open Markets & Brands and pick Supermarkets as a whole sector. Switch on estimated sales of the stores, which is free for now.
- WhereAn address and a 10-minute drive, the reach the sector model uses for supermarkets. The surface of the area does not change the price.
- WhatMarkets & Brands, whole sector, Supermarkets. Add estimated sales and, if you like, the neighbouring categories.
- ReadOpportunity, demand, competition and market gap on the map, every store in a table, and five best locations at least 500 m apart.
From the same result, Compare sites tests one to five candidate addresses against the supermarkets already there: how much of the residents’ spending each would capture, as a range, and which stores it would take it from. It counts residents’ spending only, so it ranks sites of the same sector and area; the absolute value is an order of magnitude, and workers, commuters, tourists and passing trade are not in it.
What does a supermarket analysis show?
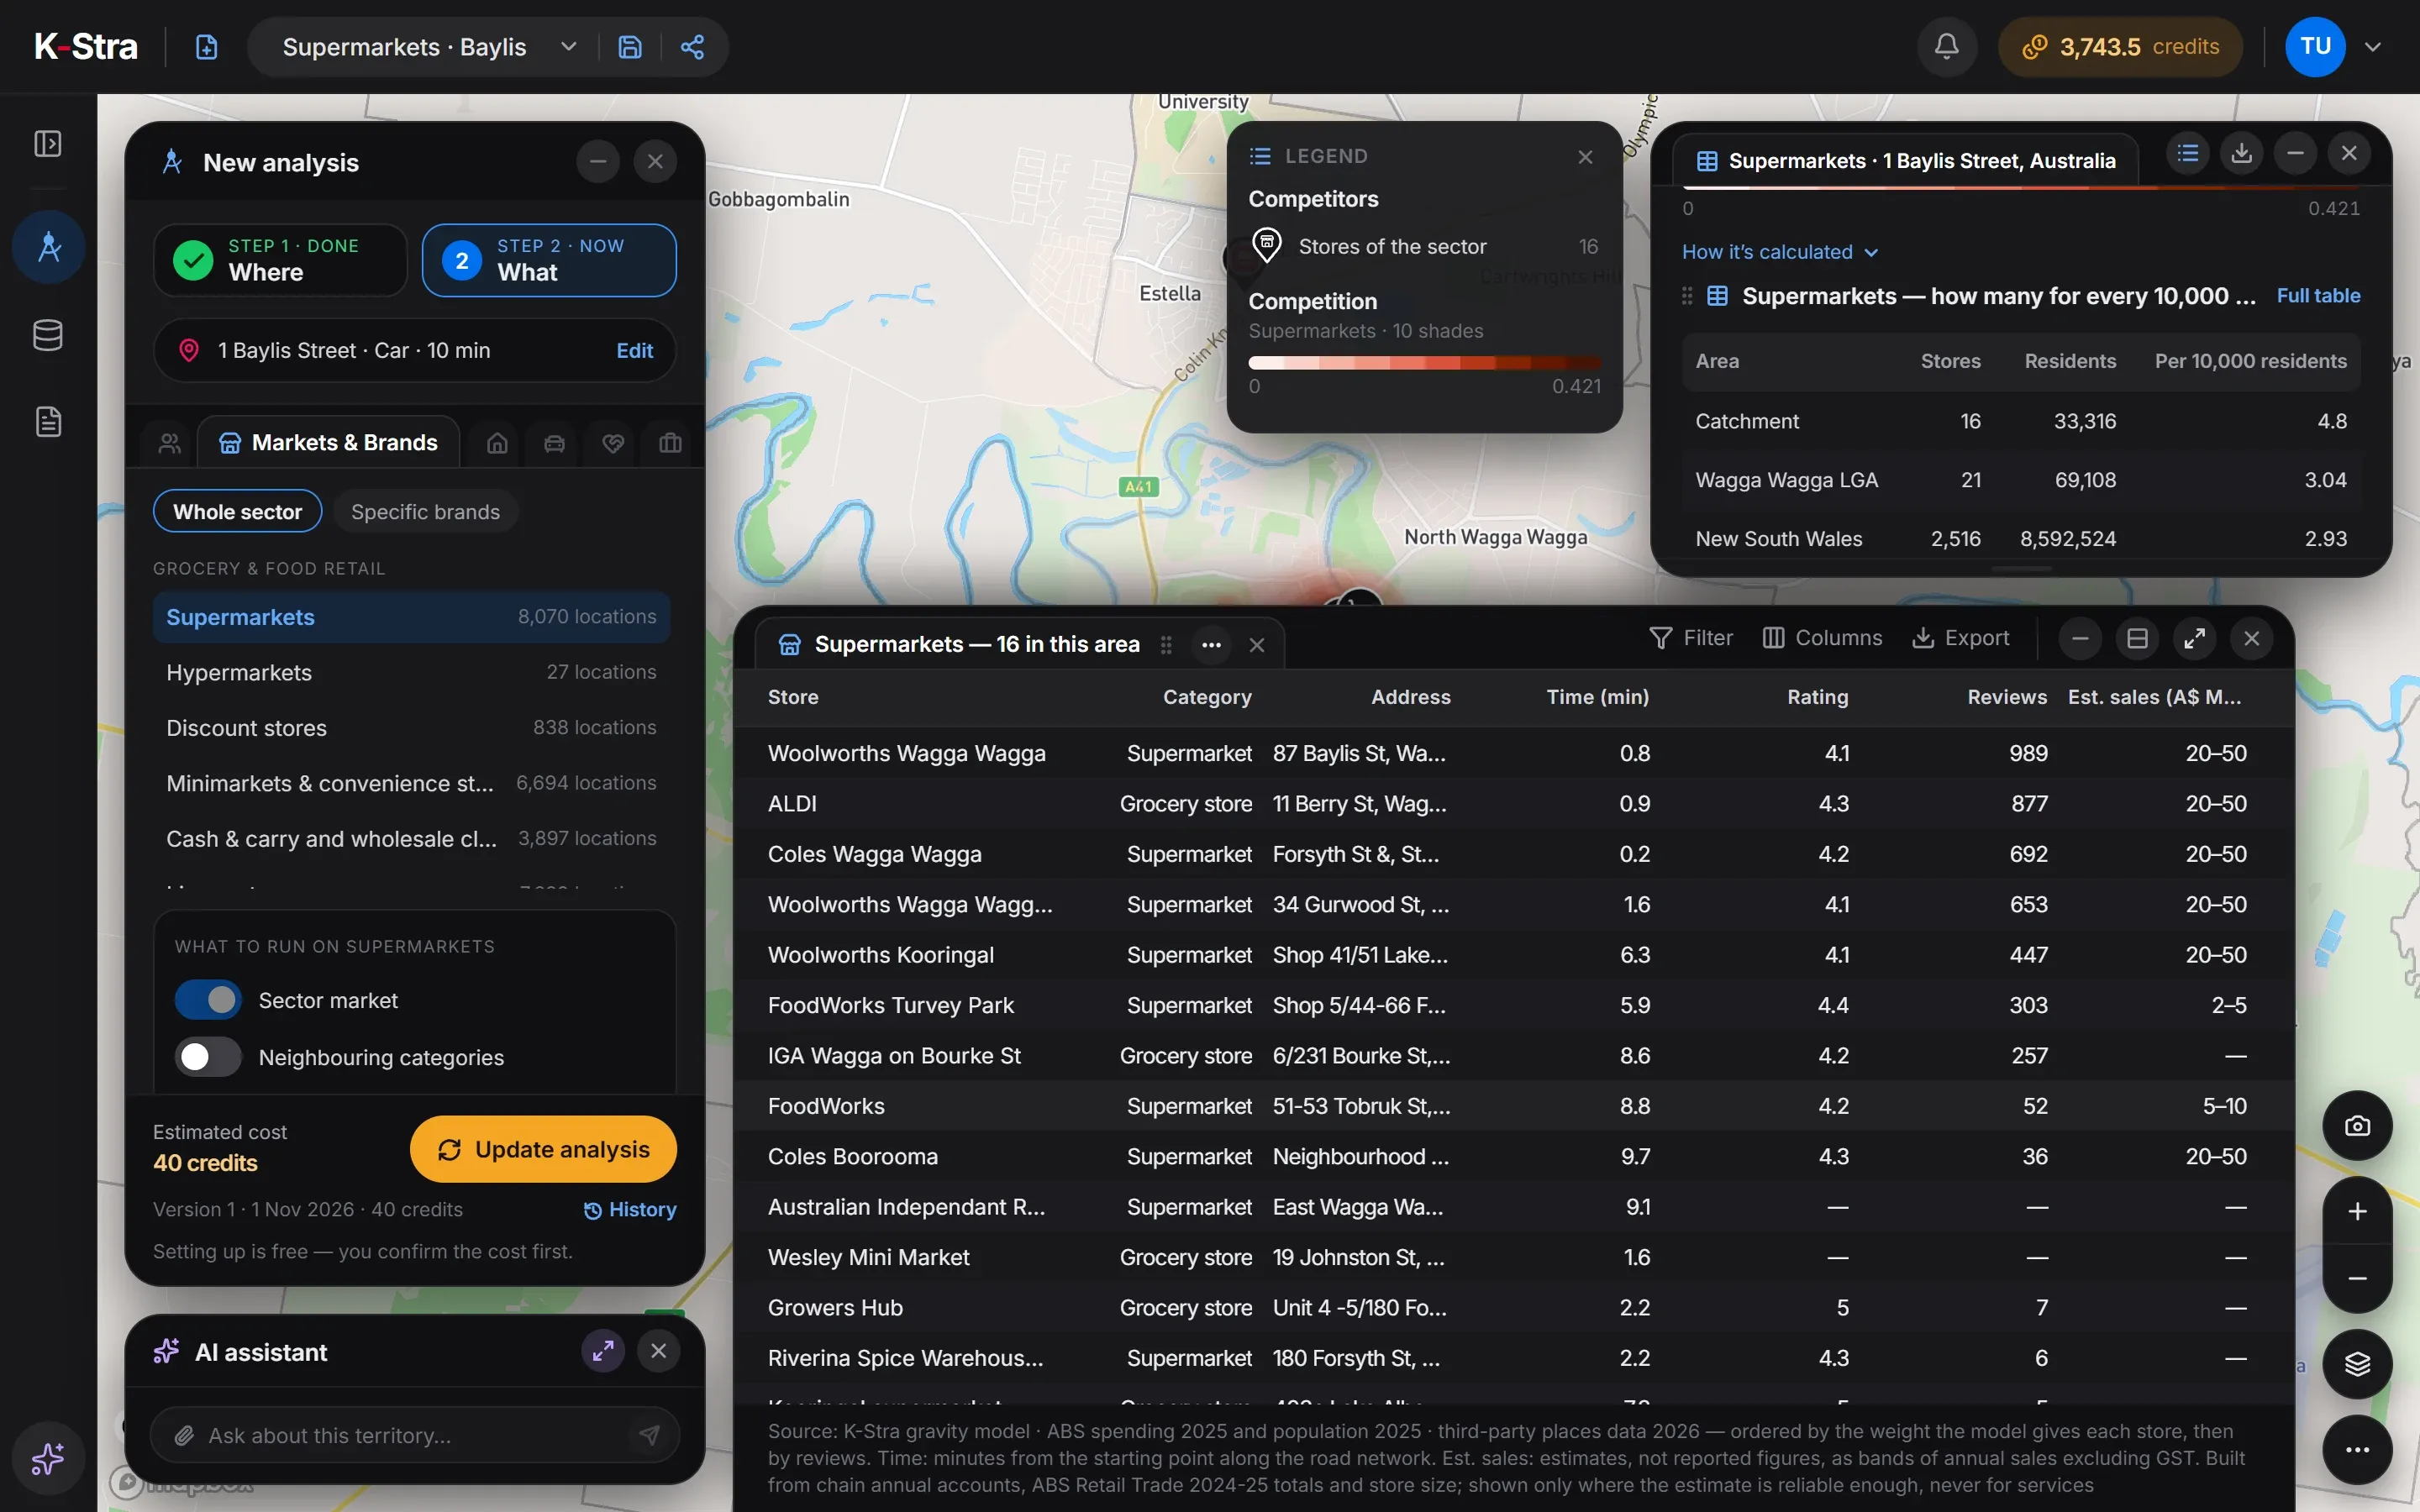
Supermarkets within 10 minutes by car of 1 Baylis Street, Wagga Wagga NSW: 16 stores for 33,316 residents, 4.8 per 10,000 against 2.92 in Australia. Residents of the catchment spend about A$69.4 million a year on what supermarkets sell. 8 of the 16 stores have a visible estimate of annual sales, 6 of them chain stores in the A$20–50M band; the other 8, mostly small grocers, have none.
| Area | Stores | Residents | Per 10,000 residents |
|---|---|---|---|
| Catchment | 16 | 33,316 | 4.80 |
| Wagga Wagga (council) | 21 | 69,108 | 3.04 |
| New South Wales | 2,516 | 8,592,524 | 2.93 |
| Australia | 8,066 | 27,613,654 | 2.92 |
Sources: K-Stra analysis of 1 November 2026: supermarkets within a 10-minute drive in average traffic of 1 Baylis Street, Wagga Wagga. Stores: K-Stra places catalogue, October 2026. Residents: ABS population estimates at 30 June 2025. Spending: ABS national accounts, 2024–25. Estimated annual sales: estimates, not reported figures, built from chain annual accounts, store size and ABS Retail Trade totals for 2024–25.
Is Wagga Wagga over-supplied with supermarkets?
Not as much as the density suggests. 4 of the 16 stores stand within two minutes of the starting point, in the centre of a regional city whose council area has 69,108 residents. They serve people who drive in from across the city and beyond, while the density counts only the 33,316 who live within ten minutes.
The opportunity map tells the other half. The three best locations lie near 2 Tamar Drive, Tatton; 195 Bourke Street, Tolland; and 252 Lake Albert Road, Kooringal: southern suburbs where spending is high and the central stores pull less. That is where another chain store, or a strong independent, would face the least competition.
 Stores · Wagga Wagga
How much does a supermarket analysis cost?
The Wagga Wagga example cost 40 credits on 56.5 km². A whole city would cost the same: you pay for the sector, not the size of the area.
Who the residents are — age, families, income — is People & Economy, at 2 credits a topic, in a separate analysis of the same area.
- Markets & Brands, Supermarketsper sector, any area40 credits
- Estimated annual sales of the storesFree for nowFree
- Maps, tables and exports of the resultsFree
- Total= 40 credits
- ≈ A$61 at the Single report pack rate of A$1.53 a credit; less with larger packs and monthly plans. A new free account’s 40 welcome credits cover it.
Optional, not in the total
- Neighbouring categoriesper set+ 2 credits
- Compare candidate sitesper candidate site+ 20 credits
The estimate appears before the run starts, and a run that fails costs nothing.
What do people opening a supermarket ask next?
Which of my candidate sites is stronger?
Put one to five addresses through the same model and compare the residents’ spending each could capture, and from whom, before you sign a lease. It counts residents’ spending only, so use it to compare sites in the same sector and area: the absolute value is an order of magnitude, and workers, commuters, tourists and passing trade are not in it.
Retail site selectionWill a new store take sales from my own?
For a chain, the residents a new store shares with existing ones matter as much as the gap it fills. Measure the overlap of the catchments first.
Cannibalisation analysisHow big is the grocery market here?
Residents within a drive time, what they spend on groceries each year and how many stores already share it, area by area.
Market potential analysis
What else do people ask about supermarket locations?
How many residents does a supermarket need in Australia?
On average there is one supermarket or grocery store for every 3,423 Australians: 8,066 stores for 27,613,654 residents, or 2.92 per 10,000. The figure includes small independent grocers, so a full-line supermarket draws on far more people than that, usually from a wider drive.
Can K-Stra tell me the sales of the supermarkets around my site?
For existing stores, yes: an estimated annual sales band such as A$ 20–50 million, with its confidence, built from chain annual accounts, ABS Retail Trade totals for 2024–25 and store size. Chain stores and stores with a measured size have high or medium confidence; independents a rougher, low-confidence band. They are estimates, not reported figures, and the estimate is free for now.
Does K-Stra give a sales figure for a new supermarket?
No. For a candidate site K-Stra models how much of the catchment residents’ spending it could capture and which stores it would take it from. It counts residents’ spending only, so it is useful to compare sites in the same sector and area; the absolute value is an order of magnitude, and workers, commuters, tourists and passing trade are not in it. See retail site selection.
Are discount stores and convenience stores counted as supermarkets?
No, each is its own sector: supermarkets, hypermarkets, discount stores, minimarkets and convenience stores, cash and carry, and liquor stores. One analysis runs one sector; the option “Neighbouring categories” counts the other grocery formats and related businesses around it for 2 credits more.
Why does a town centre show so many supermarkets per resident?
Because stores in a centre serve everyone who comes into town, not only the residents of the catchment. Density compares stores with residents alone, so in centres, regional hubs and tourist towns it reads high. Read it next to the market gap, which weighs spending against the pull of every store nearby.
See the grocery market
around your site.
Type an address, pick Supermarkets and read demand, competition and the gaps on one map.
Open the app — free to exploreEstimated sales are free for now; you pay only for the analyses you run