
How many people live in Brisbane, and where is it growing?
One giant council, two fast-growing neighbours and a bay of islands: Brisbane is a young city whose averages hide sharp differences between postcodes.
Greater Brisbane had 2,832,646 residents at 30 June 2025 and grew about 13.3% from 2019 to 2025, on average about 2.22% a year. A 45-minute drive from Queen Street reaches 2,591,207 people, 91.5% of the metropolitan population. Ipswich and Logan grow fastest; the highest incomes are in the inner west and the bayside east.
How many people live within 15, 30 and 45 minutes of central Brisbane?
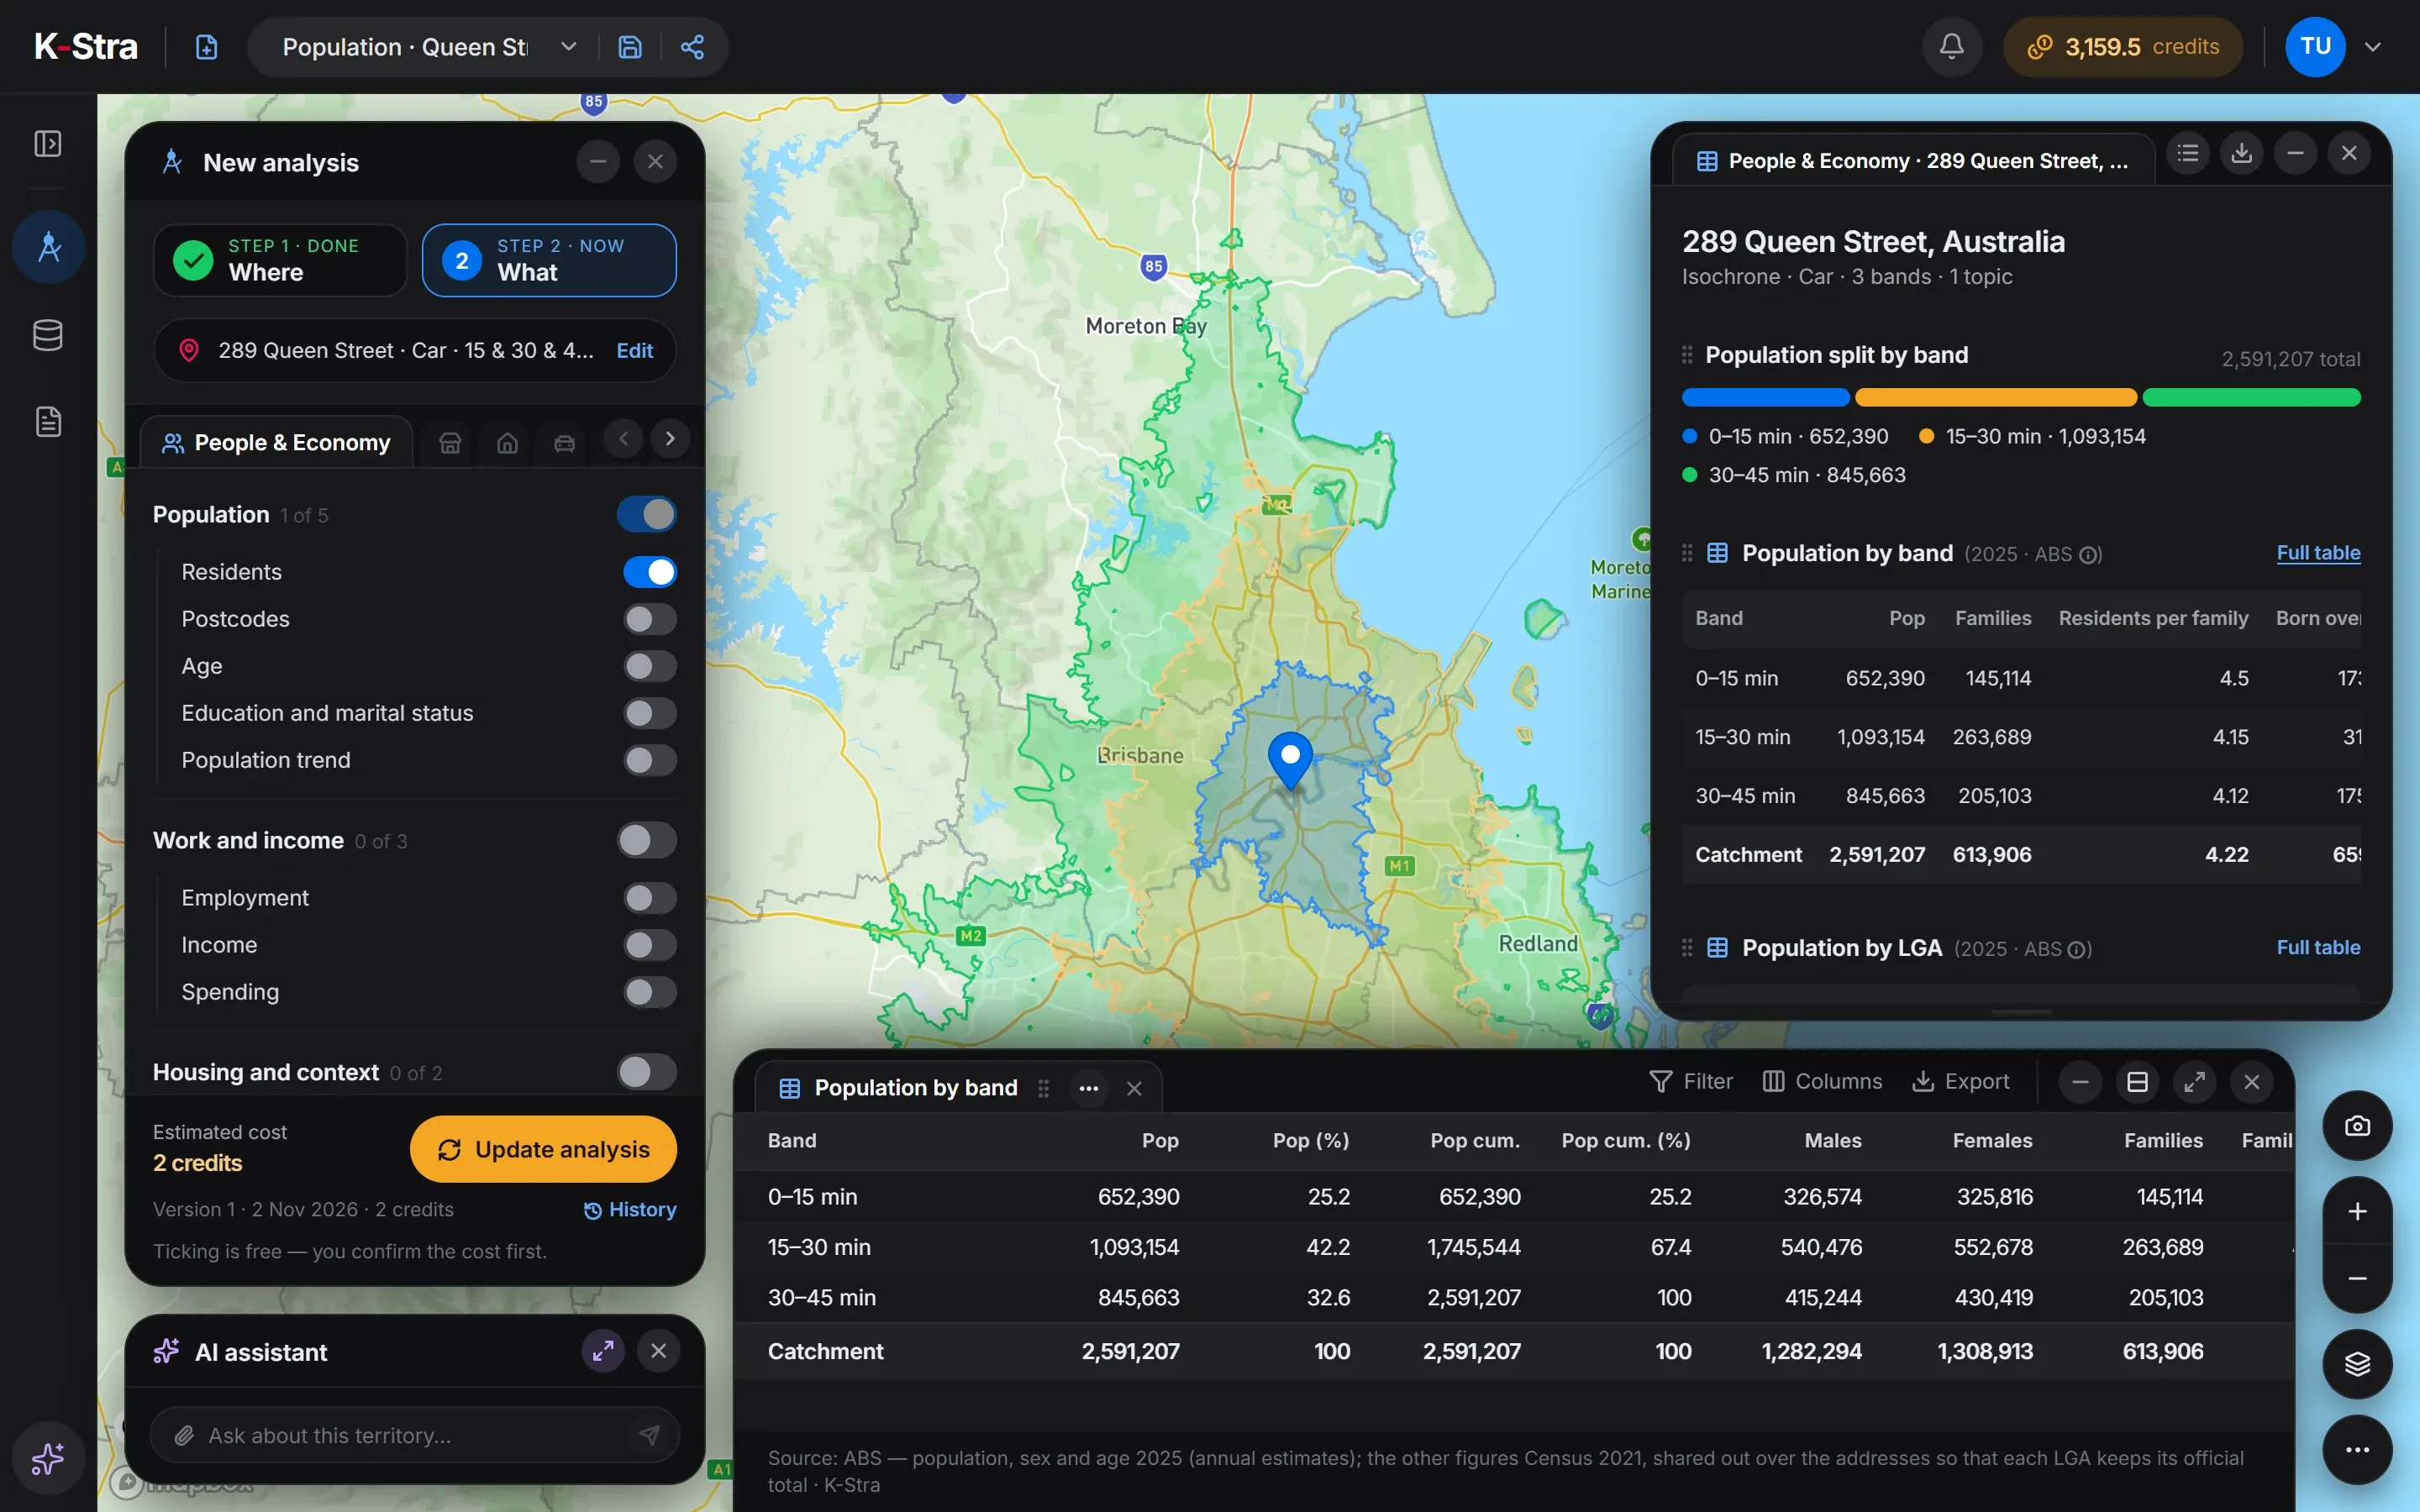 People & Economy · Brisbane
From 289 Queen Street, 652,390 people live within 15 minutes by car, 1,093,154 between 15 and 30 minutes and 845,663 between 30 and 45. The 45-minute area covers 2,754 km².
That is 91.5% of Greater Brisbane: the motorways to Ipswich, Logan and Moreton Bay bring almost the whole metropolitan area within three quarters of an hour of the CBD in average traffic.
| Drive time | Residents | Cumulative |
|---|---|---|
| 0–15 min | 652,390 | 652,390 |
| 15–30 min | 1,093,154 | 1,745,544 |
| 30–45 min | 845,663 | 2,591,207 |
Source: K-Stra analysis of 2 November 2026, drive time by car in average traffic from 289 Queen Street; residents from ABS Estimated Resident Population at 30 June 2025, placed on address points.
How does Brisbane change with distance from the centre?
In a straight line, 752,756 people live within 10 kilometres of Queen Street and 2,275,690 within 30. Flats make up 72.7% of homes within 5 km but only 4.3% between 10 and 20 km: outside the inner city, Brisbane is a city of houses.
The income index is highest between 5 and 10 km, at 118.4, and falls to 94.1 between 30 and 50 km. The centre is younger than any other ring, with a median age of 32.8.
| Distance from 289 Queen Street | Residents | Within this distance | Income index | Median age | Flats (2021) | Rented (2021) |
|---|---|---|---|---|---|---|
| 0–5 km | 322,148 | 322,148 | 110.2 | 32.8 | 72.7% | 57.3% |
| 5–10 km | 430,608 | 752,756 | 118.4 | 36.6 | 28.1% | 39.1% |
| 10–20 km | 789,226 | 1,541,982 | 101.7 | 37.6 | 4.3% | 30.9% |
| 20–30 km | 733,708 | 2,275,690 | 98.1 | 35.9 | 5.3% | 37.8% |
| 30–50 km | 541,472 | 2,817,162 | 94.1 | 37.3 | 3.4% | 34.0% |
Straight-line rings counted by K-Stra on every address point, inside or outside the city boundary. Residents and age: ABS 2025; income index: ABS Personal Income 2022–23; flats and renting: ABS Census 2021.
What are the key figures for Greater Brisbane?
| Indicator | Greater Brisbane | QLD | Australia |
|---|---|---|---|
| Residents, 30 June 2025 | 2,832,646 | 5,669,764 | 27,613,654 |
| Average yearly change, 2019–2025 | 2.22% | 1.90% | 1.50% |
| Area | 15,842 km² | 1,730,171 km² | 7,688,095 km² |
| Residents per km² | 178.8 | 3.3 | 3.6 |
| Median age | 36.5 | 38.6 | 38.5 |
| Aged under 15 | 18.0% | 17.7% | 17.4% |
| Aged 65 and over | 14.8% | 17.4% | 17.5% |
| Income index | 102.4 | 96.6 | 100.0 |
| Consumption index | 102.3 | 96.8 | 100.0 |
| Spending per resident, a year | A$53,791 | A$50,902 | A$52,582 |
| Resident spending, a year | A$152.4 billion | A$288.6 billion | A$1,452.0 billion |
| Families (Census 2021) | 674,199 | 1,366,648 | 6,730,182 |
| Homes rented (Census 2021) | 37.6% | 35.7% | 33.6% |
| Flats and apartments (Census 2021) | 20.1% | 17.0% | 19.6% |
Area: the Greater Capital City Statistical Area (ABS ASGS Edition 3). Residents counted by K-Stra on the address points inside it; yearly change: council estimates 2019–2025 weighted by the residents each council brings. Income index from ABS Personal Income 2022–23 (tax data), measured or estimated; consumption index derived from it; 100 = Australia. Spending per resident from the consumption index and ABS national accounts (5204.0) for 2024–25.
Which parts of Brisbane are largest, richest and youngest?
Ipswich is the most populous region of Greater Brisbane, with 420,231 residents, just ahead of Logan – Beaudesert with 419,525; both have an income index below 100 and a median age near 35. The Inner City has an income index of 114.8 and 68.9% of homes in flats.
Moreton Bay – North, which takes in Caboolture and Bribie Island, is the oldest region, with a median age of 42.5 and an income index of 89.4.
| Region (SA4) | Residents 2025 | Median age | Income index | Flats (2021) |
|---|---|---|---|---|
| Ipswich | 420,231 | 35.0 | 96.8 | 1.6% |
| Logan – Beaudesert | 419,525 | 34.6 | 93.6 | 2.8% |
| Brisbane – South | 410,903 | 35.3 | 101.5 | 19.5% |
| Brisbane Inner City | 324,758 | 33.7 | 114.8 | 68.9% |
| Moreton Bay – North | 293,844 | 42.5 | 89.4 | 9.1% |
| Brisbane – East | 261,918 | 42.1 | 104.9 | 5.9% |
| Brisbane – North | 248,017 | 37.6 | 111.9 | 21.0% |
| Moreton Bay – South | 245,139 | 36.3 | 106.4 | 1.8% |
| Brisbane – West | 208,311 | 38.0 | 113.7 | 20.8% |
Which Brisbane councils are growing fastest?
Greater Brisbane has only eight councils, and the Brisbane City Council alone counts 1,375,301 residents. Ipswich grew 22.0% from 2019 to 2025, on average 3.67% a year and Logan 3.35% a year, against 1.71% for Brisbane City.
Every council in the metropolitan area grew; the slowest, Somerset, still added 1.04% a year. Because Brisbane City is so large, its average hides the variety within it: postcodes say more than councils here.
| Council | Residents 2019 | Residents 2025 | Change a year | Median age | Income index |
|---|---|---|---|---|---|
| Brisbane | 1,247,133 | 1,375,301 | 1.71% | 35.8 | 108.6 |
| Moreton Bay | 467,314 | 532,445 | 2.32% | 39.3 | 97.3 |
| Logan | 335,955 | 403,515 | 3.35% | 34.3 | 93.9 |
| Ipswich | 219,893 | 268,272 | 3.67% | 33.8 | 100.5 |
| Redland | 158,937 | 172,831 | 1.46% | 43.6 | 100.1 |
| Scenic Rim | 42,856 | 46,947 | 1.59% | 46.2 | 82.6 |
| Somerset | 25,355 | 26,936 | 1.04% | 45.1 | 85.2 |
| Lockyer Valley | 41,020 | 46,058 | 2.05% | 40.8 | 89.0 |
The eight largest councils mostly inside the city, then the fastest growing of those with more than 20,000 residents. Change on 2025 council boundaries; the average yearly change is the total change over the six years divided by six. Income index and median age are worked out from the addresses inside the city, so a council’s figure can differ slightly from the ABS figure for the whole council.
Which postcodes in Brisbane have the highest and lowest incomes?
The highest income indices are in 4065 Bardon (141.2), in the inner west, and 4171 Bulimba (137.6) and 4170 Morningside (130.2), on the river to the east.
The lowest are the bay islands and Bribie Island, where many residents are retired — 4184 Russell Island at 57.0, median age 61.6; 4507 Bongaree at 69.5, median age 63.5 — and 4067 St Lucia, around the University of Queensland, the youngest postcode, with a median age of 25.6.
| Highest income index | Residents | Median age | Income index |
|---|---|---|---|
| 4065 Bardon | 11,261 | 38.0 | 141.2 |
| 4171 Bulimba | 19,071 | 38.3 | 137.6 |
| 4170 Morningside | 31,247 | 34.3 | 130.2 |
| 4154 Wakerley | 12,666 | 37.4 | 129.6 |
| 4051 Alderley | 33,116 | 34.0 | 128.0 |
| Lowest income index | Residents | Median age | Income index |
|---|---|---|---|
| 4184 Russell Island | 8,831 | 61.6 | 57.0 |
| 4067 St Lucia | 13,595 | 25.6 | 69.4 |
| 4507 Bongaree | 22,800 | 63.5 | 69.5 |
| 4000 Brisbane City | 22,658 | 31.6 | 71.8 |
| 4109 Sunnybank Hills | 41,680 | 36.1 | 73.9 |
ABS postal areas with more than 5,000 residents inside the city, named after their most populous suburb; the part of each postcode inside the city boundary only. Income index: ABS personal income tax data for 2022–23, measured for councils and SA2 areas and estimated elsewhere; a postcode is the average of its addresses, weighted by residents, so it can differ from the council that contains it.
How much do residents of Brisbane spend, and how many businesses serve them?
Greater Brisbane has 6.09 real estate agencies per 10,000 residents, more than Sydney or Melbourne, and fewer restaurants, 10.34, and bars and cafés, 9.73. Gyms, at 6.69, are the most of the five capitals.
| Category | Per resident | Total (A$ million) |
|---|---|---|
| Food and non-alcoholic beverages | A$5,078 | 14,384 |
| Alcoholic beverages, tobacco and narcotics | A$1,528 | 4,328 |
| Clothing and footwear | A$1,891 | 5,357 |
| Housing, water, electricity, gas and other fuels | A$13,027 | 36,901 |
| Furnishings, household equipment and routine household maintenance | A$2,320 | 6,572 |
| Health | A$3,922 | 11,110 |
| Transport | A$5,690 | 16,118 |
| Information and communication | A$977 | 2,767 |
| Recreation, sport and culture | A$5,547 | 15,713 |
| Education services | A$1,937 | 5,487 |
| Restaurants and accommodation services | A$4,599 | 13,027 |
| Insurance and financial services | A$4,247 | 12,030 |
| Personal care, social protection and miscellaneous goods and services | A$3,028 | 8,577 |
| All categories | A$53,791 | 152,371 |
| Per 10,000 residents | Brisbane | QLD | Australia |
|---|---|---|---|
| Supermarkets | 2.45 | 2.79 | 2.92 |
| Pharmacies | 2.39 | 2.66 | 2.63 |
| Gyms & fitness centers | 6.69 | 7.87 | 7.06 |
| Bars & cafés | 9.73 | 11.62 | 12.00 |
| Restaurants | 10.34 | 11.10 | 12.17 |
| Hairdressers | 8.83 | 9.89 | 9.31 |
| Childcare & early learning | 5.03 | 5.07 | 5.24 |
| Aged care & retirement living | 2.06 | 2.55 | 2.50 |
| Fuel stations | 2.58 | 3.91 | 3.74 |
| Real estate agencies | 6.09 | 6.74 | 5.34 |
| Hotels & accommodation | 7.52 | 16.39 | 15.11 |
Spending per resident from the consumption index and ABS national accounts (5204.0) for 2024–25; residents only, visitors not included. K-Stra places catalogue, October 2026, as the app classifies each business; residents at 30 June 2025.
What does this mean for choosing a location in Brisbane?
With nine residents in ten within 45 minutes of the CBD, a central Brisbane site reaches almost the whole metropolitan market. The question for most formats is not reach but which suburbs: incomes from Bardon to Russell Island span more than eighty points.
The growth is west and south, in Ipswich and Logan, among young families with incomes close to the average. Redbank Plains, in Ipswich, is the second-youngest postcode in the city.
The Brisbane City Council holds about half of the metropolitan population, so figures by council are too coarse here. A catchment around the address, or the postcode, is the level at which differences become visible.
What else do people ask about Brisbane?
What is the population of Brisbane?
Greater Brisbane had 2,832,646 residents at 30 June 2025 (estimated from ABS council figures), 50.0% of Queensland. The Brisbane City Council covers 1,375,301 of them.
How many people live within 30 minutes of the Brisbane CBD?
1,745,544 people live within a 30-minute drive of 289 Queen Street in average traffic, according to a K-Stra analysis of 2 November 2026, and 2,591,207 within 45 minutes.
Which Brisbane postcodes have the highest incomes?
By income index, 4065 Bardon, 4171 Bulimba, 4170 Morningside, 4154 Wakerley and 4051 Alderley, among postcodes with more than 5,000 residents.
Draw your catchment
in Brisbane.
The app opens on Brisbane with drive bands of 15, 30 and 45 minutes ready: type an address and see who lives within reach.
Open the app — free to exploreDrawing an area is free; you pay only for the analyses you run