
How many people live in Queensland, and why is it different?
No other mainland state spreads its people so widely. Half of Queensland lives outside Brisbane, in a chain of coastal cities each large enough to be a market of its own.
Queensland had 5,669,764 residents at 30 June 2025 and added 580,917 since 2019, more than New South Wales. Only 50.0% live in Greater Brisbane, the lowest capital share of any mainland state. Ipswich and Logan grew fastest; residents spend about A$50,902 a head a year, below the national average.
What are the key figures for Queensland?
| Indicator | Queensland | Australia |
|---|---|---|
| Residents, 30 June 2025 | 5,669,764 | 27,613,654 |
| Average yearly change, 2019–2025 | 1.90% | 1.50% |
| Residents added since 2019 | 580,917 | 2,278,828 |
| Area | 1,730,171 km² | 7,688,095 km² |
| Residents per km² | 3.3 | 3.6 |
| Share in Greater Brisbane | 50.0% | — |
| Median age | 38.6 | 38.5 |
| Aged under 15 | 17.7% | 17.4% |
| Aged 65 and over | 17.4% | 17.5% |
| Income index | 96.6 | 100.0 |
| Consumption index | 96.8 | 100.0 |
| Spending per resident, a year | A$50,902 | A$52,582 |
| Resident spending, a year | A$288.6 billion | A$1,452.0 billion |
| Families (Census 2021) | 1,366,648 | 6,730,182 |
| Homes rented (Census 2021) | 35.7% | 33.6% |
| Flats and apartments (Census 2021) | 17.0% | 19.6% |
- Residents: ABS Estimated Resident Population at 30 June 2025, by council (2025 boundaries). Change: ABS Estimated Resident Population by council, 2019 to 2025; average yearly change as in the K-Stra area dashboard.
- Age: ABS population by five-year age group at 30 June 2025; median age worked out from the age groups. Capital: Greater Capital City Statistical Areas (ABS ASGS Edition 3), residents counted by K-Stra on the address points inside them.
- Indices: Income index from ABS Personal Income 2022–23 (tax data), measured or estimated; consumption index derived from it; 100 = Australia. Spending: Spending per resident from the consumption index and ABS national accounts (5204.0) for 2024–25. Housing and families: ABS Census 2021 (families, rented homes, flats and apartments).
Where do people live in Queensland?
Greater Brisbane counts 2,832,646 residents, 50.0% of the state. The Brisbane City Council alone has 1,375,301, the largest council in Australia, because it covers most of the city instead of a single district.
The Gold Coast region has 708,530 residents and the Sunshine Coast 441,508. Further north, Cairns, Townsville, Central Queensland, Mackay and Toowoomba each hold between 170,000 and 280,000 residents.
| Area (capital city, then SA4 regions) | Residents 2025 | Share | Median age | Income index |
|---|---|---|---|---|
| Greater Brisbane | 2,832,646 | 50.0% | 36.5 | 102.4 |
| Gold Coast | 708,530 | 12.5% | 39.4 | 91.1 |
| Sunshine Coast | 441,508 | 7.8% | 44.0 | 87.2 |
| Wide Bay | 335,670 | 5.9% | 49.4 | 75.7 |
| Cairns | 271,364 | 4.8% | 41.6 | 86.2 |
| Townsville | 249,097 | 4.4% | 37.5 | 102.6 |
| Central Queensland | 244,220 | 4.3% | 38.9 | 103.4 |
| Mackay – Isaac – Whitsunday | 193,813 | 3.4% | 38.7 | 108.2 |
| Toowoomba | 176,244 | 3.1% | 37.9 | 95.2 |
| Darling Downs – Maranoa | 134,065 | 2.4% | 43.0 | 81.7 |
| Queensland – Outback | 82,607 | 1.5% | 34.9 | 96.8 |
Residents counted by K-Stra on the address points inside each area; median age from the five-year age groups, income index weighted by residents. The income index comes from ABS personal income tax data for 2022–23, measured for councils and SA2 areas and estimated elsewhere; 100 is the Australian average.
Two cities have a page of their own, with residents within 15, 30 and 45 minutes of the centre and incomes by postcode: Greater Brisbane and Gold Coast.
Which councils in Queensland are growing fastest?
Ipswich, west of Brisbane, grew 22.0% from 2019 to 2025, on average 3.67% a year, and Logan, between Brisbane and the Gold Coast, 3.35% a year; the Sunshine Coast and Moreton Bay follow. Ipswich and Logan are also the youngest large councils in the state, with median ages of 33.8 and 34.3.
No Queensland council with more than 20,000 residents lost population over the period. The slowest, Western Downs, still grew 0.50% a year.
| Council | Residents 2019 | Residents 2025 | Change a year | Rank |
|---|---|---|---|---|
| Ipswich | 219,893 | 268,272 | 3.67% | Fastest |
| Logan | 335,955 | 403,515 | 3.35% | Fastest |
| Sunshine Coast | 329,946 | 381,957 | 2.63% | Fastest |
| Whitsunday | 36,266 | 41,374 | 2.35% | Fastest |
| Moreton Bay | 467,314 | 532,445 | 2.32% | Fastest |
| Western Downs | 34,420 | 35,452 | 0.50% | Slowest |
| Central Highlands (Qld) | 28,574 | 29,481 | 0.53% | Slowest |
| Cassowary Coast | 29,564 | 30,666 | 0.62% | Slowest |
Councils with more than 20,000 residents in 2025. Average yearly change = (residents 2025 ÷ residents 2019 − 1) ÷ 6, on 2025 council boundaries.
How much do residents of Queensland spend, and on what?
Queensland’s consumption index is 96.8, and residents spend A$50,902 each a year. The average hides the mining regions: Isaac, in the Bowen Basin, has an income index of 141.4, while the Cassowary Coast and the Tablelands, in the far north, sit below 70.
| Category | Per resident, QLD | Per resident, Australia | Total, QLD (A$ million) |
|---|---|---|---|
| Food and non-alcoholic beverages | A$4,968 | A$5,032 | 28,167 |
| Alcoholic beverages, tobacco and narcotics | A$1,483 | A$1,509 | 8,408 |
| Clothing and footwear | A$1,838 | A$1,869 | 10,421 |
| Housing, water, electricity, gas and other fuels | A$12,456 | A$12,788 | 70,623 |
| Furnishings, household equipment and routine household maintenance | A$2,136 | A$2,243 | 12,111 |
| Health | A$3,685 | A$3,823 | 20,893 |
| Transport | A$5,374 | A$5,558 | 30,469 |
| Information and communication | A$928 | A$956 | 5,262 |
| Recreation, sport and culture | A$5,146 | A$5,380 | 29,177 |
| Education services | A$1,759 | A$1,862 | 9,973 |
| Restaurants and accommodation services | A$4,235 | A$4,447 | 24,011 |
| Insurance and financial services | A$4,006 | A$4,146 | 22,713 |
| Personal care, social protection and miscellaneous goods and services | A$2,888 | A$2,969 | 16,374 |
| All categories | A$50,902 | A$52,582 | 288,602 |
Spending per resident from the consumption index and ABS national accounts (5204.0) for 2024–25. Spending of residents, wherever it happens; visitors are not included.
How many businesses of each kind does Queensland have?
Queensland has more real estate agencies per 10,000 residents than any other state, 6.74 against 5.34, and more gyms, 7.87 against 7.06. Restaurants are fewer, at 11.10, and the 16.39 accommodation businesses per 10,000 reflect the coast’s visitors.
| Sector | Locations in QLD | Per 10,000 residents | Australia |
|---|---|---|---|
| Supermarkets | 1,582 | 2.79 | 2.92 |
| Pharmacies | 1,508 | 2.66 | 2.63 |
| Gyms & fitness centers | 4,460 | 7.87 | 7.06 |
| Bars & cafés | 6,591 | 11.62 | 12.00 |
| Restaurants | 6,291 | 11.10 | 12.17 |
| Hairdressers | 5,606 | 9.89 | 9.31 |
| Childcare & early learning | 2,872 | 5.07 | 5.24 |
| Aged care & retirement living | 1,444 | 2.55 | 2.50 |
| Fuel stations | 2,218 | 3.91 | 3.74 |
| Real estate agencies | 3,820 | 6.74 | 5.34 |
| Hotels & accommodation | 9,293 | 16.39 | 15.11 |
K-Stra places catalogue, October 2026, as the app classifies each business; residents at 30 June 2025. A higher count per resident can mean smaller outlets, visitors or a crowded market: the catchment of each site tells which.
What can you see about Queensland without an account?
 No account needed
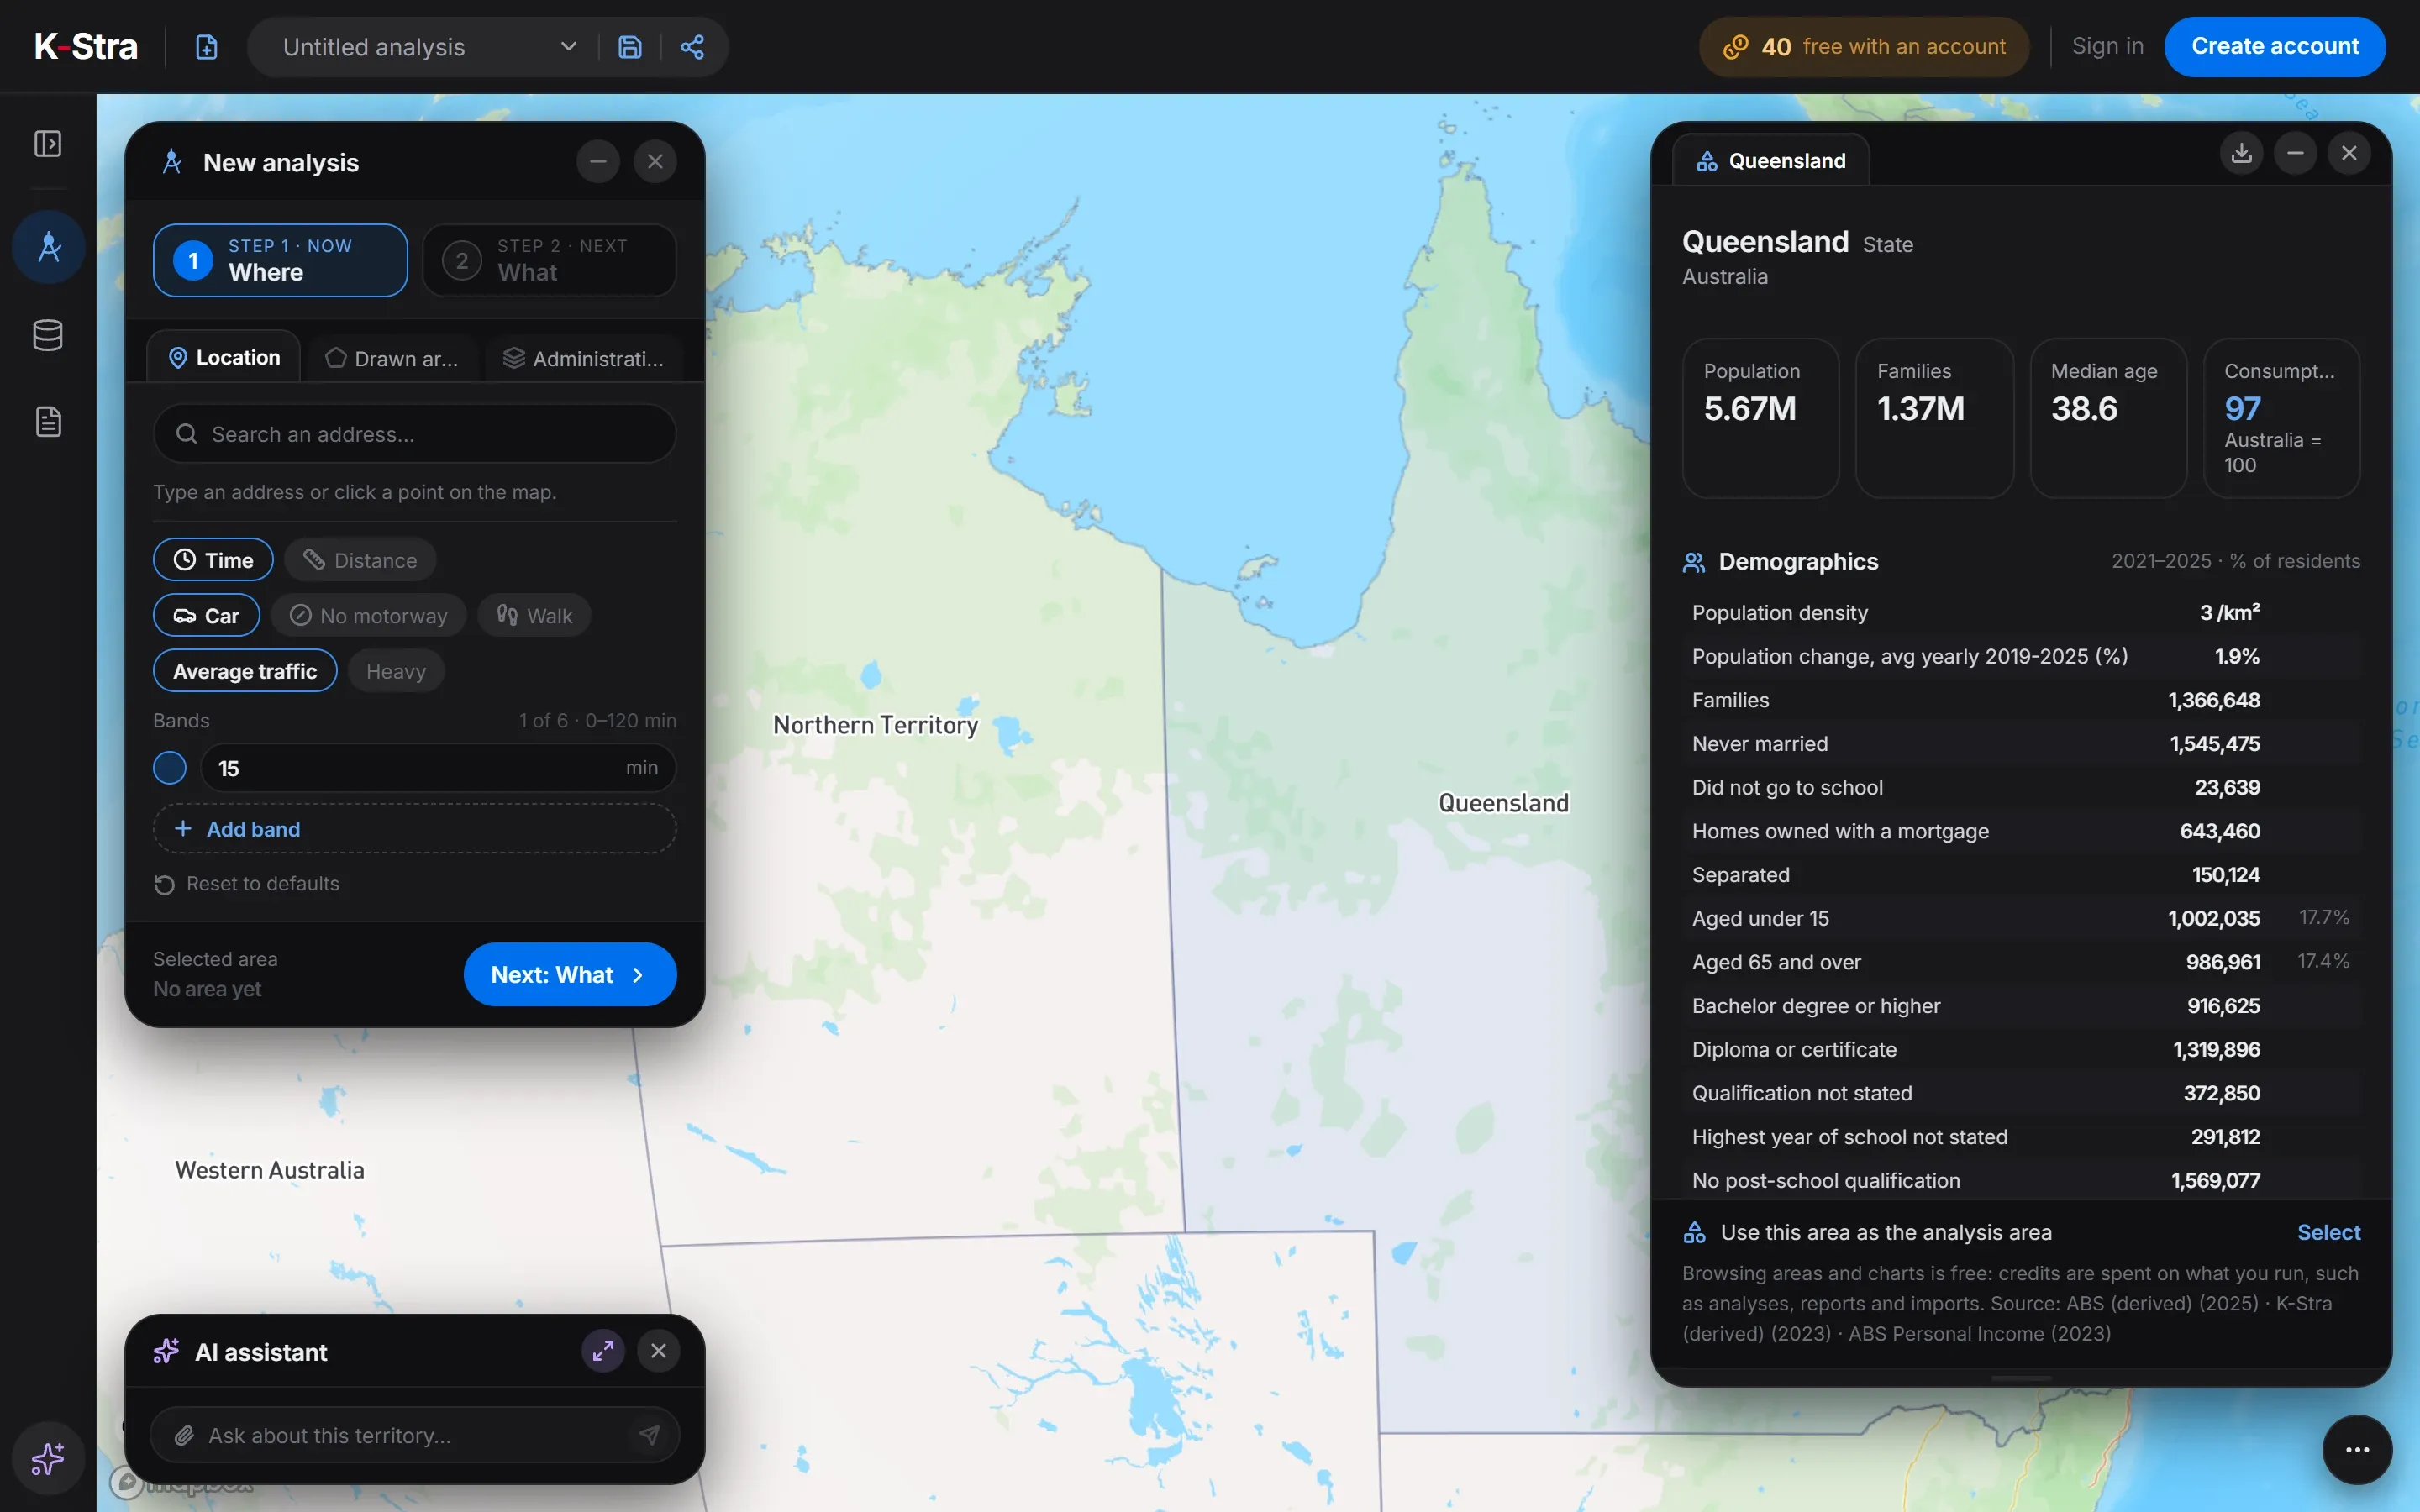
On the map of Australia, a click on “Queensland” opens this dashboard; zooming in, the same click works on every council, postcode and suburb in QLD. Browsing them costs nothing.
Figures for the whole of Queensland are a starting point: credits start when you measure the catchment of one of its addresses — the residents within a drive, their spending and the competitors already there.
What does this mean for choosing a location in Queensland?
A network plan for Queensland cannot stop at Brisbane. The Gold Coast and the Sunshine Coast are each larger than Tasmania’s capital and growing, and the northern cities are hundreds of kilometres apart, each with its own catchment and its own competitors.
The coast is a market of residents and visitors at once. K-Stra counts residents, so for hospitality and tourism formats the resident figures are a floor: actual demand in Noosa or Surfers Paradise is higher than the residents alone suggest.
The fastest growth is in Ipswich and Logan, young and close to average income: the ground for everyday formats such as supermarkets, childcare and fitness rather than premium retail.
What else do people ask about Queensland?
What is the population of Queensland?
5,669,764 at 30 June 2025 (ABS estimate), up from 5,088,847 in 2019. That is growth of 11.4% in all, on average 1.90% a year, second only to Western Australia among the states.
Why is Brisbane the largest council in Australia?
Because the Brisbane City Council covers most of the city, with 1,375,301 residents, while Sydney and Melbourne are divided into dozens of smaller councils. Comparing councils across states therefore compares areas of very different size.
Where are Queensland’s oldest residents?
On the Fraser Coast, with a median age of 51.9, and in Noosa, at 51.2, against 38.6 for the state. The Wide Bay region as a whole sits at 49.4.
Open Queensland
on the map.
The app opens on the state: click a council for its free dashboard, or draw a catchment around any of its coastal cities.
Open the app — free to exploreBrowsing areas and dashboards is free