
How do Australian postcodes, suburbs, SA1 and SA2 areas fit together?
Australian data arrives in nine kinds of area. Knowing which nest inside which, and which do not, saves a lot of wrong comparisons.
Australian statistics come in two families of areas. The ABS builds its own, from mesh blocks up to SA1, SA2, SA3 and SA4 regions, which nest exactly. Councils, postcodes and suburbs are drawn by others and approximated from mesh blocks, so they do not nest and can cross each other. Choose the level by the question, not by habit.
What is the difference between ABS areas and the others?
The Australian Statistical Geography Standard has a main structure built by the ABS for statistics: mesh blocks, most holding 30 to 60 dwellings, add up to SA1 areas, which add up to SA2, SA3 and SA4. Every level fits exactly inside the next.
Councils, postcodes and suburbs belong to other organisations. The ABS approximates them with mesh blocks so it can publish data for them, but they follow their own logic and do not nest: a postcode can sit in two councils, and a suburb in two postcodes.
They also change at different speeds. Councils are updated every year; postcodes and suburbs, like the ABS areas, every five years with a new edition of the standard.
Sources: ABS, Australian Statistical Geography Standard, Edition 4, main structure and non-ABS structures.
How many areas are there at each level, and what are they for?
Grouped by family: the ABS statistical areas from the largest to the finest, then the areas drawn by others (councils, postcodes, suburbs). Counts are the official ones for the edition K-Stra uses, with an example from Sydney’s eastern suburbs. Below the finest level sit 14.5 million street addresses.
| Level | Areas | Edition | Typical size | Good for | Example |
|---|---|---|---|---|---|
| Country | 1 | ASGS Ed. 3 | One country | The benchmark every other figure is compared with | Australia |
| States and territories | 10 | ASGS Edition 3 (2021) | Six states and the territories | State totals and regulation | New South Wales |
| Statistical Area Level 4 | 107 | ASGS Edition 3 (2021) | Usually over 100,000 people; labour markets | Regional economies and jobs | Sydney – Eastern Suburbs |
| Statistical Area Level 3 | 358 | ASGS Edition 3 (2021) | 30,000 to 130,000 people; a group of suburbs or a regional city | Regional comparisons of similar areas | Eastern Suburbs – North |
| Statistical Area Level 2 | 2,472 | ASGS Edition 3 (2021) | 3,000 to 25,000 people; a suburb or small community | Local profiles with yearly income data | Double Bay – Darling Point |
| Statistical Area Level 1 | 61,844 | ASGS Edition 3 (2021) | 200 to 800 people; the smallest area for most Census data | Fine-grained maps and building custom areas | An 11-digit statistical area code |
| Local government areas | 566 | LGA 2025 | A council; from about a hundred residents to over a million | Yearly population, planning rules, council services | Woollahra |
| Postcodes | 2,643 | ASGS Edition 3 (2021) | An Australia Post delivery area, approximated | Customer files, delivery zones, campaigns | 2028 |
| Suburbs and localities | 15,352 | ASGS Edition 3 (2021) | A named suburb or locality, approximated | Talking to people in names they recognise | Double Bay |
Counts: ASGS Edition 3 (2021) for statistical areas, postcodes and suburbs, as K-Stra uses it, and the 2025 list of 566 council codes, of which 548 have residents (the rest are special codes with no territory). K-Stra’s own tables also hold a row for each ABS special area without a map, such as “No usual address”, so its row counts run slightly higher. Typical sizes from the ABS. The ABS released Edition 4 in July and October 2026; K-Stra moves to it with the first results of the 2026 Census, from June 2027, so that areas and figures stay matched.
The top level, state or territory, has a page of its own for each of the eight, with residents, growth by council, income, spending and businesses: New South Wales, Victoria, Queensland, Western Australia, South Australia, Tasmania, Australian Capital Territory and Northern Territory.
How much did the boundaries change in 2026?
| Level | Edition 3 (2021) | Edition 4 (2026) | Change |
|---|---|---|---|
| SA1 | 61,844 | 63,484 | +1,640 |
| SA2 | 2,472 | 2,570 | +98 |
| SA3 | 358 | 366 | +8 |
| SA4 | 107 | 107 | 0 |
| Postal areas | 2,643 | 2,644 | +1 |
| Suburbs and localities | 15,352 | 15,376 | +24 |
Most of the change is at the bottom: growing areas are split into new SA1 and SA2 areas, while SA4 regions stay the same. A time series on small areas therefore needs care across editions, because an area may have been split in two.
Why do postcodes and catchments rarely match?
Around 135 Hunter Street, Newcastle NSW, a catchment of 5, 10 and 15 minutes by car touches 18 postcodes. Postcode 2291 falls in all three bands: 2,505 of its residents within 5 minutes, 11,885 between 5 and 10, and 922 between 10 and 15.
A report by postcode would put all 15,312 of them at one distance. That is why catchments are best counted address by address and only then summarised by postcode, council or SA2 for reporting.
 Areas · Where step
Source: drive-time bands of 5, 10 and 15 minutes from 135 Hunter Street, Newcastle NSW, K-Stra analysis of 31 October 2026; residents from ABS population estimates at 30 June 2025 placed on addresses, then grouped by ABS Postal Area.
What else do people ask about Australian geography?
Are ABS Postal Areas the same as Australia Post postcodes?
Close, but not identical. The ABS approximates each postcode with whole mesh blocks so that statistics can be published for it. Edges can differ, some postcodes cross state borders, and postcodes used only for post office boxes have no area at all.
Which level should I use for a market analysis?
For the market itself, none: draw the drive or walk your customers make. For reporting and comparison, SA2 areas give local detail with consistent sizes, councils give yearly population, and postcodes are best when the data comes from customer files.
Why does the same area have different populations in different sources?
Because of the year, the edition of the boundaries and the method. Census counts, annual population estimates and figures re-allocated from one area type to another all differ a little, and the differences grow for small areas.
What changed with ASGS Edition 4?
New boundaries from July 2026 for the ABS areas, with more SA1 and SA2 areas where the population has grown. Data on the new edition arrives gradually, starting with the 2026 Census results from June 2027.
Pick any level,
or draw your own.
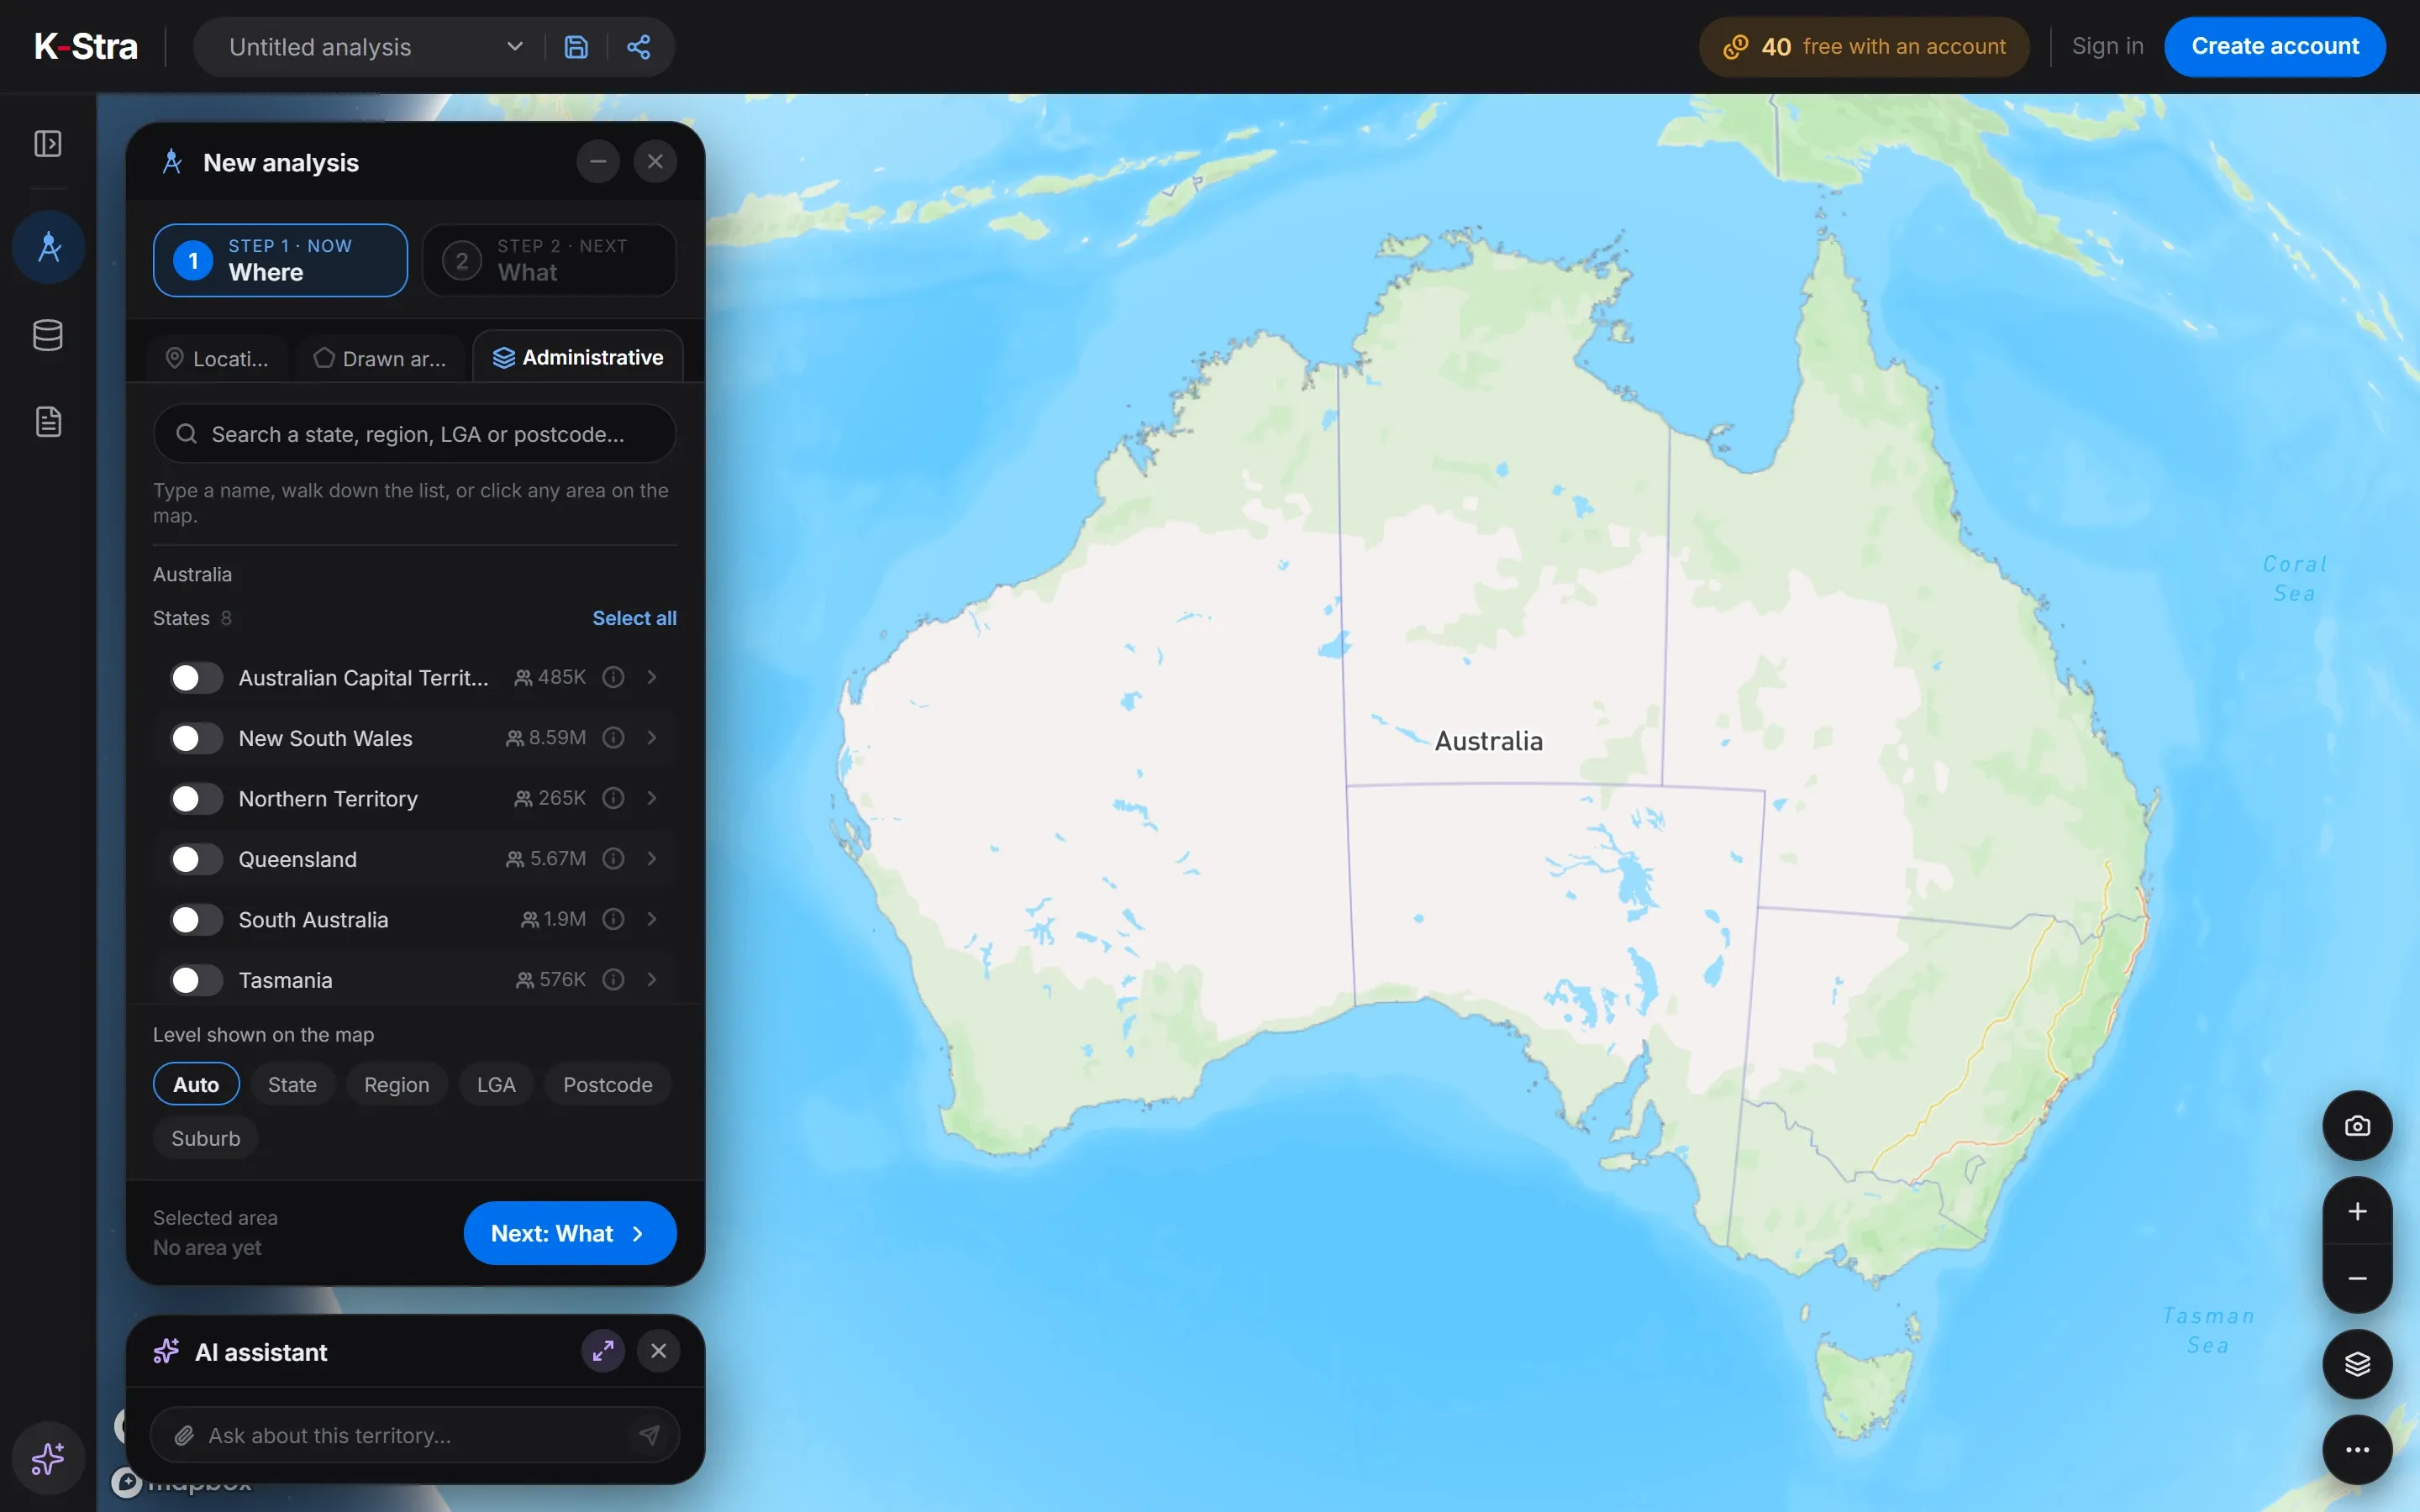
Select postcodes, suburbs, councils or SA areas in the Where step, or draw the drive time your customers make.
Open the app — free to exploreSelecting areas is free