
Demand
Who lives there, and how much they spend
Residents, families, ages, income and spending power from ABS data, counted on 14.5 million address points.
Sources and yearsFind where the opportunity is, then compare locations before you invest. The method works with any tool; K-Stra makes it a few clicks.
Retail site selection means choosing where to open on evidence, by weighing demand — the residents and what they spend — against supply, the competitors already there. Shortlist a few sites where demand outweighs supply, draw the same drive-time catchment around each and compare them on people, income, spending, competitors and rents.
A site that feels busy is not necessarily a site with customers. Foot traffic on a weekday morning says little about who lives ten minutes away, what they earn or how many stores already compete for them.
The choice is also wider than it looks. Before any shopfront, the real question is which suburb, which side of the highway and which corner, and every option draws a different catchment.
Most mistakes come from comparing sites on different terms: one seen on a visit, one in an agent’s brochure, one on a friend’s advice. A fair choice measures every candidate the same way, on the same data and the same travel time.
suburbs and localities in Australia, and 61,845 Statistical Areas Level 1: far more candidate areas than anyone can visit.
ABS Australian Statistical Geography Standard, 2021 edition, as loaded in K-Stra territory v5 (30 September 2026).
Who buys from you, how often, and how far they will travel for it. A gym, a pharmacy and a furniture store need very different catchments.
Choose a single travel time and mode for every site, so that no candidate wins only because it was measured more generously.
Map where demand for your sector is high and supply is thin, before you open a single property listing.
Keep three to five addresses that pass the first check, far enough apart not to share the same customers.
Residents, families, age, income and spending inside the same drive time around every candidate.
Competitors of your sector inside each catchment, and how close they sit to the door.
Rents and property values nearby, and how much each site overlaps stores you already run. Then decide on the numbers.
Every location decision weighs two things: the demand of the people who live within reach, and the supply of the stores already serving them. Measure both the same way for every candidate, and the comparison is decided by the site, not by the source.
Residents, families, ages, income and spending power from ABS data, counted on 14.5 million address points.
Sources and yearsMore than 2 million Australian businesses and stores, searchable by sector or by brand and updated every month.
Sources and yearsOpportunity is where demand outweighs supply: for each consumer sector, a spending model sets the two against each other, colours the gap on the map and lists the five best locations.
Costs come last. Property values and rents, estimated from portal listings and summarised by postcode with the size of the sample, tell you what each site will cost once you know where the customers are. Real estate data.
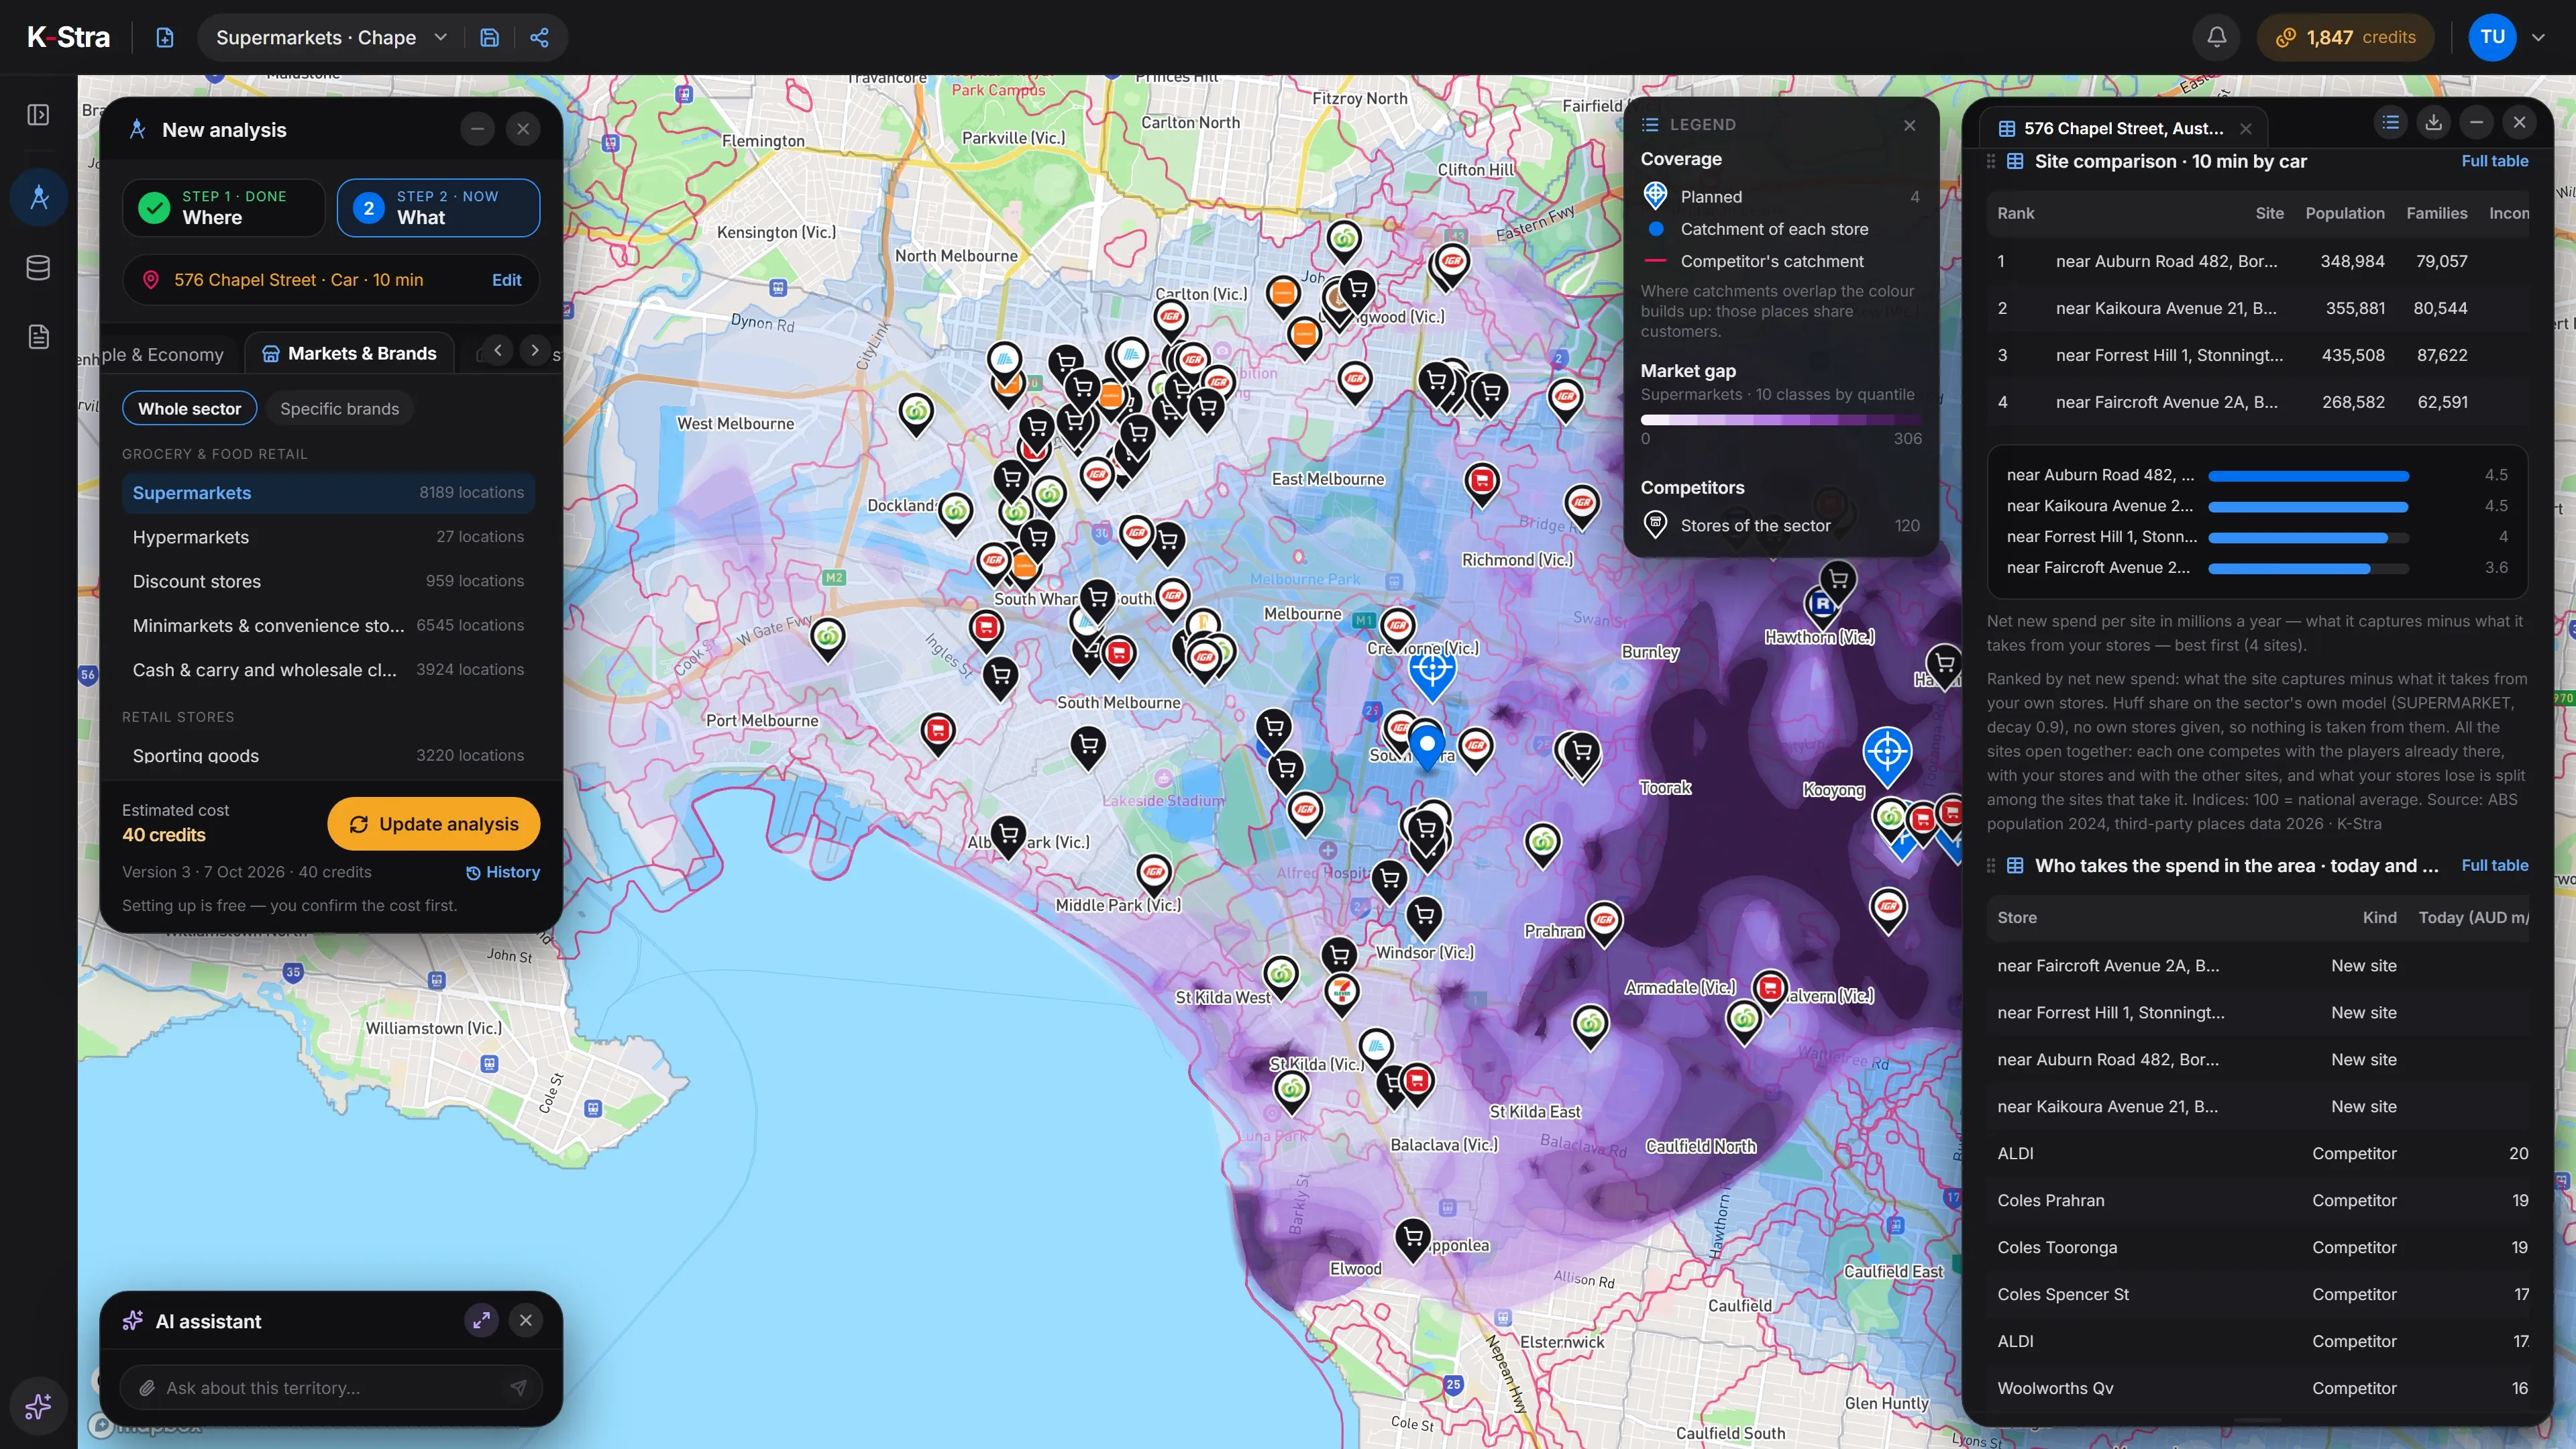
Site selection in K-Stra starts from a sector analysis, which already knows where demand and supply sit in the area you chose.
The comparison also shows who each candidate would take residents' spending from: the main competitors, named one by one, and your own network once you add your existing stores from My Data. People & Economy and Real Estate add age, families, values and rents; the comparison tabs of the KPI panel set up to four targets side by side.
K-Stra runs on a dedicated server in Sydney: your datasets, your analyses and your results stay in Australia. Map tiles, payments and sign-in never see your files. Three steps can: geocoding sends only the address text, and only after you confirm; the AI assistant reads column names and values when you ask it about a dataset; email notifications carry figures from your analysis.Where your data lives. Mark a dataset “session only” and it is deleted 24 hours after upload.
Four candidate sites for a supermarket in a 10-minute drive from Chapel Street, South Yarra, Melbourne VIC, each with its own 10-minute catchment, in the order the app ranks them. The two strongest share more than nine residents in ten: open both and they would compete with each other. Spend captured is the residents' spending each site would draw under the sector model, not a turnover forecast: it is for comparing sites in the same sector and area, and it leaves out workers, commuters and visitors, so CBD and station sites read low.
| Indicator | Auburn Road 482, Boroondara | Kaikoura Avenue 21, Boroondara | Forrest Hill 1, Stonnington | Faircroft Avenue 2A, Boroondara |
|---|---|---|---|---|
| Residents within 10 minutes | 348,984 | 355,881 | 435,508 | 268,582 |
| Families | 79,057 | 80,544 | 87,622 | 62,591 |
| Income index (100 = Australia) | 120.9 | 120.3 | 113.5 | 121.5 |
| Spending index (100 = Australia) | 119.6 | 119.1 | 112.7 | 120.2 |
| Supermarket spend of the residents (A$ m a year) | 789.8 | 803.9 | 960.5 | 609.1 |
| Supermarkets in the catchment | 80 | 79 | 132 | 53 |
| Spend the new site would capture (A$ m a year) | 6.23 | 6.20 | 5.72 | 5.02 |
| Residents also in another candidate’s catchment | 93.1% (Kaikoura Avenue 21) | 91.3% (Auburn Road 482) | 50.2% (Auburn Road 482) | 97.7% (Kaikoura Avenue 21) |
Sources: ABS population 2024 (families: 2021 Census); income and spending indices, 100 = Australian average; supermarket spend of the residents from ABS household spending 2025 and the K-Stra sector model; competitors from the K-Stra places catalogue 2026. All four sites assessed as opening together. K-Stra analysis of 7 October 2026.
The sector analysis costs 40 credits on any area, however large. Each candidate in the comparison adds 20 credits, so comparing 3 sites costs 100 credits in total.
Adding Real Estate brings it to 120 credits, and five People & Economy topics on top make a full study of 130 credits, within the Single report pack of 150. A free account starts with 40 credits, enough to run the sector analysis and see the best locations. No subscription required.
Optional, not in the total
Every action shows its estimate first, with your balance after it, and runs only when you confirm.
Three to five is a practical number. K-Stra compares up to five candidates in one run, and each is judged on its own against today’s market, because you are choosing between alternatives rather than opening them all.
Start from the map of opportunity. A sector analysis colours the area by where demand outweighs supply and lists the five best locations, each at least 500 metres from the others; any of them becomes a candidate with one click.
Yes. A comparison can hold just one candidate: it measures the people, the spending and the competitors in that address’s catchment against the market as it is today.
Rent is a cost to weigh against demand, not the place to start. A cheap site in a thin catchment is usually cheap for a reason, so read rents and values from Real Estate once you know where the customers are. Real Estate costs 20 credits per analysis.
For a fair comparison, yes. In K-Stra the candidates share the catchment of the sector analysis, and you can change it from 1 to 30 minutes for all of them at once.
Yes, inside the app. Without an account it can prepare and price the analysis in its first 2 free answers; with a free account it also runs it. It can set up the sector analysis and place the candidates, and it asks before running anything that costs credits. Each answer costs 0.5 credits. How the assistant works.
Open the map, pick your sector and see where demand is still waiting for a store. Exploring costs nothing.
Open the app — free to exploreA sector analysis runs only after you confirm the estimate