
How many people live in Melbourne, and how many can reach the centre?
Flat ground, a grid of arterial roads and growth on three fronts: Melbourne is the Australian city where the most people live within a drive of the centre.
Greater Melbourne had 5,431,267 residents at 30 June 2025. A 45-minute drive from Bourke Street reaches 4,762,581 of them, more than the same drive from the centre of Sydney, as Melbourne is flatter and more compact. Growth is fastest in Melton, Wyndham and Cardinia; income is highest in the inner south and the inner city.
How many people live within 15, 30 and 45 minutes of central Melbourne?
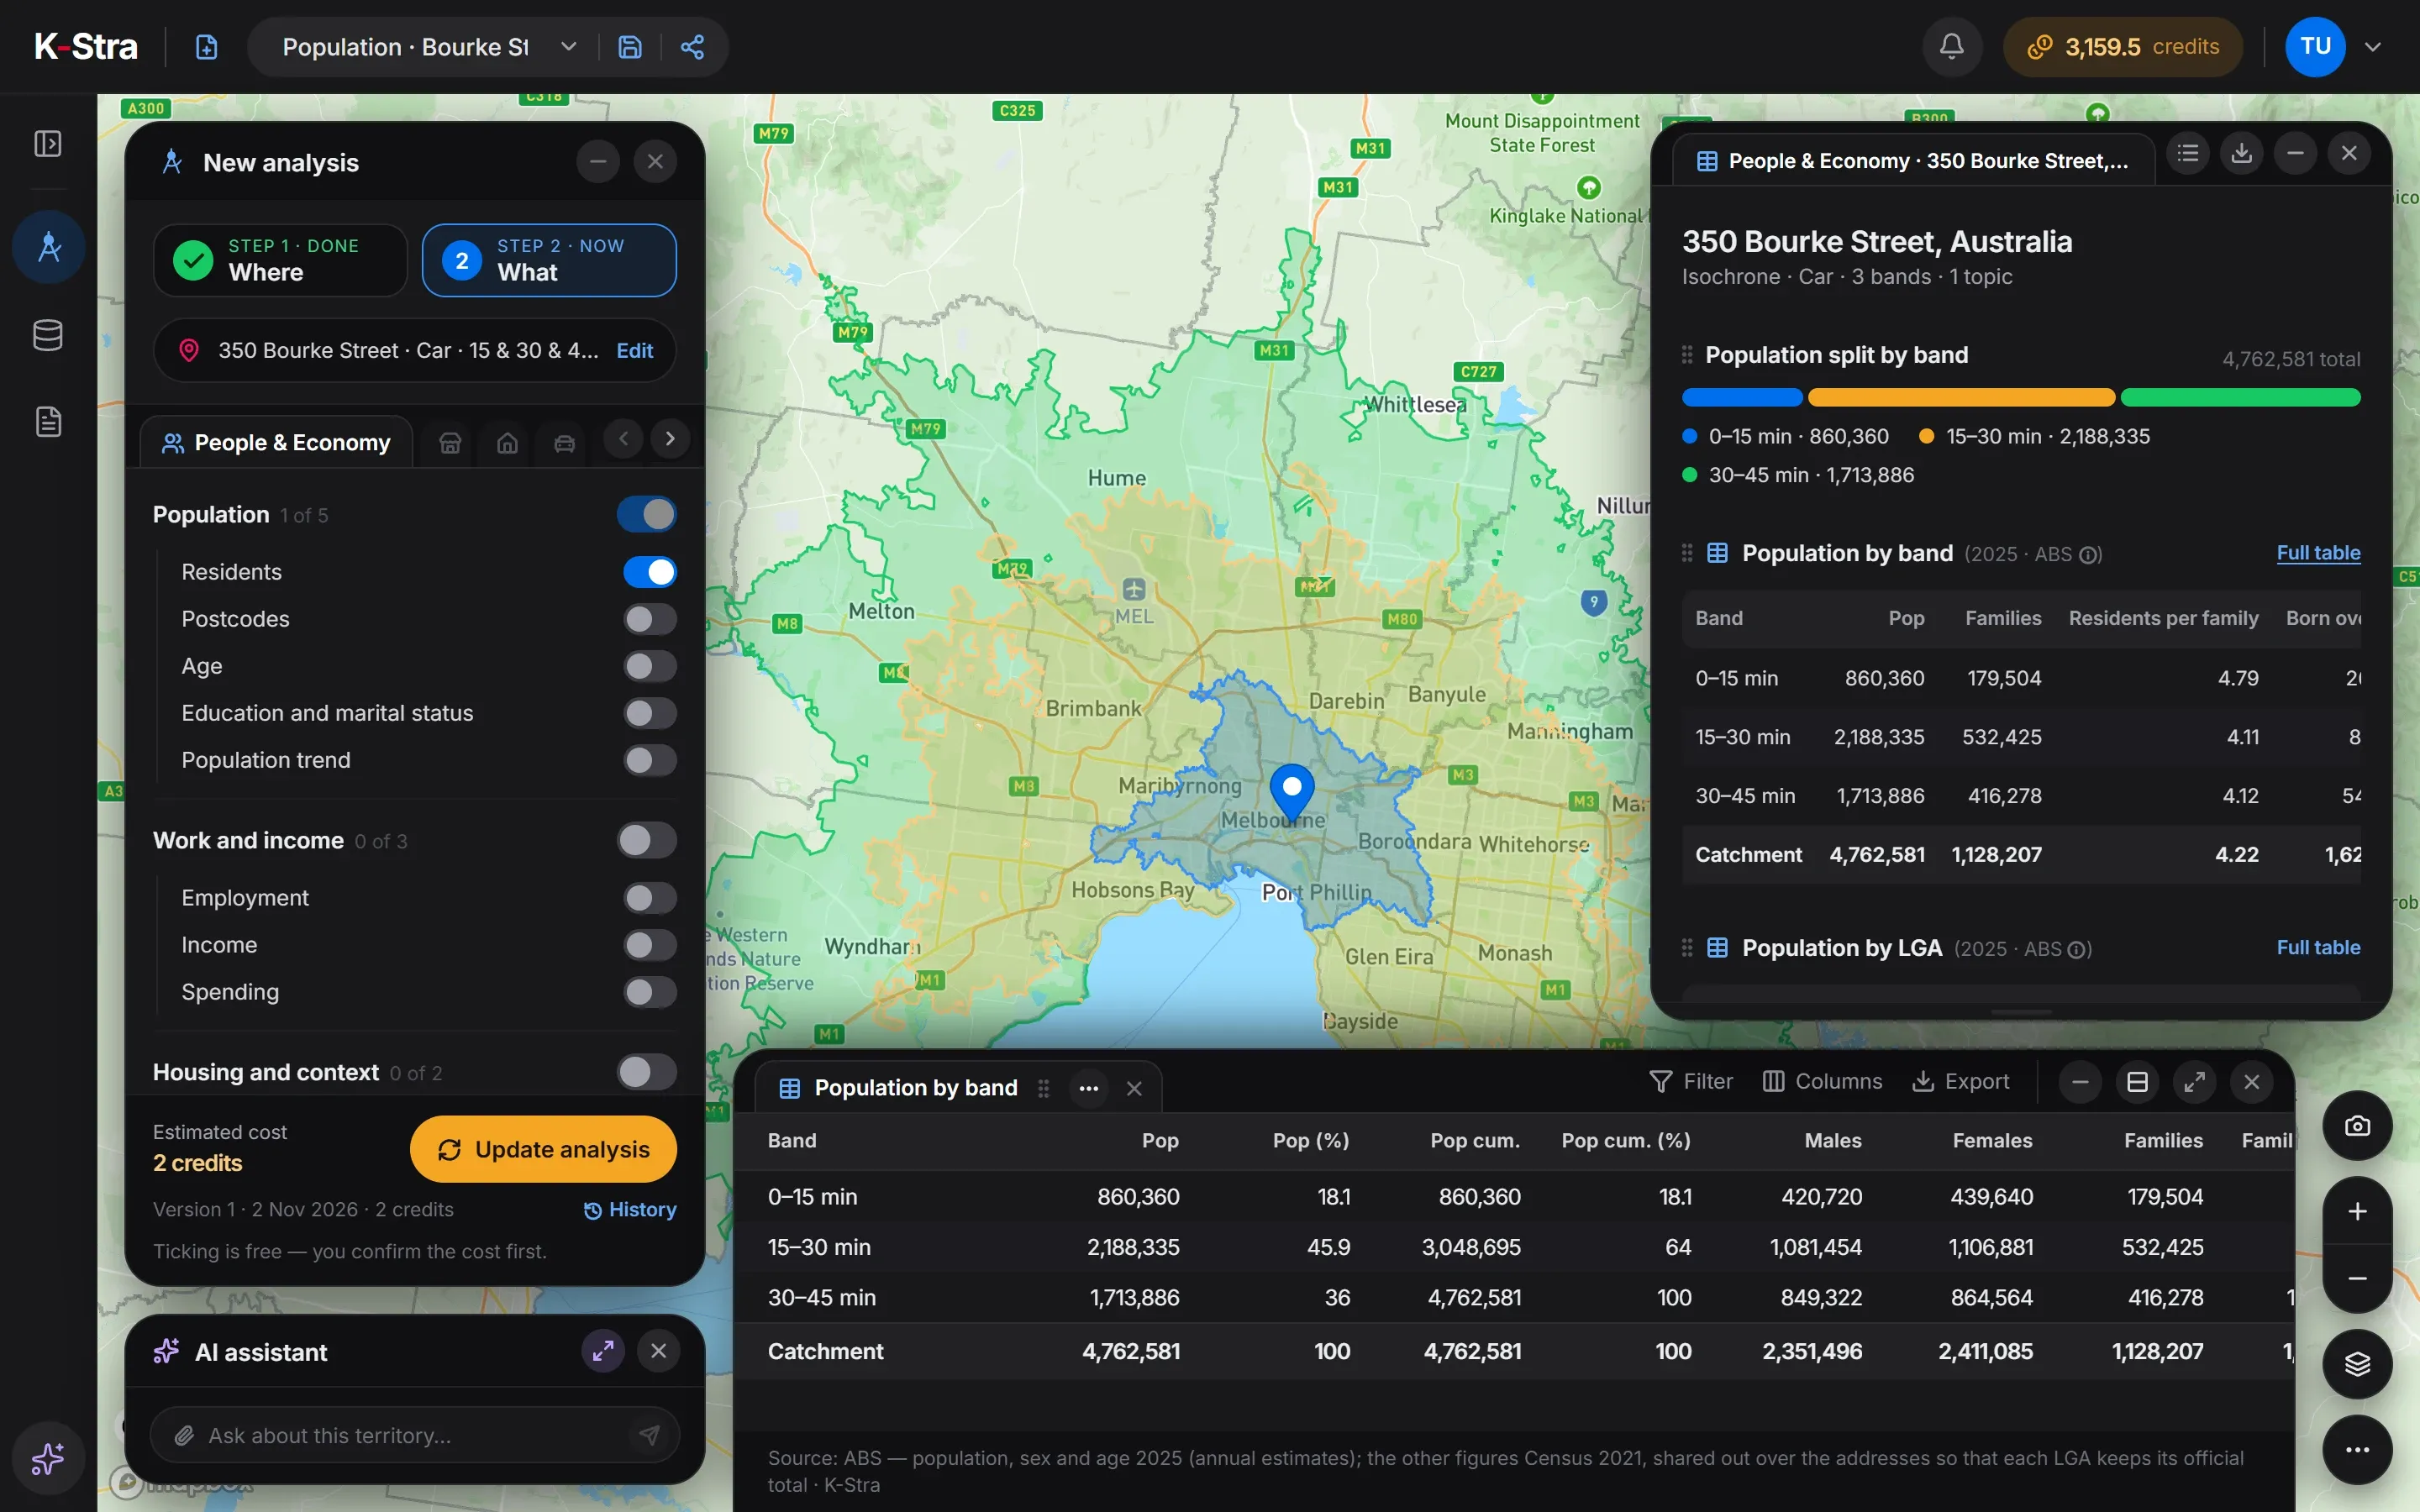 People & Economy · Melbourne
From 350 Bourke Street, 860,360 people live within 15 minutes by car, 2,188,335 between 15 and 30 minutes and 1,713,886 between 30 and 45. The 45-minute area covers 3,325 km², against 1,929 for the same drive from Martin Place in Sydney.
In total 4,762,581 residents, 87.7% of Greater Melbourne, are within 45 minutes of the CBD. Without a harbour or national parks in the way, the area reaches far to the west, the north and the south-east.
| Drive time | Residents | Cumulative |
|---|---|---|
| 0–15 min | 860,360 | 860,360 |
| 15–30 min | 2,188,335 | 3,048,695 |
| 30–45 min | 1,713,886 | 4,762,581 |
Source: K-Stra analysis of 2 November 2026, drive time by car in average traffic from 350 Bourke Street; residents from ABS Estimated Resident Population at 30 June 2025, placed on address points.
How does Melbourne change with distance from the centre?
In a straight line, 1,098,512 people live within 10 kilometres of Bourke Street and 4,008,567 within 30. The first 5 kilometres are young, with a median age of 32.4, and 79.8% of homes there are flats; beyond 20 kilometres flats are 5.4% or less.
The income index peaks between 5 and 10 km, at 119.0, above the 109.4 of the centre, where students pull the average down. Beyond 10 kilometres it settles just under 100 in every ring.
| Distance from 350 Bourke Street | Residents | Within this distance | Income index | Median age | Flats (2021) | Rented (2021) |
|---|---|---|---|---|---|---|
| 0–5 km | 422,881 | 422,881 | 109.4 | 32.4 | 79.8% | 62.0% |
| 5–10 km | 675,631 | 1,098,512 | 119.0 | 37.1 | 39.3% | 40.7% |
| 10–20 km | 1,564,745 | 2,663,257 | 99.8 | 38.6 | 13.2% | 30.5% |
| 20–30 km | 1,345,310 | 4,008,567 | 98.3 | 36.4 | 5.4% | 26.2% |
| 30–50 km | 1,174,938 | 5,183,505 | 99.2 | 36.6 | 2.0% | 23.5% |
Straight-line rings counted by K-Stra on every address point, inside or outside the city boundary. Residents and age: ABS 2025; income index: ABS Personal Income 2022–23; flats and renting: ABS Census 2021.
What are the key figures for Greater Melbourne?
| Indicator | Greater Melbourne | VIC | Australia |
|---|---|---|---|
| Residents, 30 June 2025 | 5,431,267 | 7,073,859 | 27,613,654 |
| Average yearly change, 2019–2025 | 1.56% | 1.37% | 1.50% |
| Area | 9,993 km² | 227,496 km² | 7,688,095 km² |
| Residents per km² | 543.5 | 31.1 | 3.6 |
| Median age | 36.8 | 38.0 | 38.5 |
| Aged under 15 | 17.4% | 17.3% | 17.4% |
| Aged 65 and over | 15.0% | 17.0% | 17.5% |
| Income index | 102.1 | 98.8 | 100.0 |
| Consumption index | 102.0 | 98.9 | 100.0 |
| Spending per resident, a year | A$53,629 | A$52,000 | A$52,582 |
| Resident spending, a year | A$291.3 billion | A$367.8 billion | A$1,452.0 billion |
| Families (Census 2021) | 1,299,198 | 1,718,785 | 6,730,182 |
| Homes rented (Census 2021) | 32.2% | 30.7% | 33.6% |
| Flats and apartments (Census 2021) | 21.6% | 16.9% | 19.6% |
Area: the Greater Capital City Statistical Area (ABS ASGS Edition 3). Residents counted by K-Stra on the address points inside it; yearly change: council estimates 2019–2025 weighted by the residents each council brings. Income index from ABS Personal Income 2022–23 (tax data), measured or estimated; consumption index derived from it; 100 = Australia. Spending per resident from the consumption index and ABS national accounts (5204.0) for 2024–25.
Which parts of Melbourne are largest, richest and youngest?
Melbourne – West is the most populous region, with 981,014 residents, followed by the South East with 958,182. Both have only around 7% of homes in flats, against 69.0% in Melbourne – Inner.
Melbourne – Inner South has the highest income index, 115.4, and the Mornington Peninsula the oldest residents, with a median age of 44.3.
| Region (SA4) | Residents 2025 | Median age | Income index | Flats (2021) |
|---|---|---|---|---|
| Melbourne – West | 981,014 | 35.1 | 100.0 | 7.5% |
| Melbourne – South East | 958,182 | 35.6 | 93.7 | 7.1% |
| Melbourne – Inner | 712,133 | 33.8 | 114.2 | 69.0% |
| Melbourne – North East | 590,882 | 37.4 | 103.6 | 7.3% |
| Melbourne – Outer East | 540,272 | 40.9 | 100.7 | 3.1% |
| Melbourne – North West | 474,975 | 35.9 | 97.8 | 3.0% |
| Melbourne – Inner South | 455,076 | 40.5 | 115.4 | 25.8% |
| Melbourne – Inner East | 401,147 | 39.6 | 101.2 | 24.8% |
| Mornington Peninsula | 317,586 | 44.3 | 95.4 | 2.8% |
Which Melbourne councils are growing fastest?
Melton grew 39.9% from 2019 to 2025, on average 6.65% a year and Wyndham 4.55%, in the west; Cardinia 3.19% and Casey 2.98%, in the south-east; Hume 3.08%, in the north. Casey, with 414,929 residents, is the largest council in the city.
Boroondara, one of the wealthiest established councils, and Nillumbik, on the green north-eastern edge, lost a few residents, at −0.10% and −0.17% a year. Greater Melbourne grew about 9.4% in all, on average about 1.56% a year.
| Council | Residents 2019 | Residents 2025 | Change a year | Median age | Income index |
|---|---|---|---|---|---|
| Casey | 352,006 | 414,929 | 2.98% | 34.9 | 96.5 |
| Wyndham | 273,201 | 347,830 | 4.55% | 33.4 | 98.9 |
| Hume | 235,370 | 278,885 | 3.08% | 34.4 | 90.9 |
| Whittlesea | 226,072 | 259,759 | 2.48% | 35.8 | 97.6 |
| Melton | 165,535 | 231,567 | 6.65% | 33.3 | 99.1 |
| Monash | 199,762 | 211,833 | 1.01% | 35.9 | 92.4 |
| Brimbank | 206,771 | 198,181 | −0.69% | 38.3 | 88.9 |
| Melbourne | 168,952 | 194,481 | 2.52% | 29.5 | 88.5 |
| Cardinia | 112,002 | 133,472 | 3.19% | 35.5 | 98.9 |
The eight largest councils mostly inside the city, then the fastest growing of those with more than 20,000 residents. Change on 2025 council boundaries; the average yearly change is the total change over the six years divided by six. Income index and median age are worked out from the addresses inside the city, so a council’s figure can differ slightly from the ABS figure for the whole council.
Which postcodes in Melbourne have the highest and lowest incomes?
The highest income indices are in 3207 Port Melbourne (140.7), 3142 Toorak (140.3) and 3143 Armadale (137.9), and, across the river, 3013 Yarraville (137.2). The lowest outside the student areas are 3061 Campbellfield and 3047 Broadmeadows, in the north.
Carlton (3053, 57.0), next to the University of Melbourne, and the CBD (3000, 62.4), where RMIT stands, have the lowest incomes of all; Clayton (3168, 69.4), around Monash University, is also among the lowest. Parkville is the youngest postcode, with a median age of 25.9; Capel Sound, on the Mornington Peninsula, the oldest, at 60.9.
| Highest income index | Residents | Median age | Income index |
|---|---|---|---|
| 3207 Port Melbourne | 19,263 | 42.2 | 140.7 |
| 3142 Toorak | 13,968 | 44.7 | 140.3 |
| 3143 Armadale (Vic.) | 10,083 | 37.1 | 137.9 |
| 3013 Yarraville | 17,427 | 37.5 | 137.2 |
| 3121 Richmond (Vic.) | 35,615 | 34.1 | 136.8 |
| Lowest income index | Residents | Median age | Income index |
|---|---|---|---|
| 3053 Carlton (Vic.) | 20,937 | 27.3 | 57.0 |
| 3000 Melbourne | 56,056 | 27.6 | 62.4 |
| 3061 Campbellfield | 5,953 | 38.8 | 68.5 |
| 3168 Clayton | 24,640 | 27.7 | 69.4 |
| 3047 Broadmeadows (Vic.) | 24,739 | 33.4 | 72.5 |
ABS postal areas with more than 5,000 residents inside the city, named after their most populous suburb; the part of each postcode inside the city boundary only. Income index: ABS personal income tax data for 2022–23, measured for councils and SA2 areas and estimated elsewhere; a postcode is the average of its addresses, weighted by residents, so it can differ from the council that contains it.
How much do residents of Melbourne spend, and how many businesses serve them?
Greater Melbourne has 13.14 restaurants and 10.74 bars and cafés per 10,000 residents, close to Sydney, and fewer real estate agencies, 4.25 against 5.48. Childcare, at 5.54, is the highest of the six cities.
| Category | Per resident | Total (A$ million) |
|---|---|---|
| Food and non-alcoholic beverages | A$5,071 | 27,542 |
| Alcoholic beverages, tobacco and narcotics | A$1,526 | 8,288 |
| Clothing and footwear | A$1,888 | 10,254 |
| Housing, water, electricity, gas and other fuels | A$12,995 | 70,579 |
| Furnishings, household equipment and routine household maintenance | A$2,310 | 12,546 |
| Health | A$3,909 | 21,231 |
| Transport | A$5,672 | 30,806 |
| Information and communication | A$974 | 5,290 |
| Recreation, sport and culture | A$5,525 | 30,008 |
| Education services | A$1,927 | 10,466 |
| Restaurants and accommodation services | A$4,578 | 24,864 |
| Insurance and financial services | A$4,234 | 22,996 |
| Personal care, social protection and miscellaneous goods and services | A$3,020 | 16,402 |
| All categories | A$53,629 | 291,273 |
| Per 10,000 residents | Melbourne | VIC | Australia |
|---|---|---|---|
| Supermarkets | 2.76 | 2.86 | 2.92 |
| Pharmacies | 2.33 | 2.45 | 2.63 |
| Gyms & fitness centers | 5.98 | 6.61 | 7.06 |
| Bars & cafés | 10.74 | 11.85 | 12.00 |
| Restaurants | 13.14 | 12.61 | 12.17 |
| Hairdressers | 9.04 | 9.22 | 9.31 |
| Childcare & early learning | 5.54 | 5.59 | 5.24 |
| Aged care & retirement living | 1.86 | 2.14 | 2.50 |
| Fuel stations | 2.02 | 2.99 | 3.74 |
| Real estate agencies | 4.25 | 4.48 | 5.34 |
| Hotels & accommodation | 7.43 | 14.74 | 15.11 |
Spending per resident from the consumption index and ABS national accounts (5204.0) for 2024–25; residents only, visitors not included. K-Stra places catalogue, October 2026, as the app classifies each business; residents at 30 June 2025.
What does this mean for choosing a location in Melbourne?
A single site in central Melbourne reaches more residents within 45 minutes than one in any other Australian city. For formats that draw from the whole metropolitan area, such as large-format retail or a flagship, that reach is the argument for the centre.
For everyday formats the growth corridors decide: the west, the north and the south-east add tens of thousands of residents a year, young and close to average income, in suburbs where shops and services follow the houses.
Inner Melbourne is two markets: students and young renters in Carlton, Parkville and the CBD, and some of the highest incomes in the country a few kilometres south-east. The postcode, not the distance from the centre, tells which one a site is in.
What else do people ask about Melbourne?
What is the population of Melbourne?
Greater Melbourne had 5,431,267 residents at 30 June 2025 (estimated from ABS council figures), 76.8% of Victoria. The City of Melbourne council, which covers the centre, had 194,481.
Is Melbourne bigger than Sydney?
Not by the ABS definition: Greater Sydney had 5,638,736 residents in 2025 and Greater Melbourne 5,431,267. But more people live within a 45-minute drive of the Melbourne CBD (4,762,581) than of the Sydney CBD (4,435,276), largely because Melbourne is flatter and more compact.
Where is Melbourne growing fastest?
In Melton (6.65% a year from 2019 to 2025) and Wyndham (4.55%) in the west, Cardinia (3.19%) in the south-east and Hume (3.08%) in the north.
Draw your catchment
in Melbourne.
The app opens on Melbourne with drive bands of 15, 30 and 45 minutes ready: type an address and see who lives within reach.
Open the app — free to exploreDrawing an area is free; you pay only for the analyses you run