
How can property developers and investors measure what an area will support?
A site is worth what the people around it will spend, rent and buy. Here is how to read growth, prices and commercial demand on the same map.
Property developers and investors measure what an area will support by combining three things: how fast the population within reach is growing, what homes sell and rent for nearby, and how much retail and service demand residents create against the businesses already there. Together they show whether a site can carry homes, shops or both.
What do developers and investors need to know about an area?
How fast is it growing?
Residents year by year for every council in reach, with age and households from the Census.
Demographic analysisWhat do homes sell and rent for?
Asking prices and rents from listings, by postcode, with how many homes sold and how reliable the sample is.
Real estate location analysisWhich shops can the area support?
Residents’ spending in each sector against the businesses already there, and where demand is least served.
Market potential analysisWhere would a store do best?
The five best locations for a sector, at least 500 m apart, with commercial listings nearby.
Retail site selection
Why is it hard to judge what a growing area will support?
Growth corridors move faster than their services. Households arrive first; supermarkets, clinics and childcare follow years later. A developer who reads only today’s shops sees no demand, and one who reads only the housing pipeline sees too much.
The figures live in different places: population in ABS releases, prices in property portals, businesses in online listings. Each is published for different areas, so putting them on one boundary takes days of work for a single site.
K-Stra puts them on the same catchment, drawn on the road network around the site. Growth, prices and commercial demand become three tables about the same people, instead of three reports about three different areas.
Which data does K-Stra give for a site?
Population and growth
ABS estimates at 30 June 2025 spread onto addresses, with the trend since 2019 by council.
Population dataPrices and rents
Residential and commercial listings by postcode: asking prices, rents, yields, properties sold and trends.
Real estate dataCommercial demand
Seventy-eight business sectors with residents’ spending, competition and market gaps.
Business and competition dataHousing stock
Dwelling type, tenure and household size from the ABS Census 2021.
Housing data
How much has a growth corridor grown, and are the shops keeping up?
Clyde North sits in the City of Casey, on Melbourne’s south-eastern growth front. Within a 10-minute drive of 31 Thompsons Road, Clyde North VIC live 139,510 people, 40% of them born overseas. The council as a whole went from 352,006 residents in 2019 to 414,929 in 2025: 62,923 more people, or 17.9% in 6 years, on average 2.98% a year.
That is about 10,500 new residents a year in one council. The question for anyone building homes or shops here is whether the services have kept pace, and the supermarket count gives a first answer.
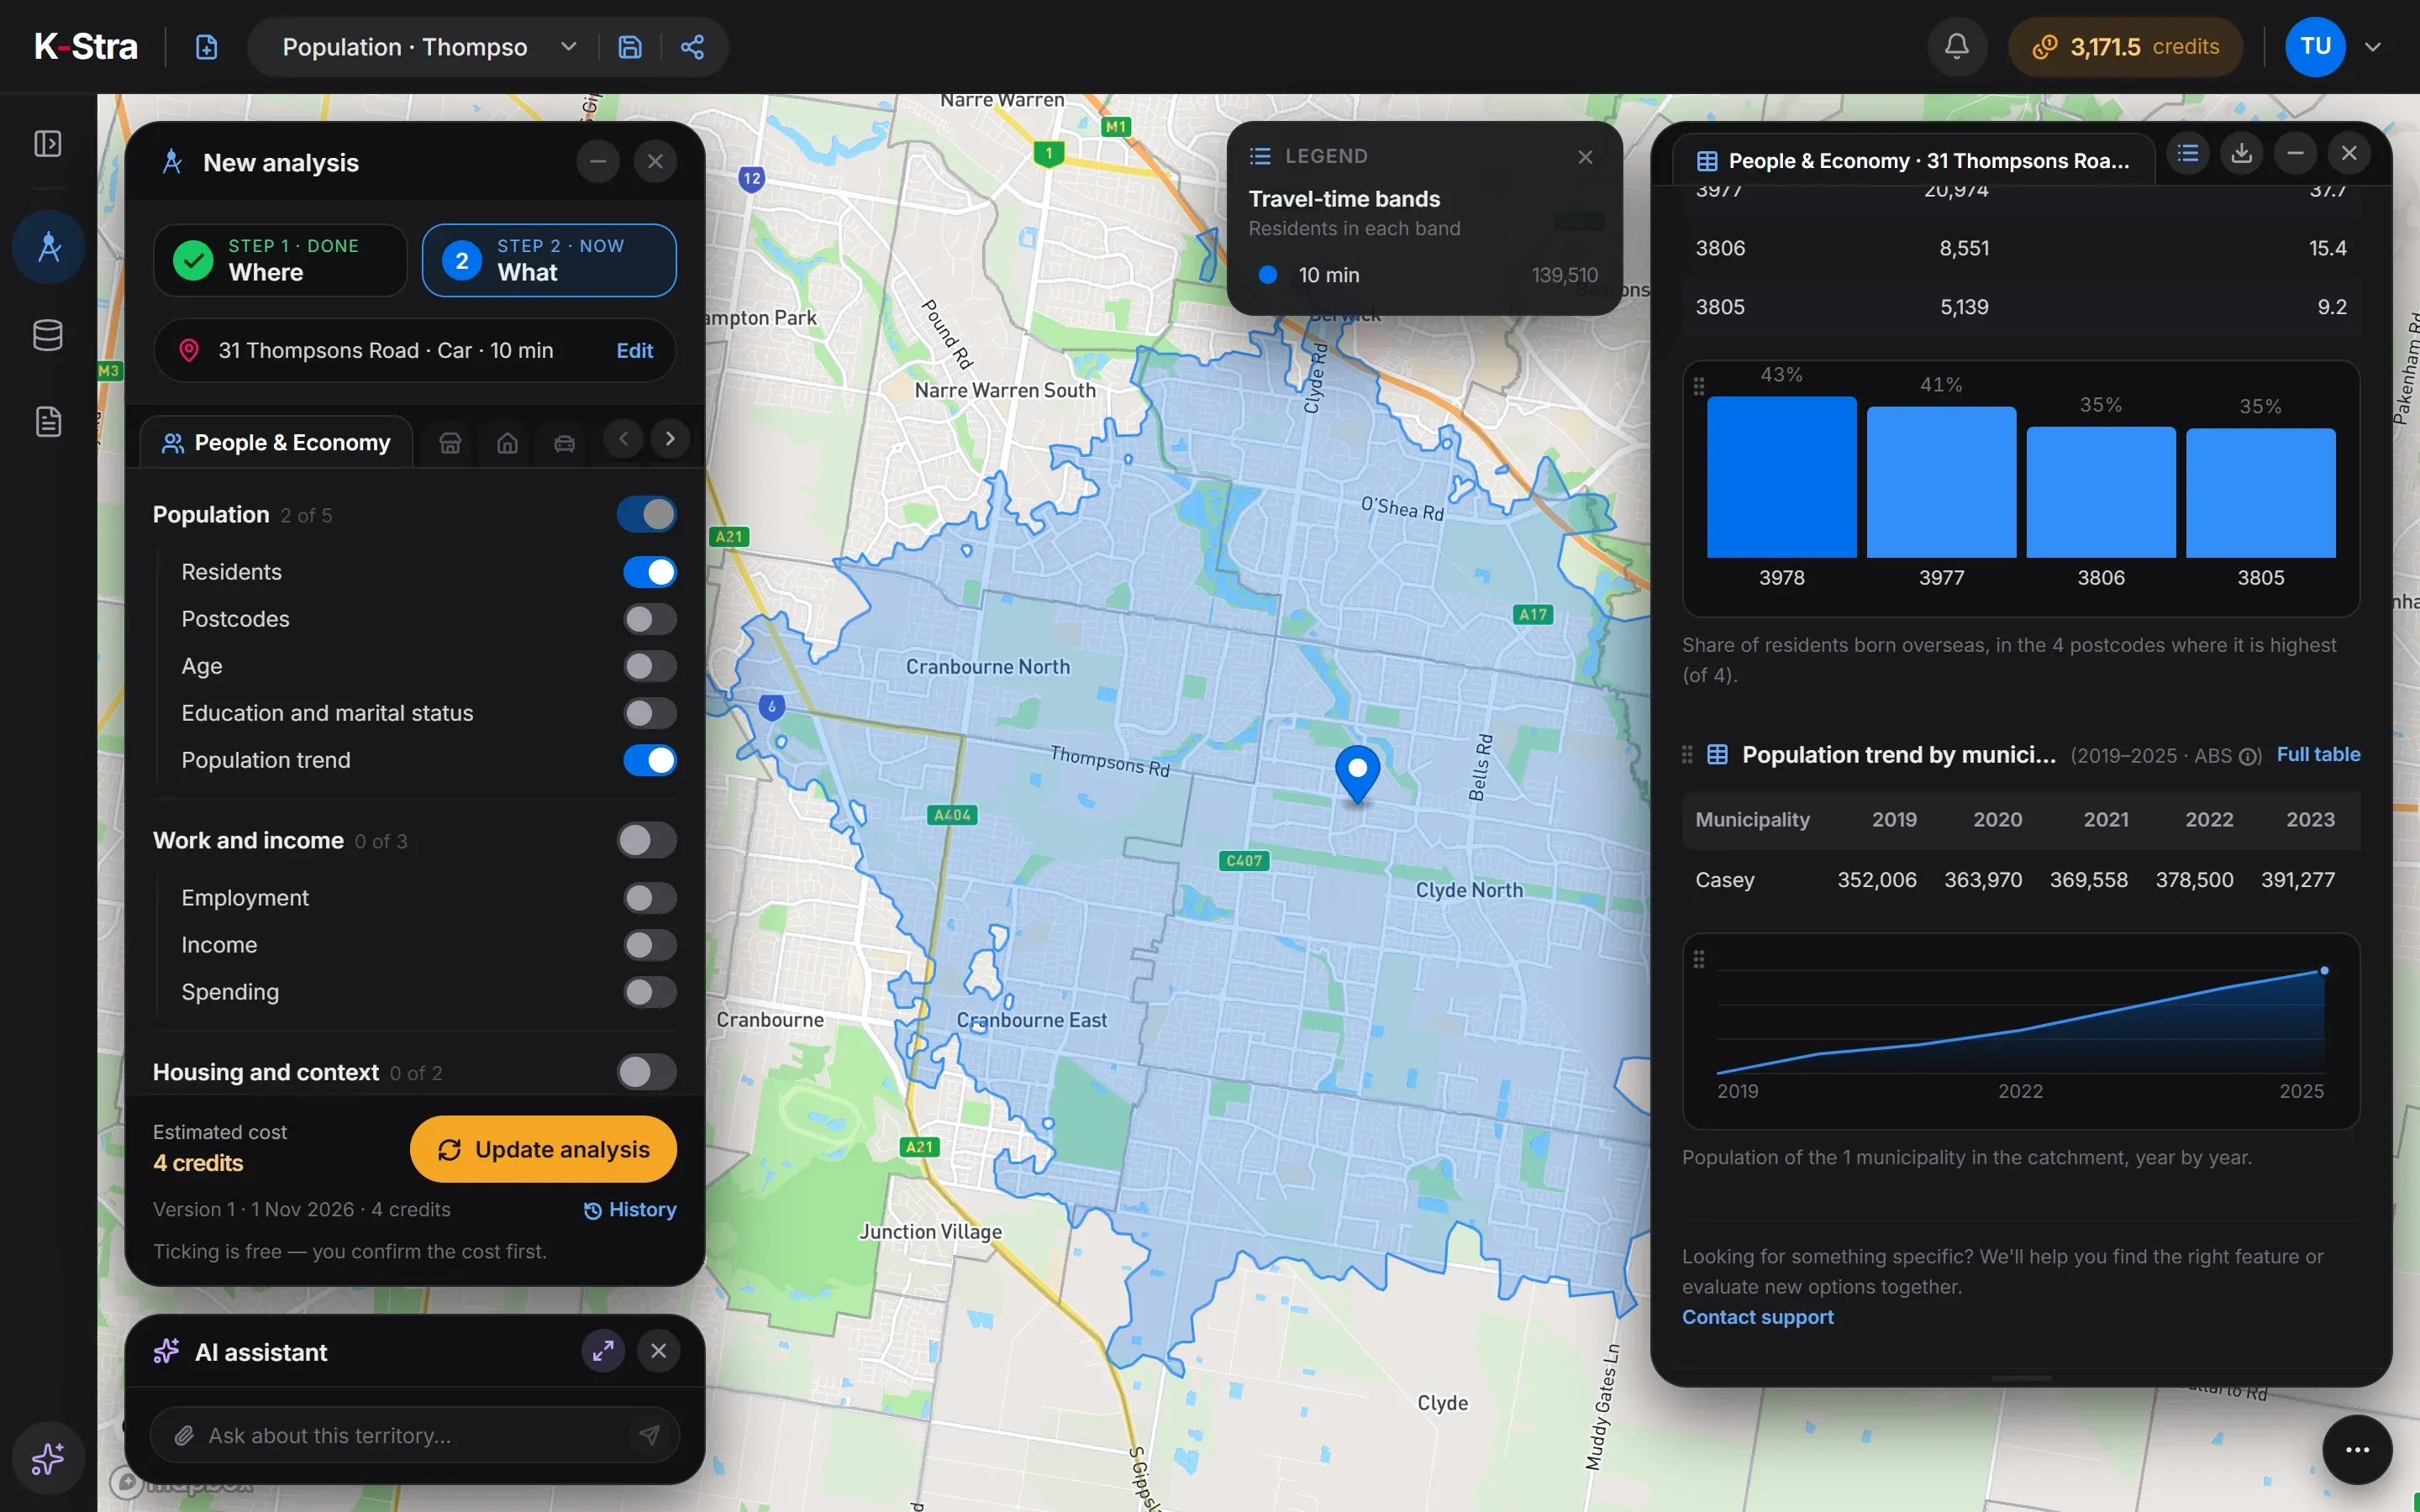 Population · Casey
Has retail kept up with the population?
Supermarkets within 10 minutes by car of 31 Thompsons Road, Clyde North VIC: 31 for 139,510 residents, 2.22 per 10,000 against 2.86 in Victoria. 18 of them show an estimated sales band, 14 of those between A$20 and A$50 million a year — estimates, not reported figures.
| Area | Supermarkets | Residents | Per 10,000 residents |
|---|---|---|---|
| Catchment | 31 | 139,510 | 2.22 |
| Casey (council) | 98 | 414,929 | 2.36 |
| Victoria | 2,023 | 7,073,859 | 2.86 |
| Australia | 8,066 | 27,613,654 | 2.92 |
Sources: K-Stra analysis of 1 November 2026: supermarkets, residents and the population trend within a 10-minute drive in average traffic of 31 Thompsons Road, Clyde North. Businesses: K-Stra places catalogue, October 2026. Residents and trend: ABS Estimated Resident Population, 2019 to 30 June 2025. Spending: ABS national accounts, 2024–25.
What does that mean for a site in Clyde North?
At the Victorian rate the catchment would have about 40 supermarkets; it has 31. The Casey figure, 2.36, is also below Victoria and Australia at 2.92: supply trails a population that keeps arriving.
The opportunity map agrees. Its best location is vacant land near 58E Hamersley Drive, Clyde North, next to a parcel of 15,172 m², and the highest market gap is near 31 Murgese Circuit, Clyde North, at 164 against 100 for the typical spot. Residents only, at the last ABS count: the homes still being built will add to it.
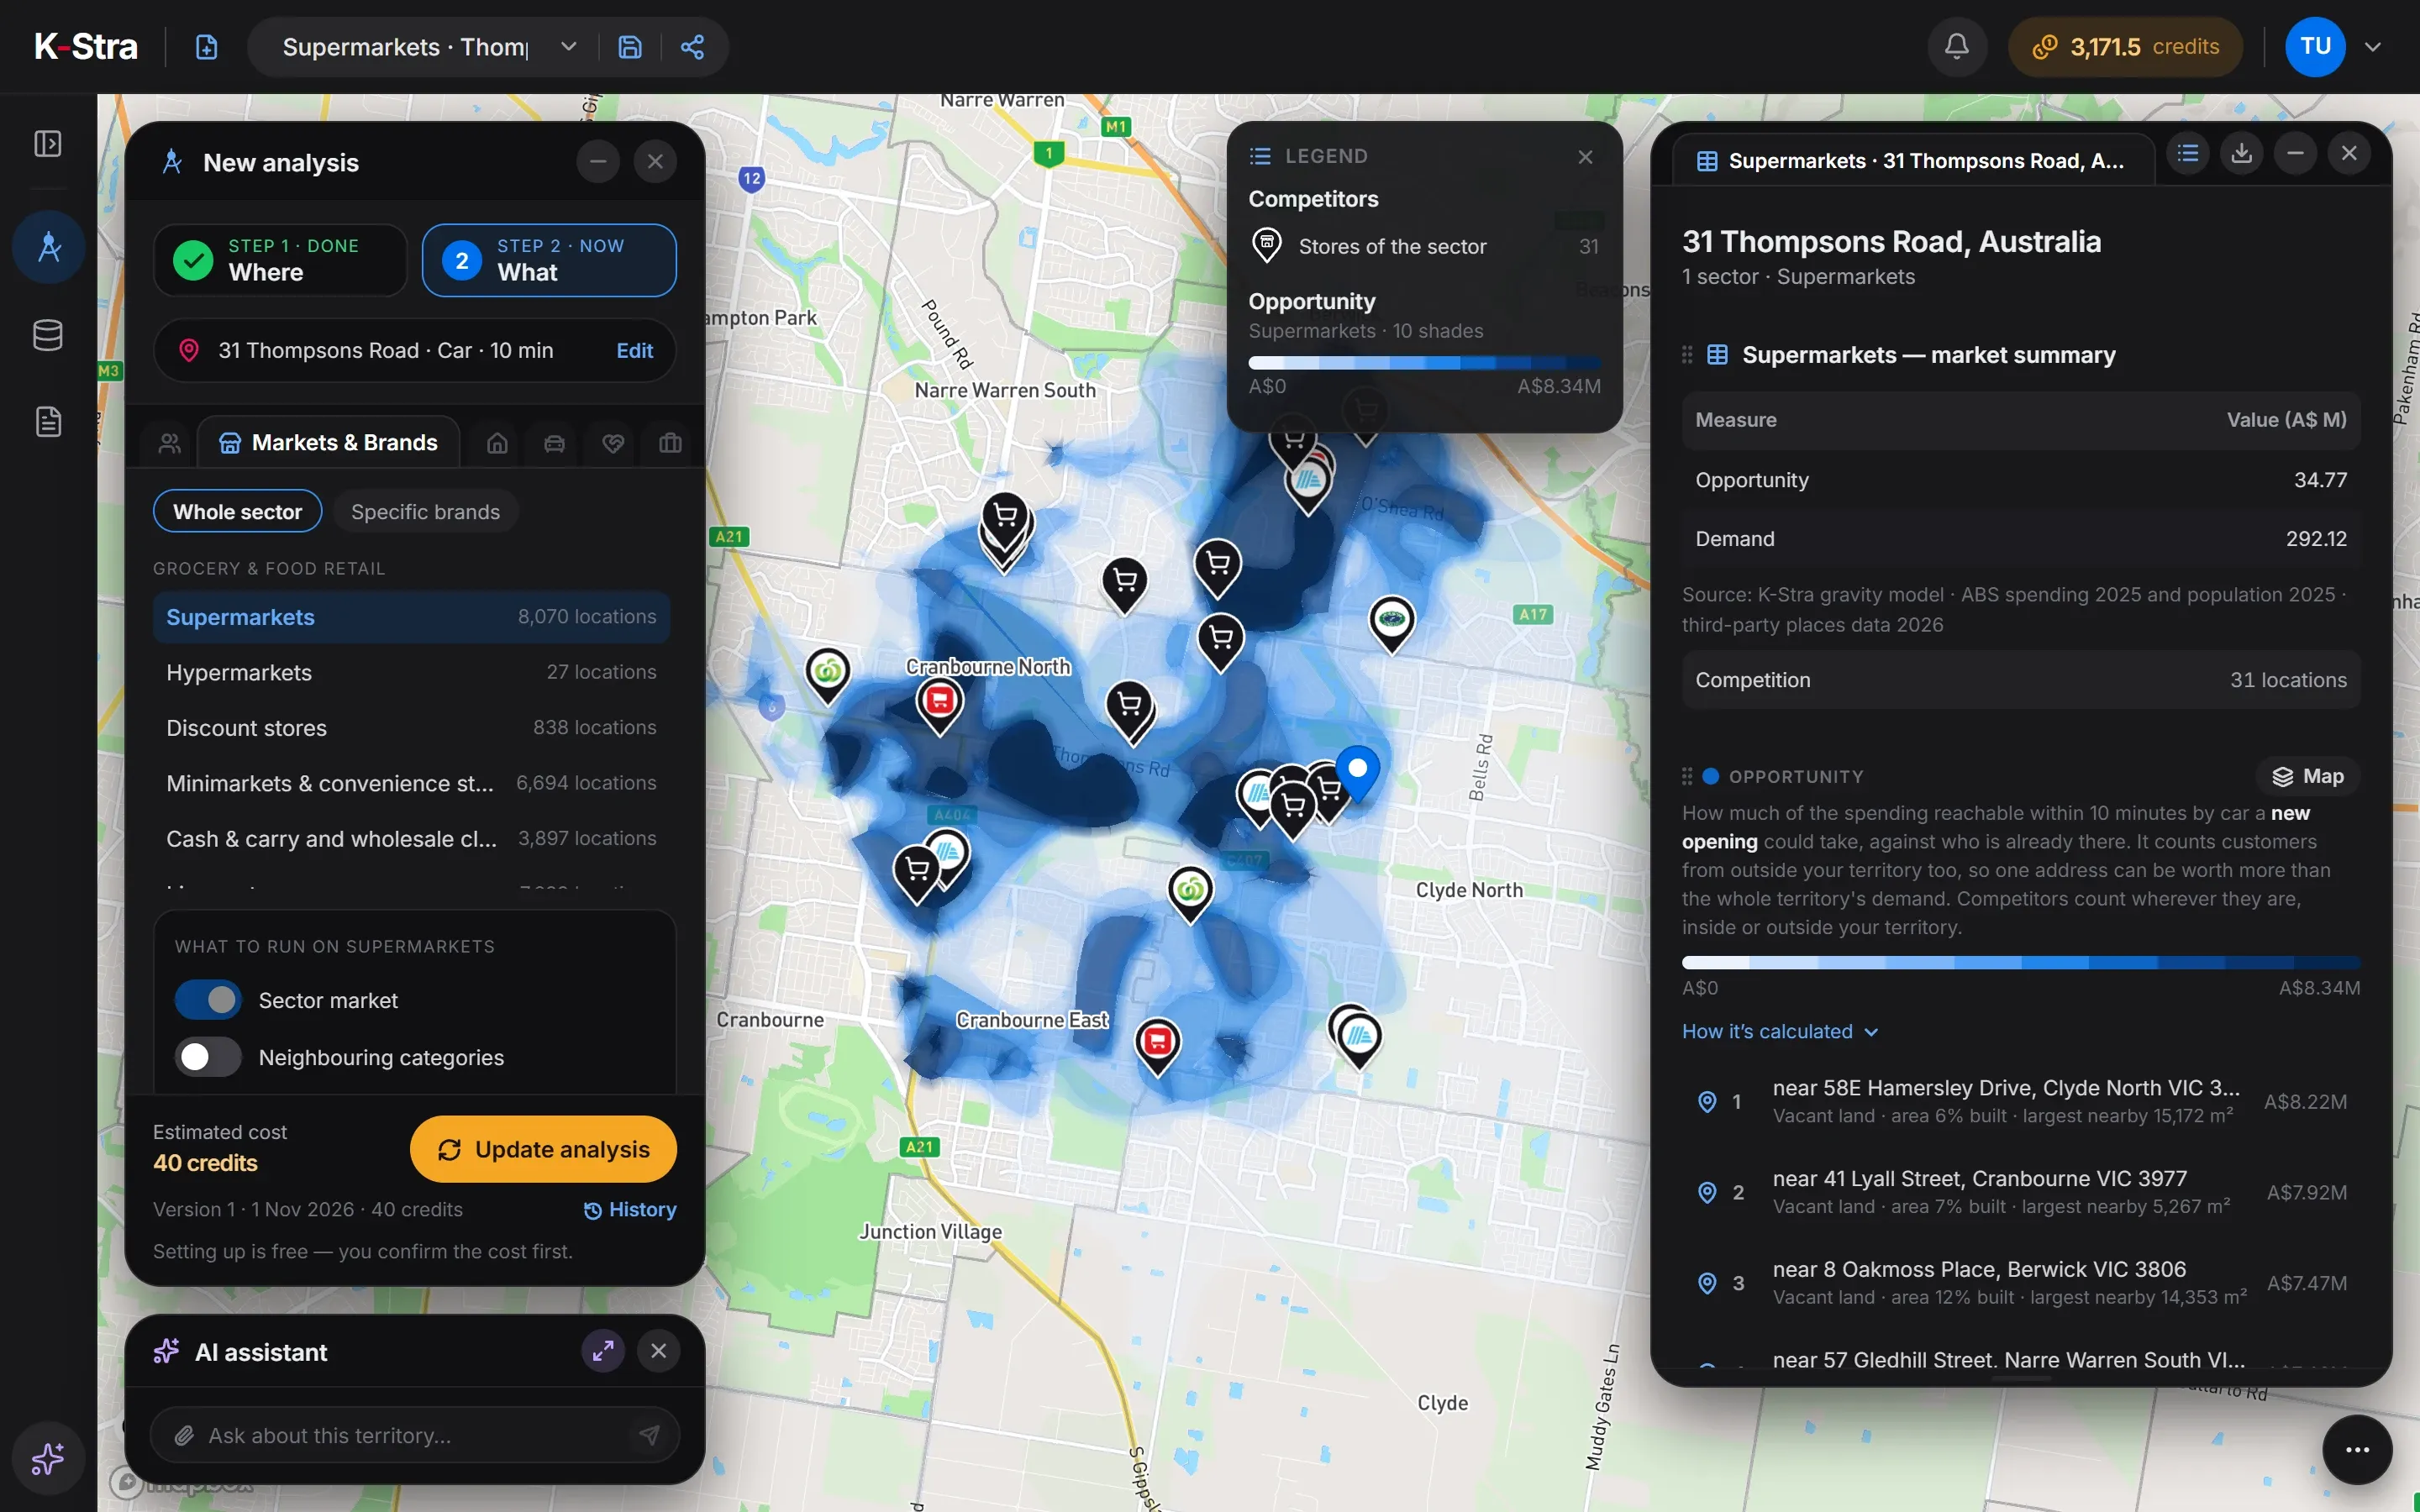 Opportunity · Clyde North
How much does it cost to assess an area?
The size of the area does not change the price: a whole growth corridor costs the same as one estate. Each extra sector of a planned centre adds 40 credits.
- People & Economy, Residents and Population trend2 credits per topic4 credits
- Markets & Brands, one sectorper sector, any area40 credits
- Maps, tables and exportsFree
- The Clyde North example= 44 credits
- ≈ A$67 at the Single report pack rate of A$1.53 a credit; less with larger packs and monthly plans.
Optional, not in the total
- Real Estate, prices and rentsper analysis+ 20 credits
- One propertyper property+ 20 credits
The cost appears before the analysis runs, and an analysis that fails costs nothing.
What else do developers and investors ask?
Can K-Stra estimate a price for a property?
Yes, for homes: One property gives an estimated price range from comparable listings nearby, with the local market, services in reach and how quickly similar homes sell, at 20 credits. It is market evidence a value can be set on, not a formal valuation. Real Estate gives prices, rents and listings for the whole area at 20 credits.
How does K-Stra know how fast an area is growing?
From the ABS Estimated Resident Population, year by year from 2019 to 30 June 2025, for every council in the catchment. It is the Population trend topic of People & Economy, at 2 credits.
Can I check whether a neighbourhood centre would work in a new estate?
Yes. Run the sectors the centre would hold — supermarket, pharmacy, childcare, gym — around the site, each at 40 credits: residents within reach, competitors per 10,000 residents and where demand is least served.
Does K-Stra know about future housing that is not built yet?
No. It counts the residents living there at the last ABS estimate, spread onto existing addresses. Approved or planned dwellings are not in the data, so in fast-growing estates the numbers are a floor that rises every year.
Are commercial property prices included?
Yes. Real Estate works on residential and commercial listings by postcode: median asking prices and rents, price per square metre, gross yield and properties sold. They are asking prices, not recorded sales. A sector analysis also lists commercial properties for lease or sale within 500 m of its best locations.
Read growth, prices
and demand together.
Pick a site, draw its catchment and see population, property and commercial demand on one map.
Open the app — free to exploreExploring the map is free; you pay only for the analyses you run