
What should a site selection scorecard include?
When three or four sites are all plausible, the decision is made by how you compare them. A scorecard makes that comparison explicit, and honest.
A site selection scorecard rates every candidate on the same measured criteria — residents within reach, their spending power, competitors, the spending the site could capture, access and cost — scales each criterion from worst to best, and combines them with weights agreed before the numbers are seen. The site visit then tests the winner, not the shortlist.
This guide is about comparing a shortlist on a scorecard. How to reach the shortlist, from the first catchment to the lease, is in how to choose a store location.
Why compare sites on a scorecard instead of by feel?
Without a scorecard each site is judged on its best feature: one for its traffic, another for its rent, a third because the founder likes the street. The comparison is never like for like, and the loudest argument wins.
Research on how retailers choose locations has followed the move from intuition to formal techniques for decades. The pattern is consistent: formal methods spread, and the site visit stays part of the process.
A scorecard does not replace judgement. It records it: which criteria counted, how much, and which numbers each site achieved. That record is what a board, a landlord or a franchisee can check later.
Sources: Hernández and Bennison (2000), International Journal of Retail & Distribution Management 28(8); Reynolds and Wood (2010), International Journal of Retail & Distribution Management 38(11/12).
Which criteria belong on a site scorecard?
| Criterion | What it measures | How to measure it |
|---|---|---|
| Residents within reach | The size of the market | People within the drive or walk your customers make, counted on the road network |
| Spending power | How much each resident can spend | An income or consumption index against the Australian average |
| Competitors | How many share the market | Businesses of your sector within the catchment, and per 10,000 residents |
| Captured spending | What the site could win | A gravity model of residents’ spending among all stores, including yours |
| Overlap with your stores | What the site would take from you | Residents or spending shared with your existing stores |
| Hard constraints | Whether the site is possible at all | Zoning, size, rent, lease terms and any legal distance rule |
| Access and visibility | How easy the site is to use | Parking, entrances, frontage and the street at trading hours, on the visit |
The government’s guide for new businesses lists most of the same factors — distance from customers, competitors, access, size, cost, zoning and demographics — and points to the ABS Census for the numbers. Source: business.gov.au, “Choose your business location”.
How do you build and use a scorecard, step by step?
Agree the criteria and weights first
Write down what matters and how much before any site is measured, so that the favourite site cannot bend the rules.
Build a long list
Collect candidates from listings, brokers, the best locations of a market analysis and your own ideas. Ten is not too many.
Screen out the impossible
Drop sites that fail a hard rule — zoning, size, lease terms, a legal distance from a competitor — before measuring anything.
Measure every site the same way
Same catchment time, same data, same date. A site measured differently is not comparable, however good its numbers look.
Scale and weight
Turn each criterion into a score from worst to best within the shortlist, multiply by its weight and add up.
Test the weights
Change the weights within reason and see whether the winner changes. A site that wins under every sensible weighting is a safe choice.
Visit the top two
Look at access, parking, visibility and the street at trading hours. The visit can overrule the score, but it should say why.
How do four real candidate sites score?
Four candidate supermarket sites within a 10-minute drive from Chapel Street, South Yarra, Melbourne VIC, measured on 7 October 2026 with the same model and a 10-minute catchment each. Each criterion is scaled from 0 for the weakest of the four to 10 for the strongest.
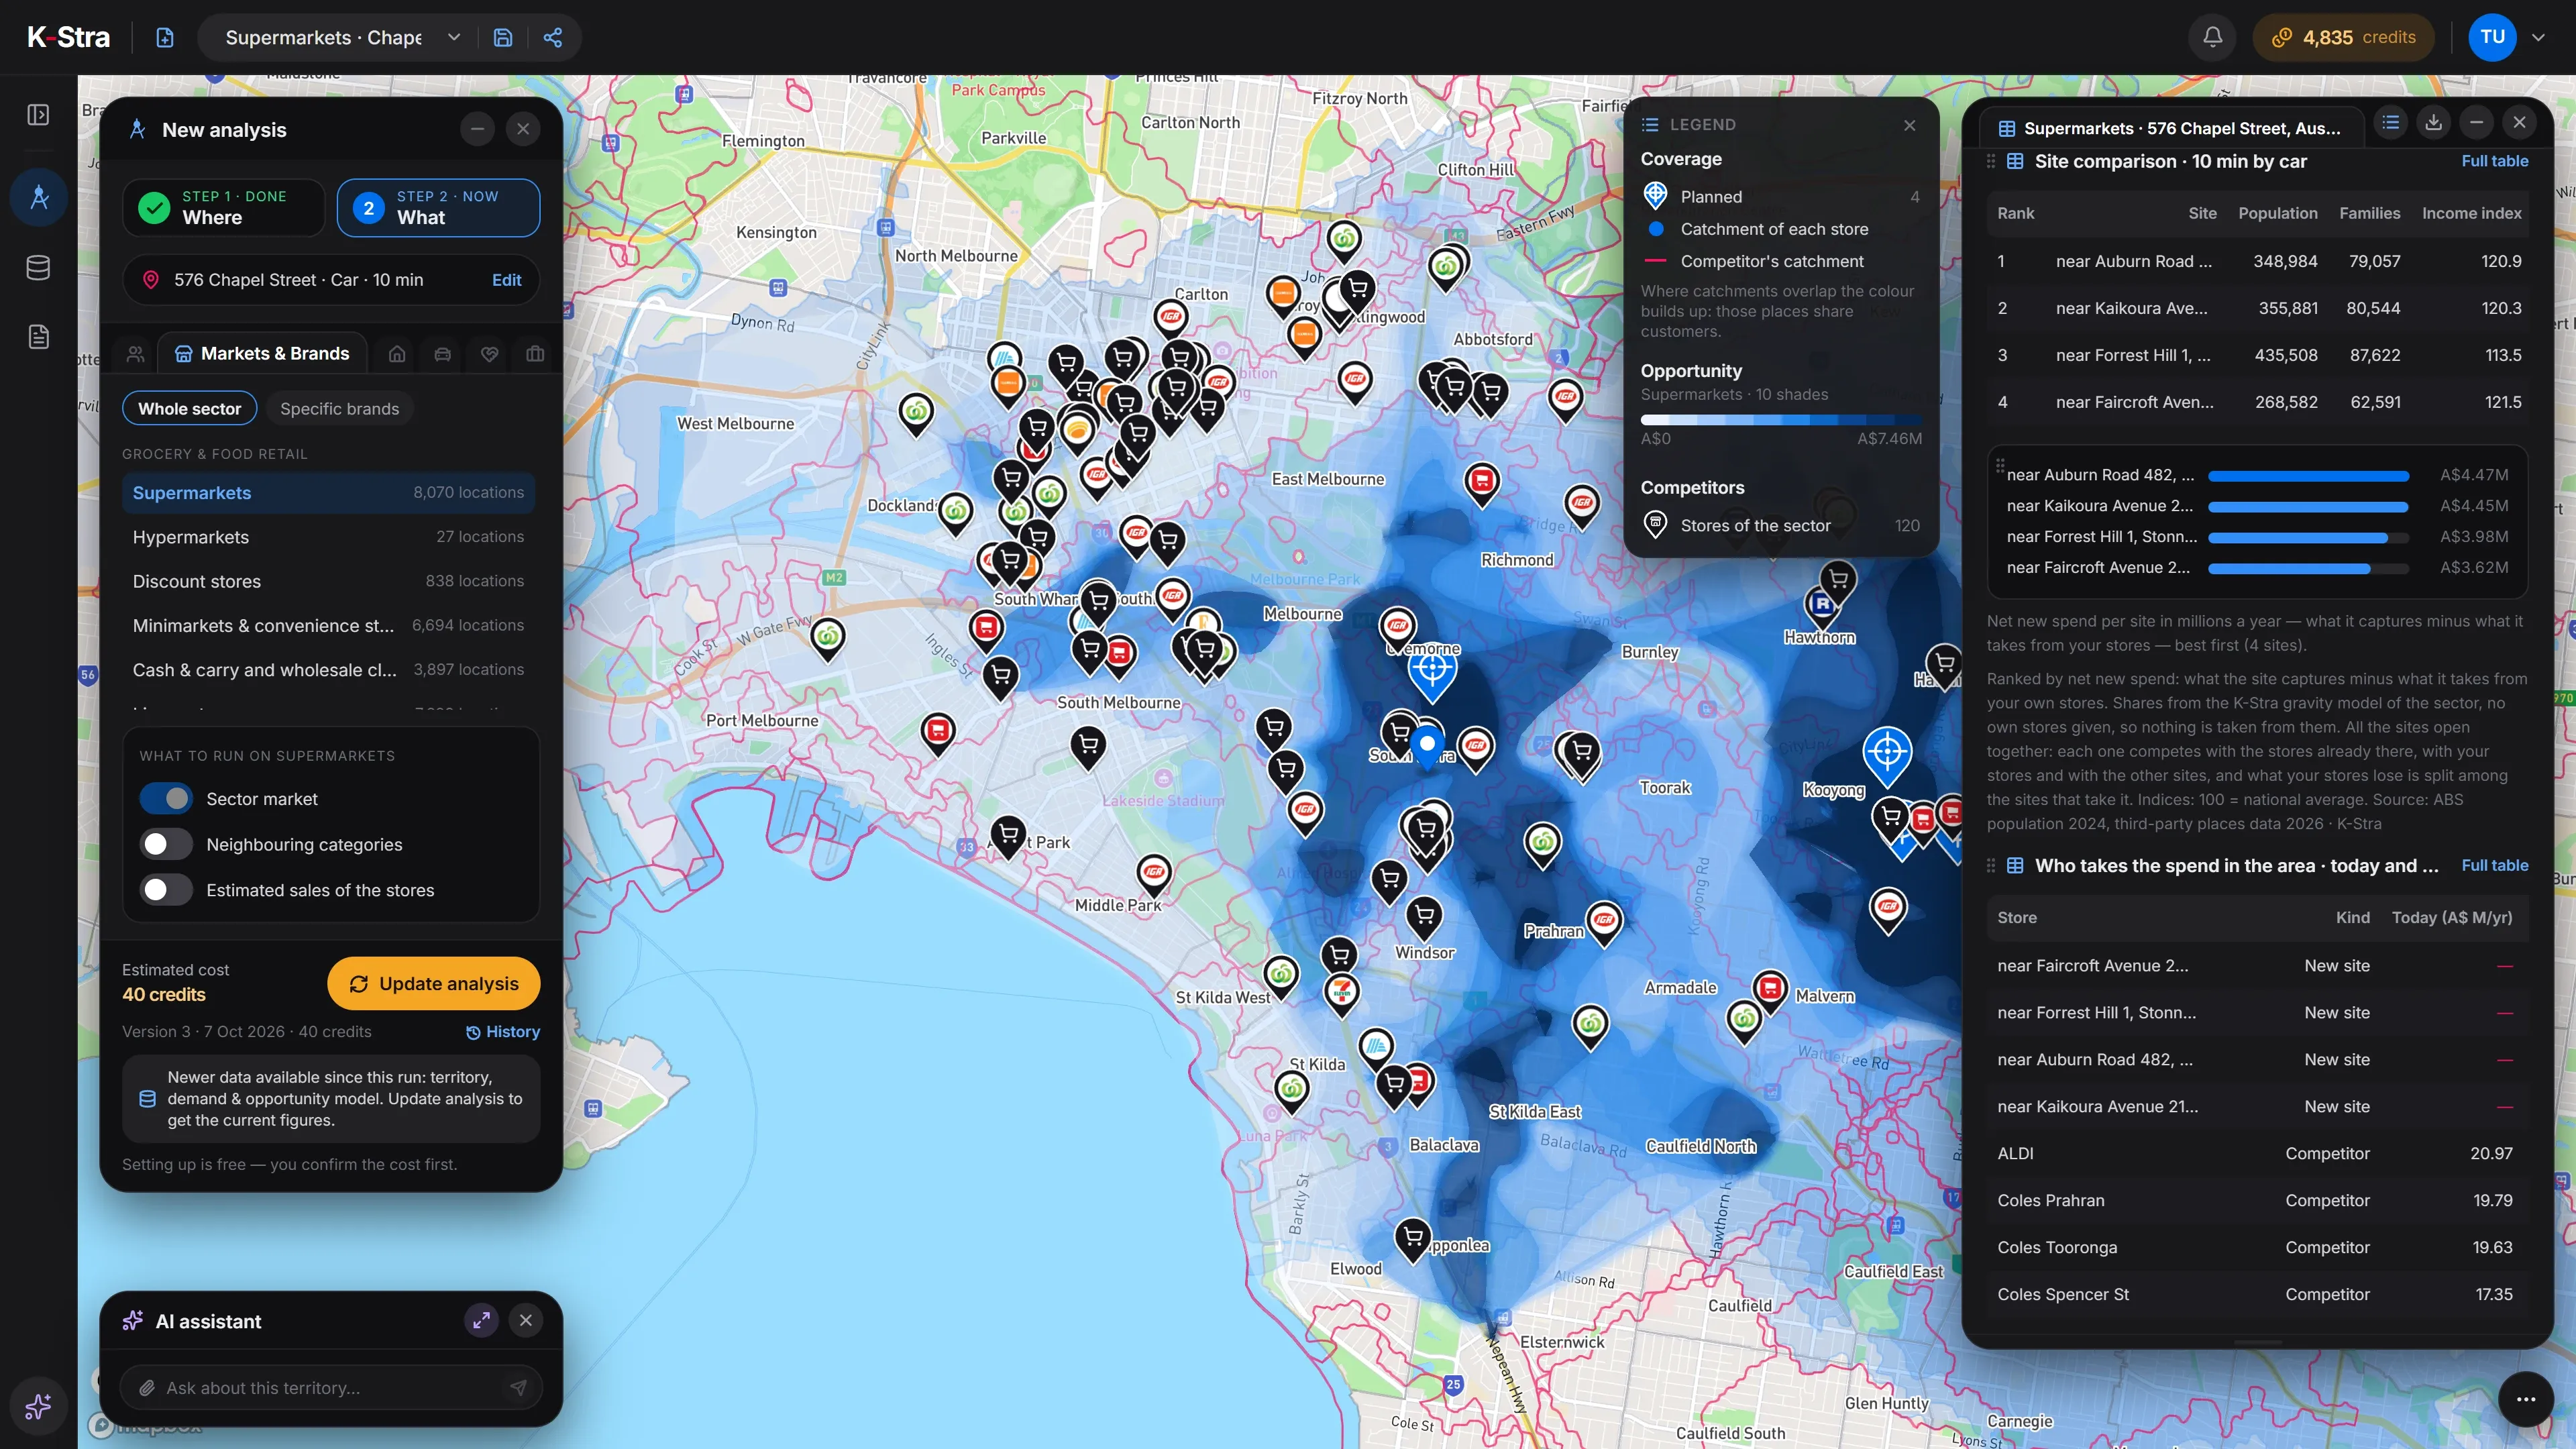 Compare sites · South Yarra
| Site | Captured spending | Residents | Competitors | Spending index | Balanced | Competition first |
|---|---|---|---|---|---|---|
| 482 Auburn Road | 10.0 | 4.8 | 6.6 | 9.2 | 8.1 | 8.0 |
| 21 Kaikoura Avenue | 9.8 | 5.2 | 6.7 | 8.5 | 8.0 | 7.8 |
| 1 Forrest Hill | 5.8 | 10.0 | 0.0 | 0.0 | 4.3 | 2.7 |
| 2A Faircroft Avenue | 0.0 | 0.0 | 10.0 | 10.0 | 4.0 | 6.0 |
Weights — Balanced: captured spending 40%, residents 20%, competitors 20%, spending index 20%. Competition first: captured spending 30%, residents 10%, competitors 40%, spending index 20%. Measured values: captured spending from A$5.02 to A$6.23 million a year of modelled residents’ spending, residents from 268,582 to 435,508, competitors from 53 to 132. Source: ABS population 2024 (families: 2021 Census); income and spending indices, 100 = Australian average; supermarket spend of the residents from ABS household spending 2025 and the K-Stra sector model; competitors from the K-Stra places catalogue 2026. All four sites assessed as opening together. K-Stra analysis of 7 October 2026.
With balanced weights 482 Auburn Road comes first, a fraction ahead of its neighbour; the two Boroondara sites share most of their catchment and score almost alike. The site at 1 Forrest Hill reaches the most residents but faces 132 competitors, and the one at 2A Faircroft Avenue has the fewest competitors but the smallest market.
Put competition first and 482 Auburn Road still leads, while 2A Faircroft Avenue moves from fourth to third. A site that stays on top under different sensible weights is a safe choice. Captured spending here is a modelled share of residents’ spending, useful to compare sites of the same sector in the same area, not an estimate of sales.
What else do people ask about site selection scorecards?
What criteria should a retail site scorecard include?
At least: residents within a realistic drive or walk, their income or spending power, the number of competitors and their pull, the spending the site could capture, and the hard constraints — zoning, size, rent and lease terms. Access, parking and visibility are scored on the visit.
How should I weight the criteria?
By what drives your format. Destination stores weight residents and spending power; convenience formats weight competition and access; services weight the right age group. Agree the weights before measuring and test whether small changes alter the winner.
Is the site visit still necessary?
Yes. Studies of retailers’ location practice find that formal techniques sit alongside the site visit, not instead of it. Data narrows the list and makes the comparison fair; the visit checks what data cannot see, such as the shopfront and the street at trading hours.
Can I compare sites in different cities on one scorecard?
Only with care. Spending indices and densities travel well; counts of residents do not, because a 10-minute drive holds very different populations in a capital and a regional town. Score each market separately, then compare the winners.
Measure every site
the same way.
Run your sector once, add up to five candidate sites and get the numbers for your scorecard side by side.
Open the app — free to exploreExploring the map is free; you pay only for the analyses you run