
What are demand, supply and opportunity in a local market?
Four words that describe a local market. On the same map they usually peak in different places, and the differences are where decisions are made.
Demand is the spending on a sector that can be reached from a point within the sector’s usual travel time. Supply, or competition, is the pull the existing stores exert on that point. Opportunity is where demand outweighs that pull, and market gap is the spending within reach per unit of competition. Together they show where a market is underserved.
What does each of the four layers measure?
| Layer | What it measures | Unit | High values mean |
|---|---|---|---|
| Demand | Yearly spending on the sector reachable from each point within the sector’s travel time | A$ a year | Many residents, or residents who spend a lot, within reach |
| Competition | The pull existing stores exert on each point, by size and distance | Index from 0 | Several stores, or strong ones, close by |
| Opportunity | Where demand within reach outweighs the pull of existing stores | A$ a year | A large market that existing stores serve poorly |
| Market gap | Spending within reach for each unit of competition | Index, 100 = typical spot | Above 200: a market and few competitors |
Demand comes from residents and what they spend: ABS population placed on addresses, and ABS household spending shared out to each sector and each area by income. Competition comes from every business of the sector, weighted by distance in the way gravity models — from Reilly in 1931 to Huff in 1963 — have described for nearly a century.
How do the four layers look on the same town?
Supermarkets within a 10-minute drive of 1 Baylis Street, Wagga Wagga NSW, analysed on 1 November 2026. The same analysis, with the map coloured by each layer in turn.
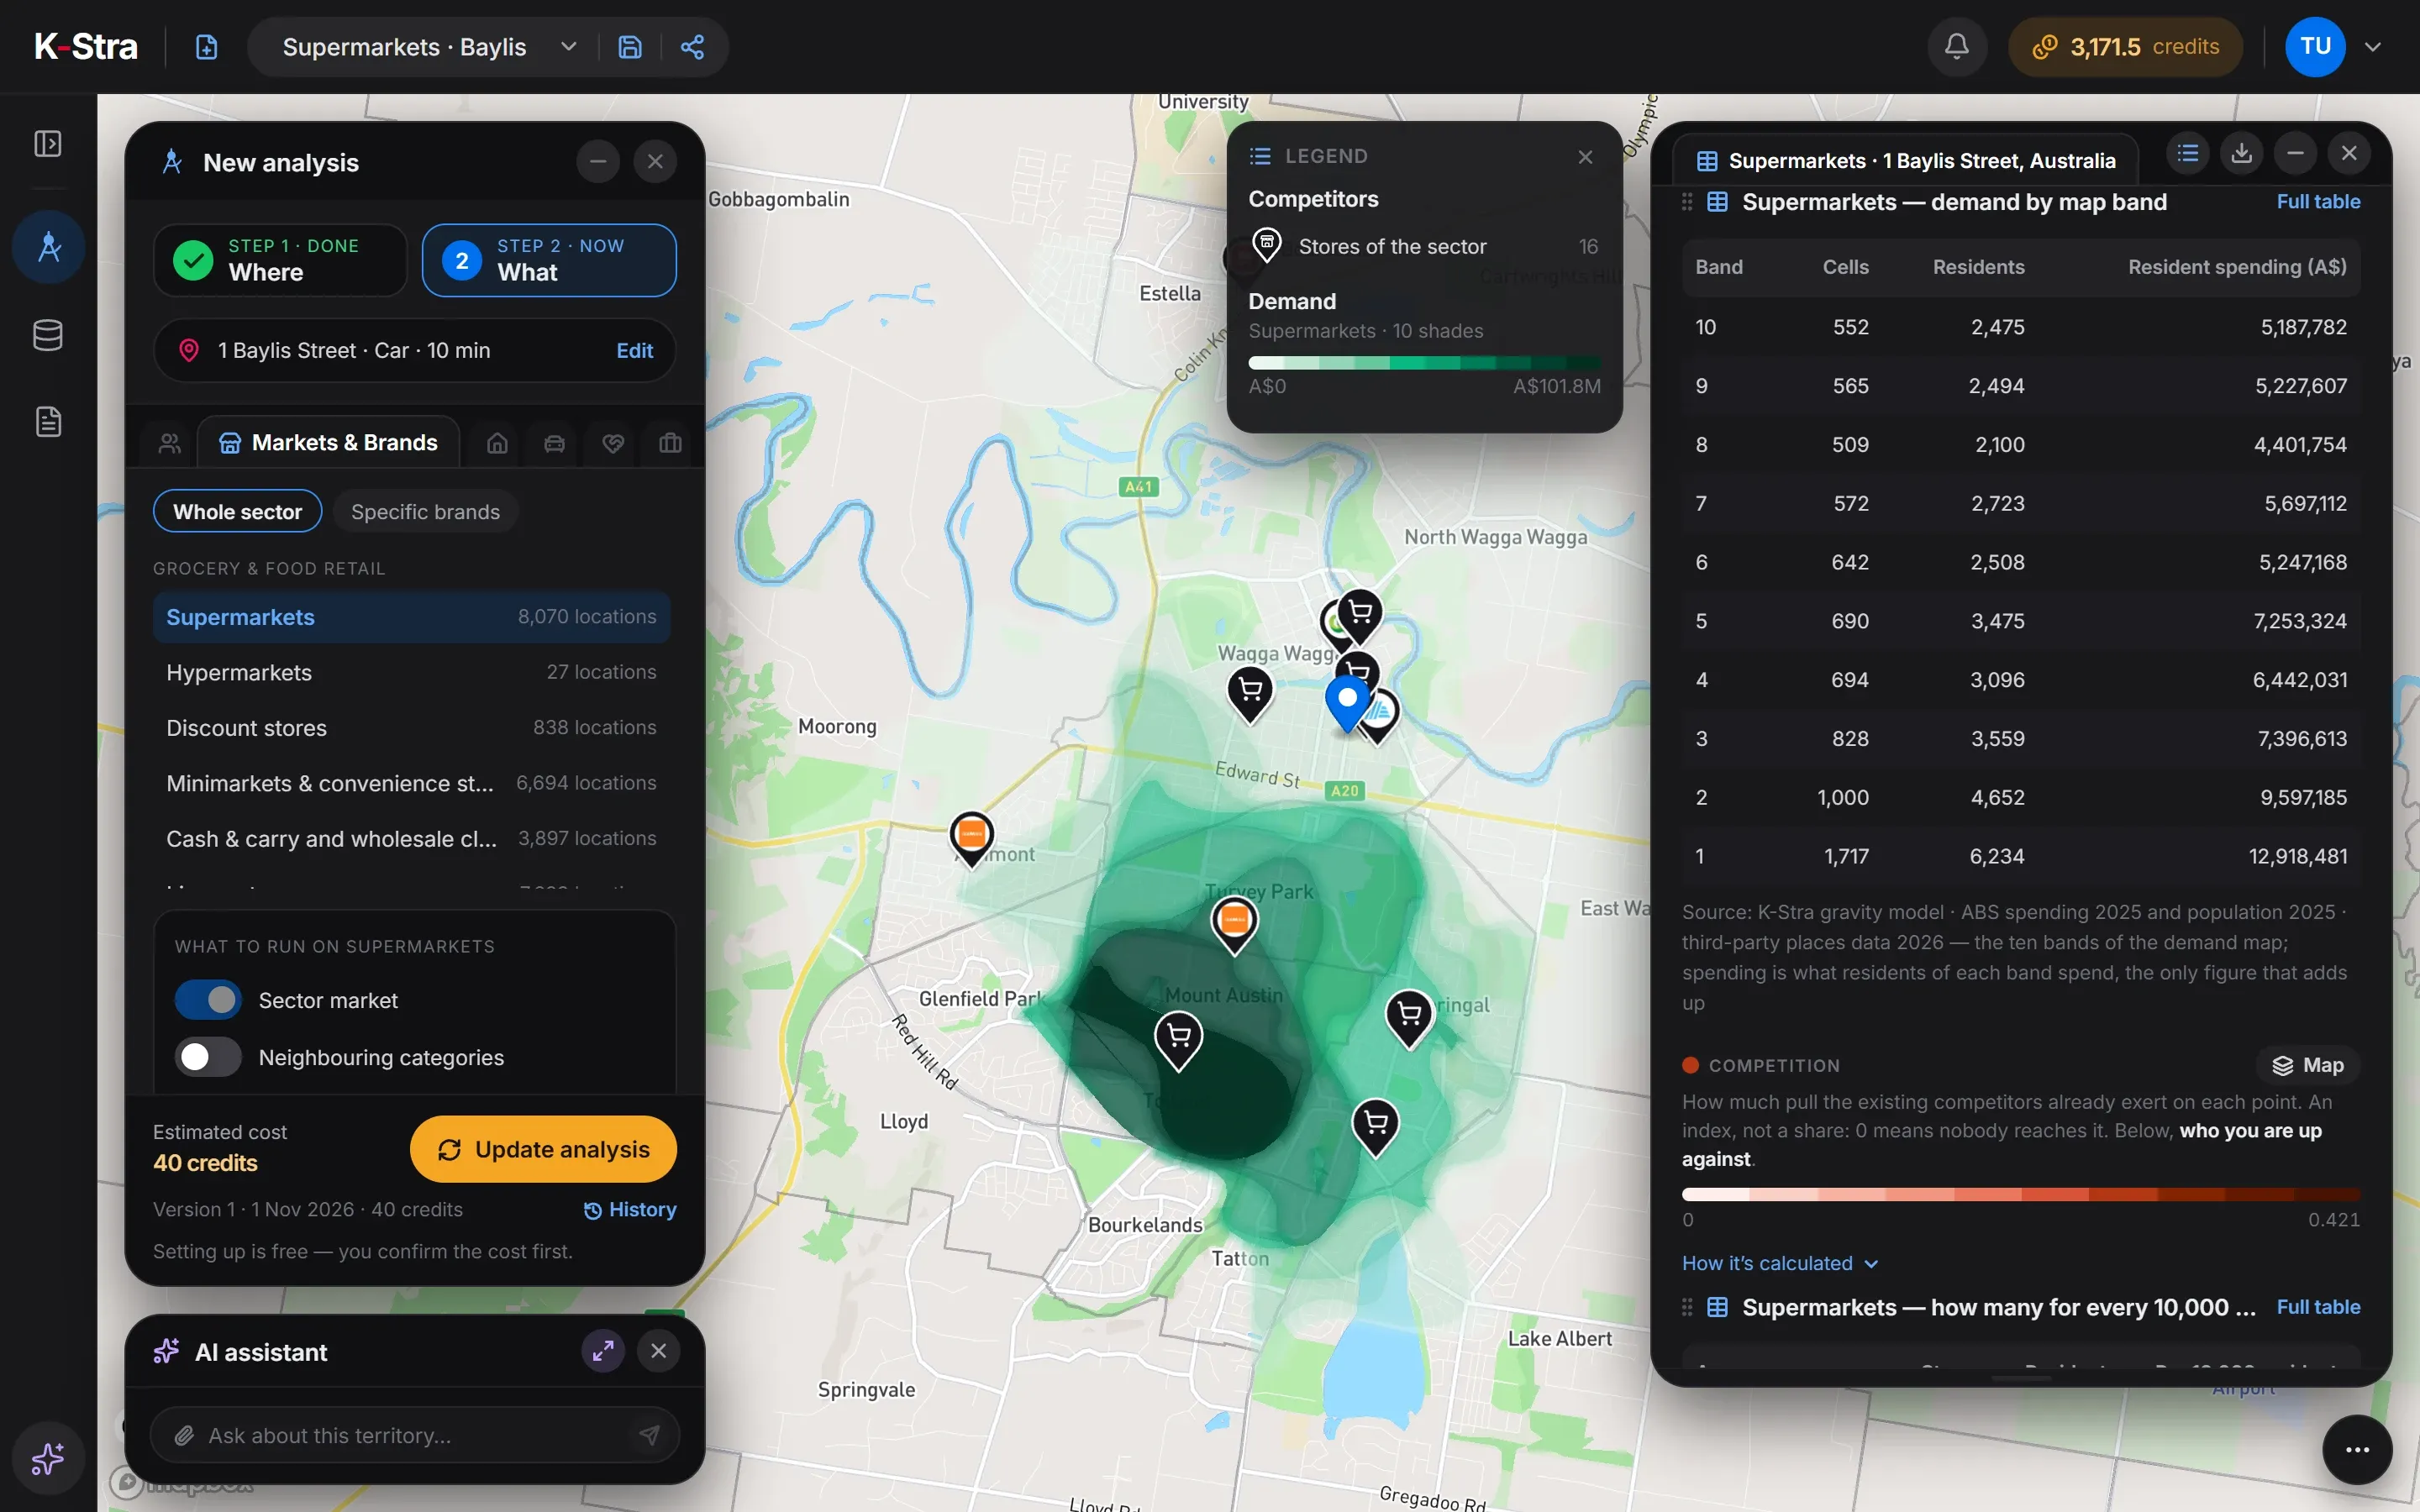 Demand
Darkest in the centre, where the most residents can be reached within ten minutes.
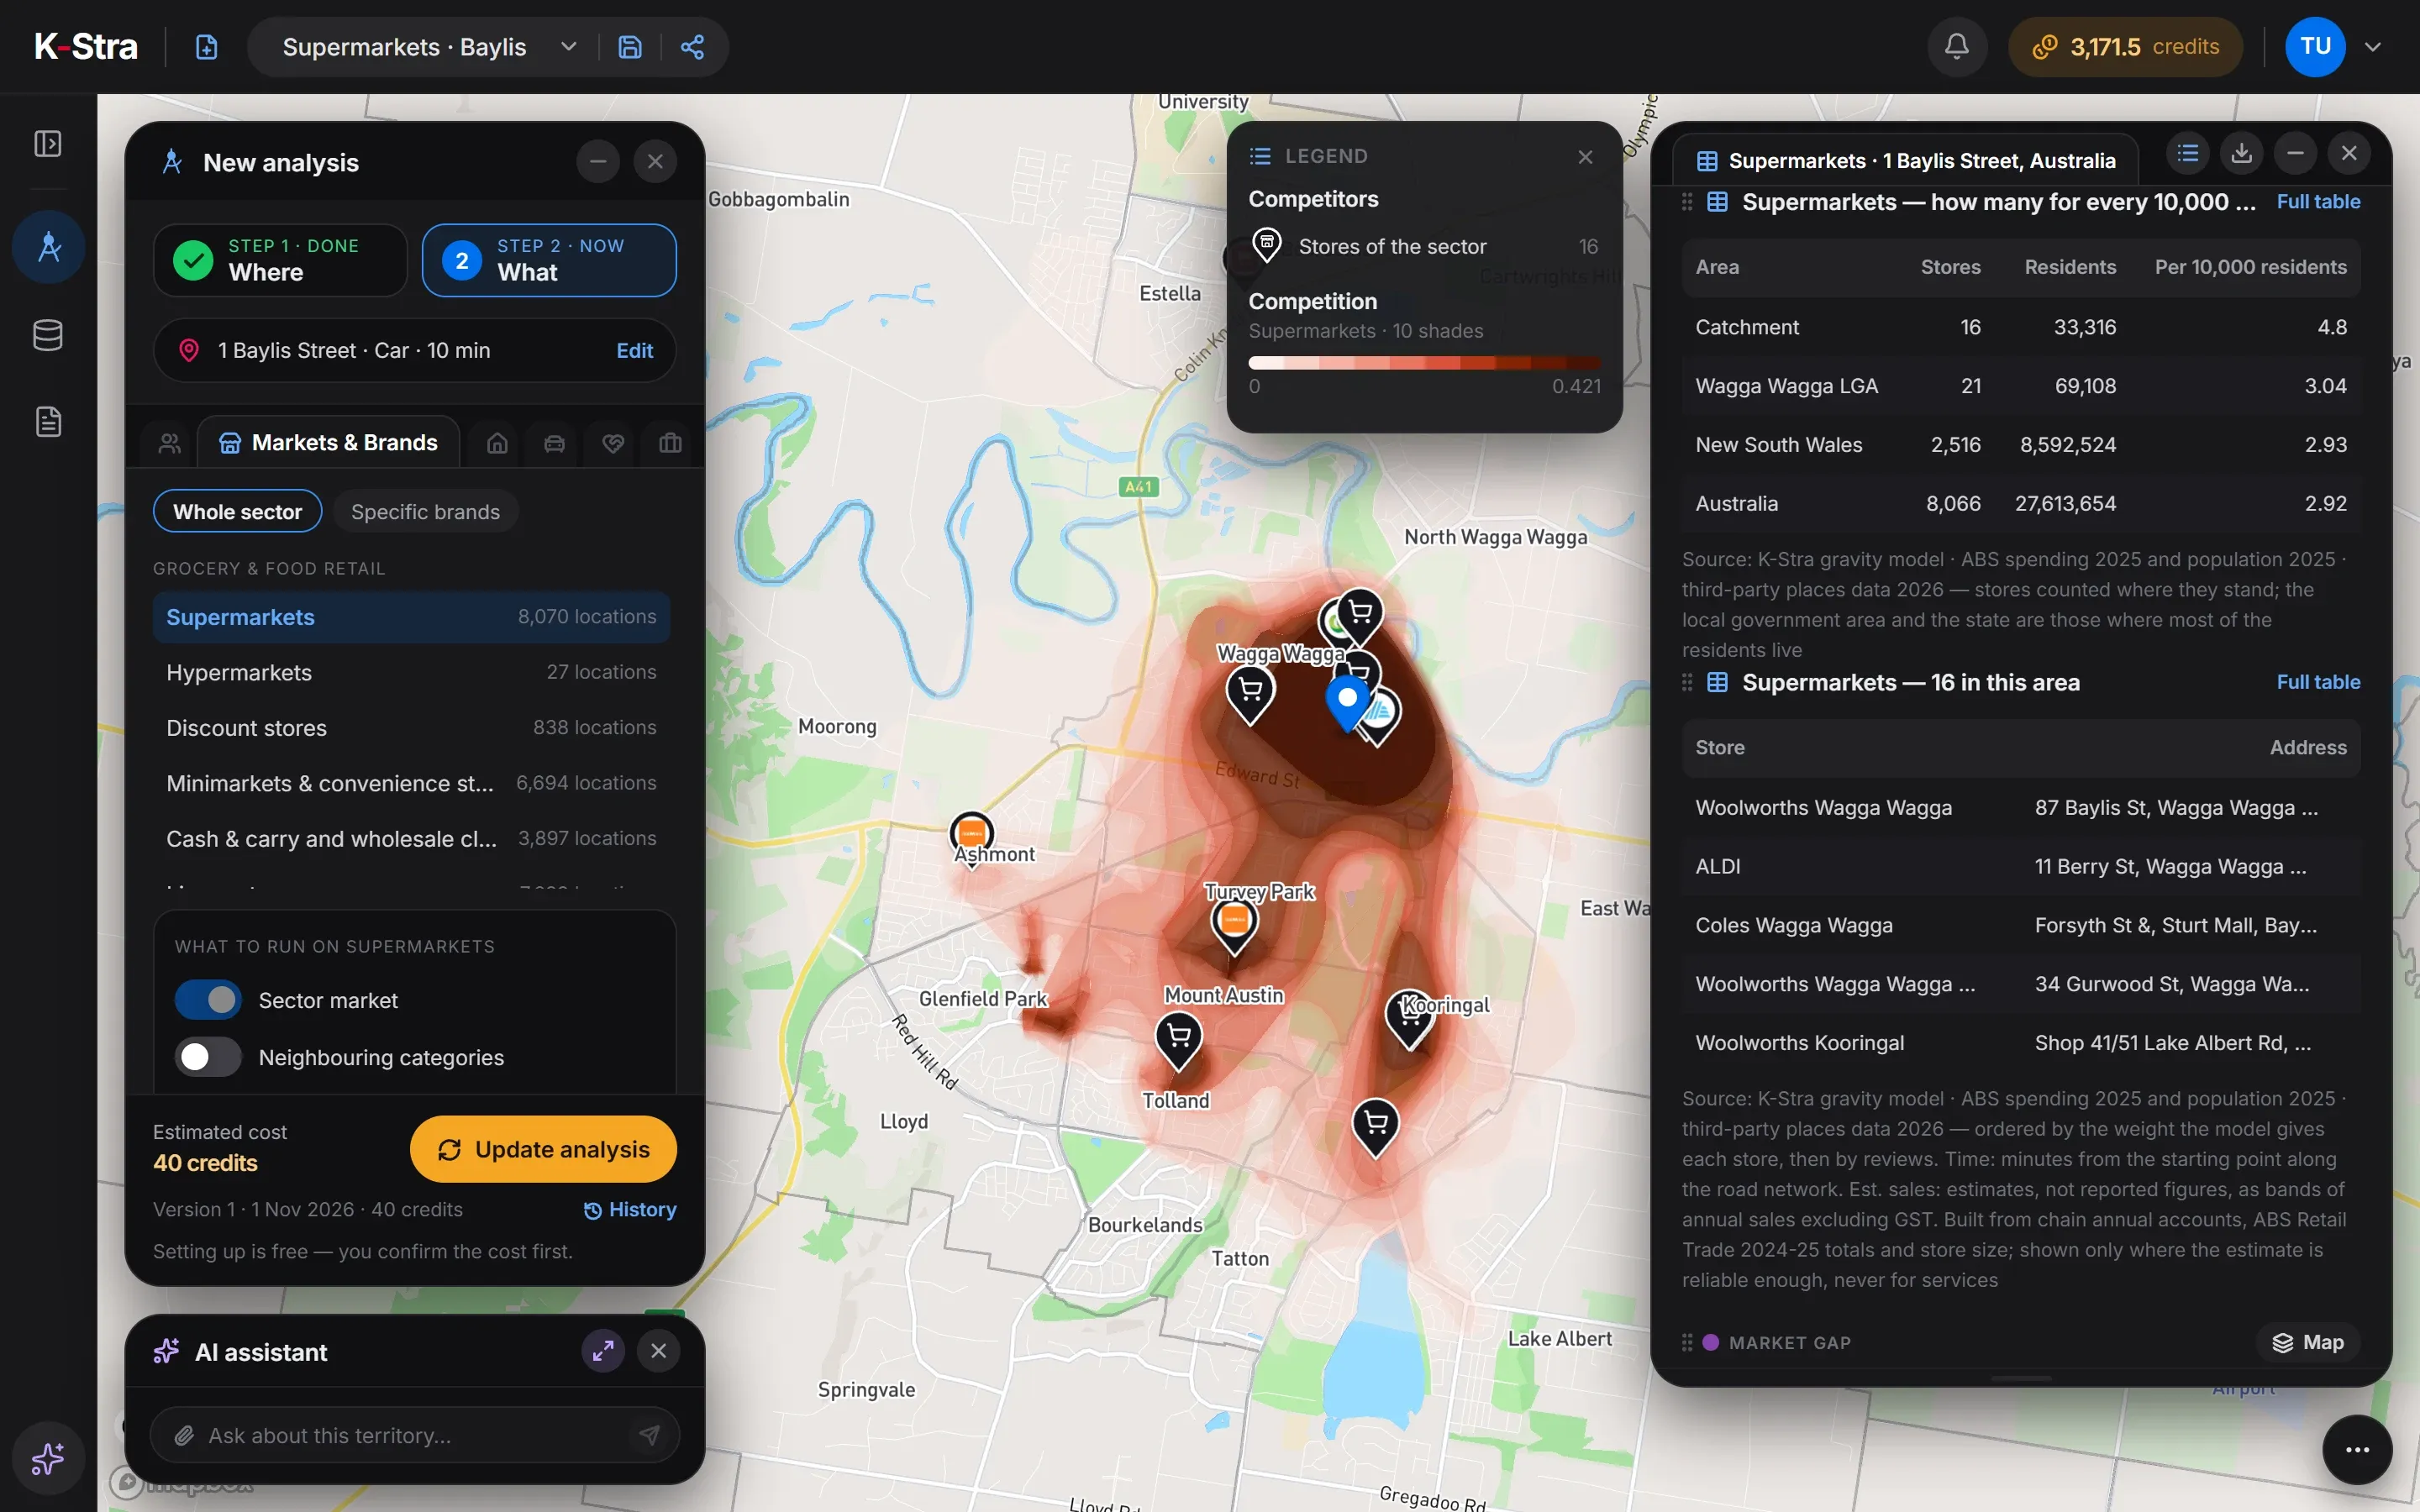 Competition
Darkest where 4 supermarkets stand within two minutes of each other.
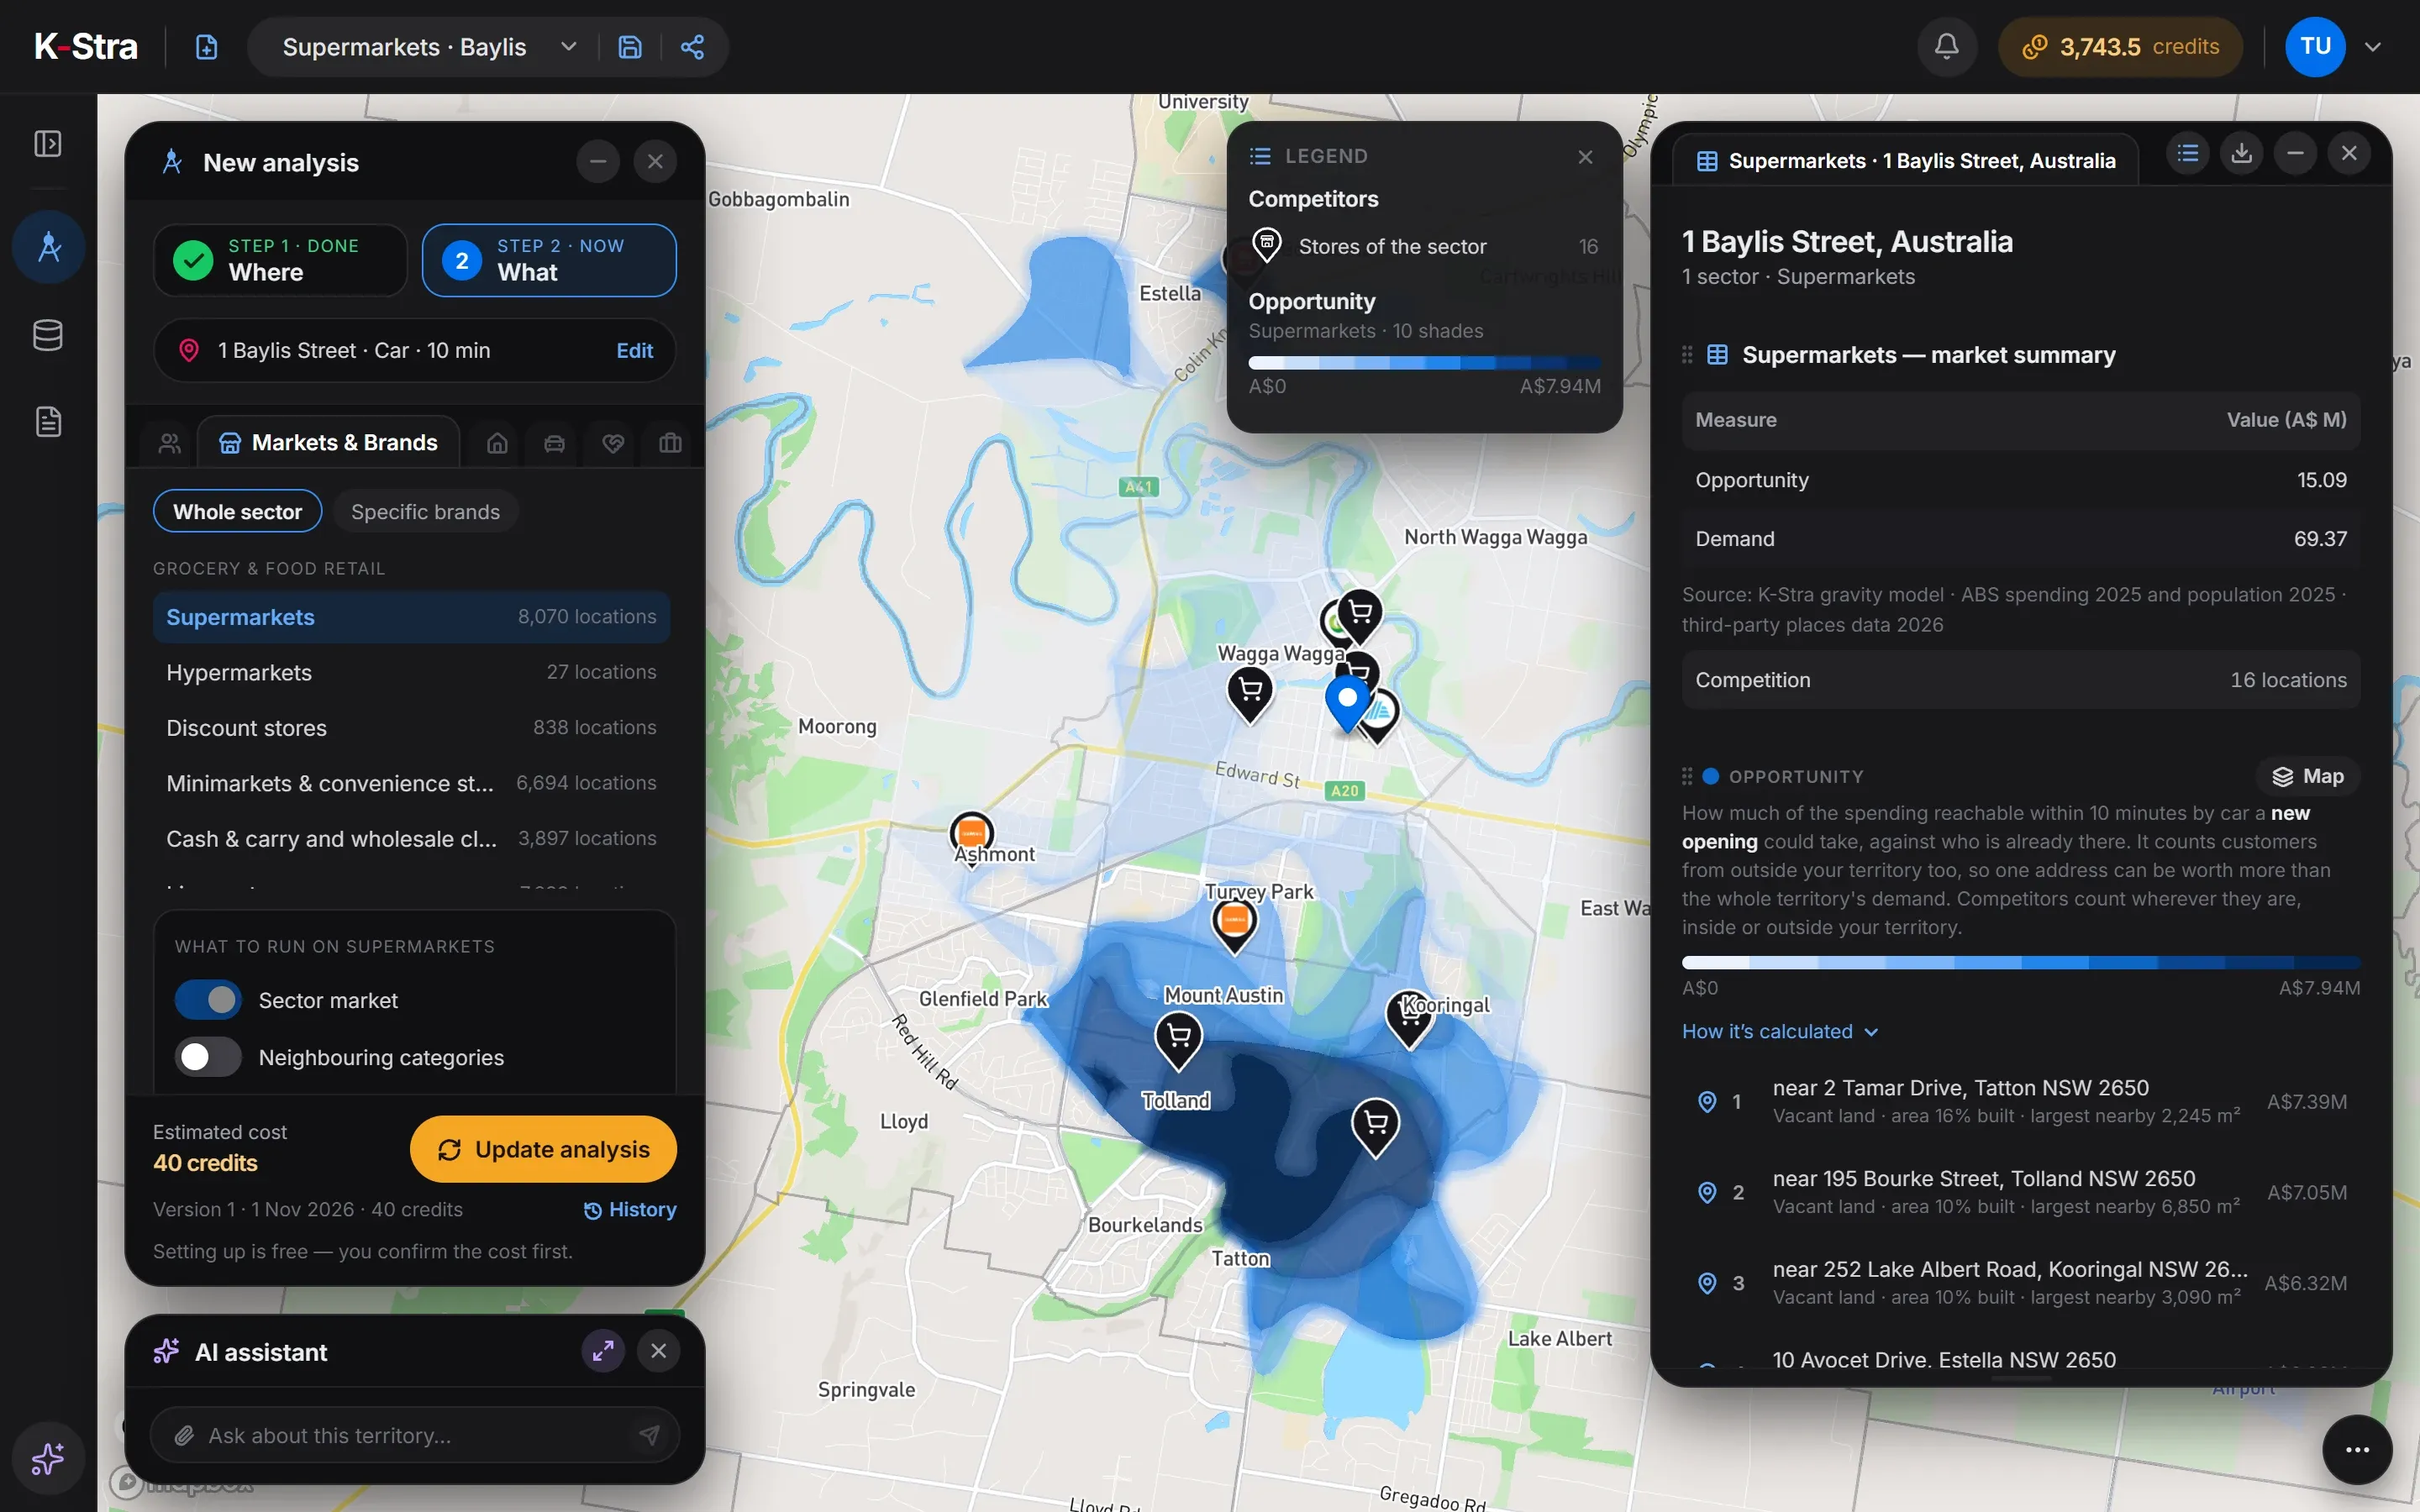 Opportunity
Darkest in the south, around Tatton, Tolland, Kooringal.
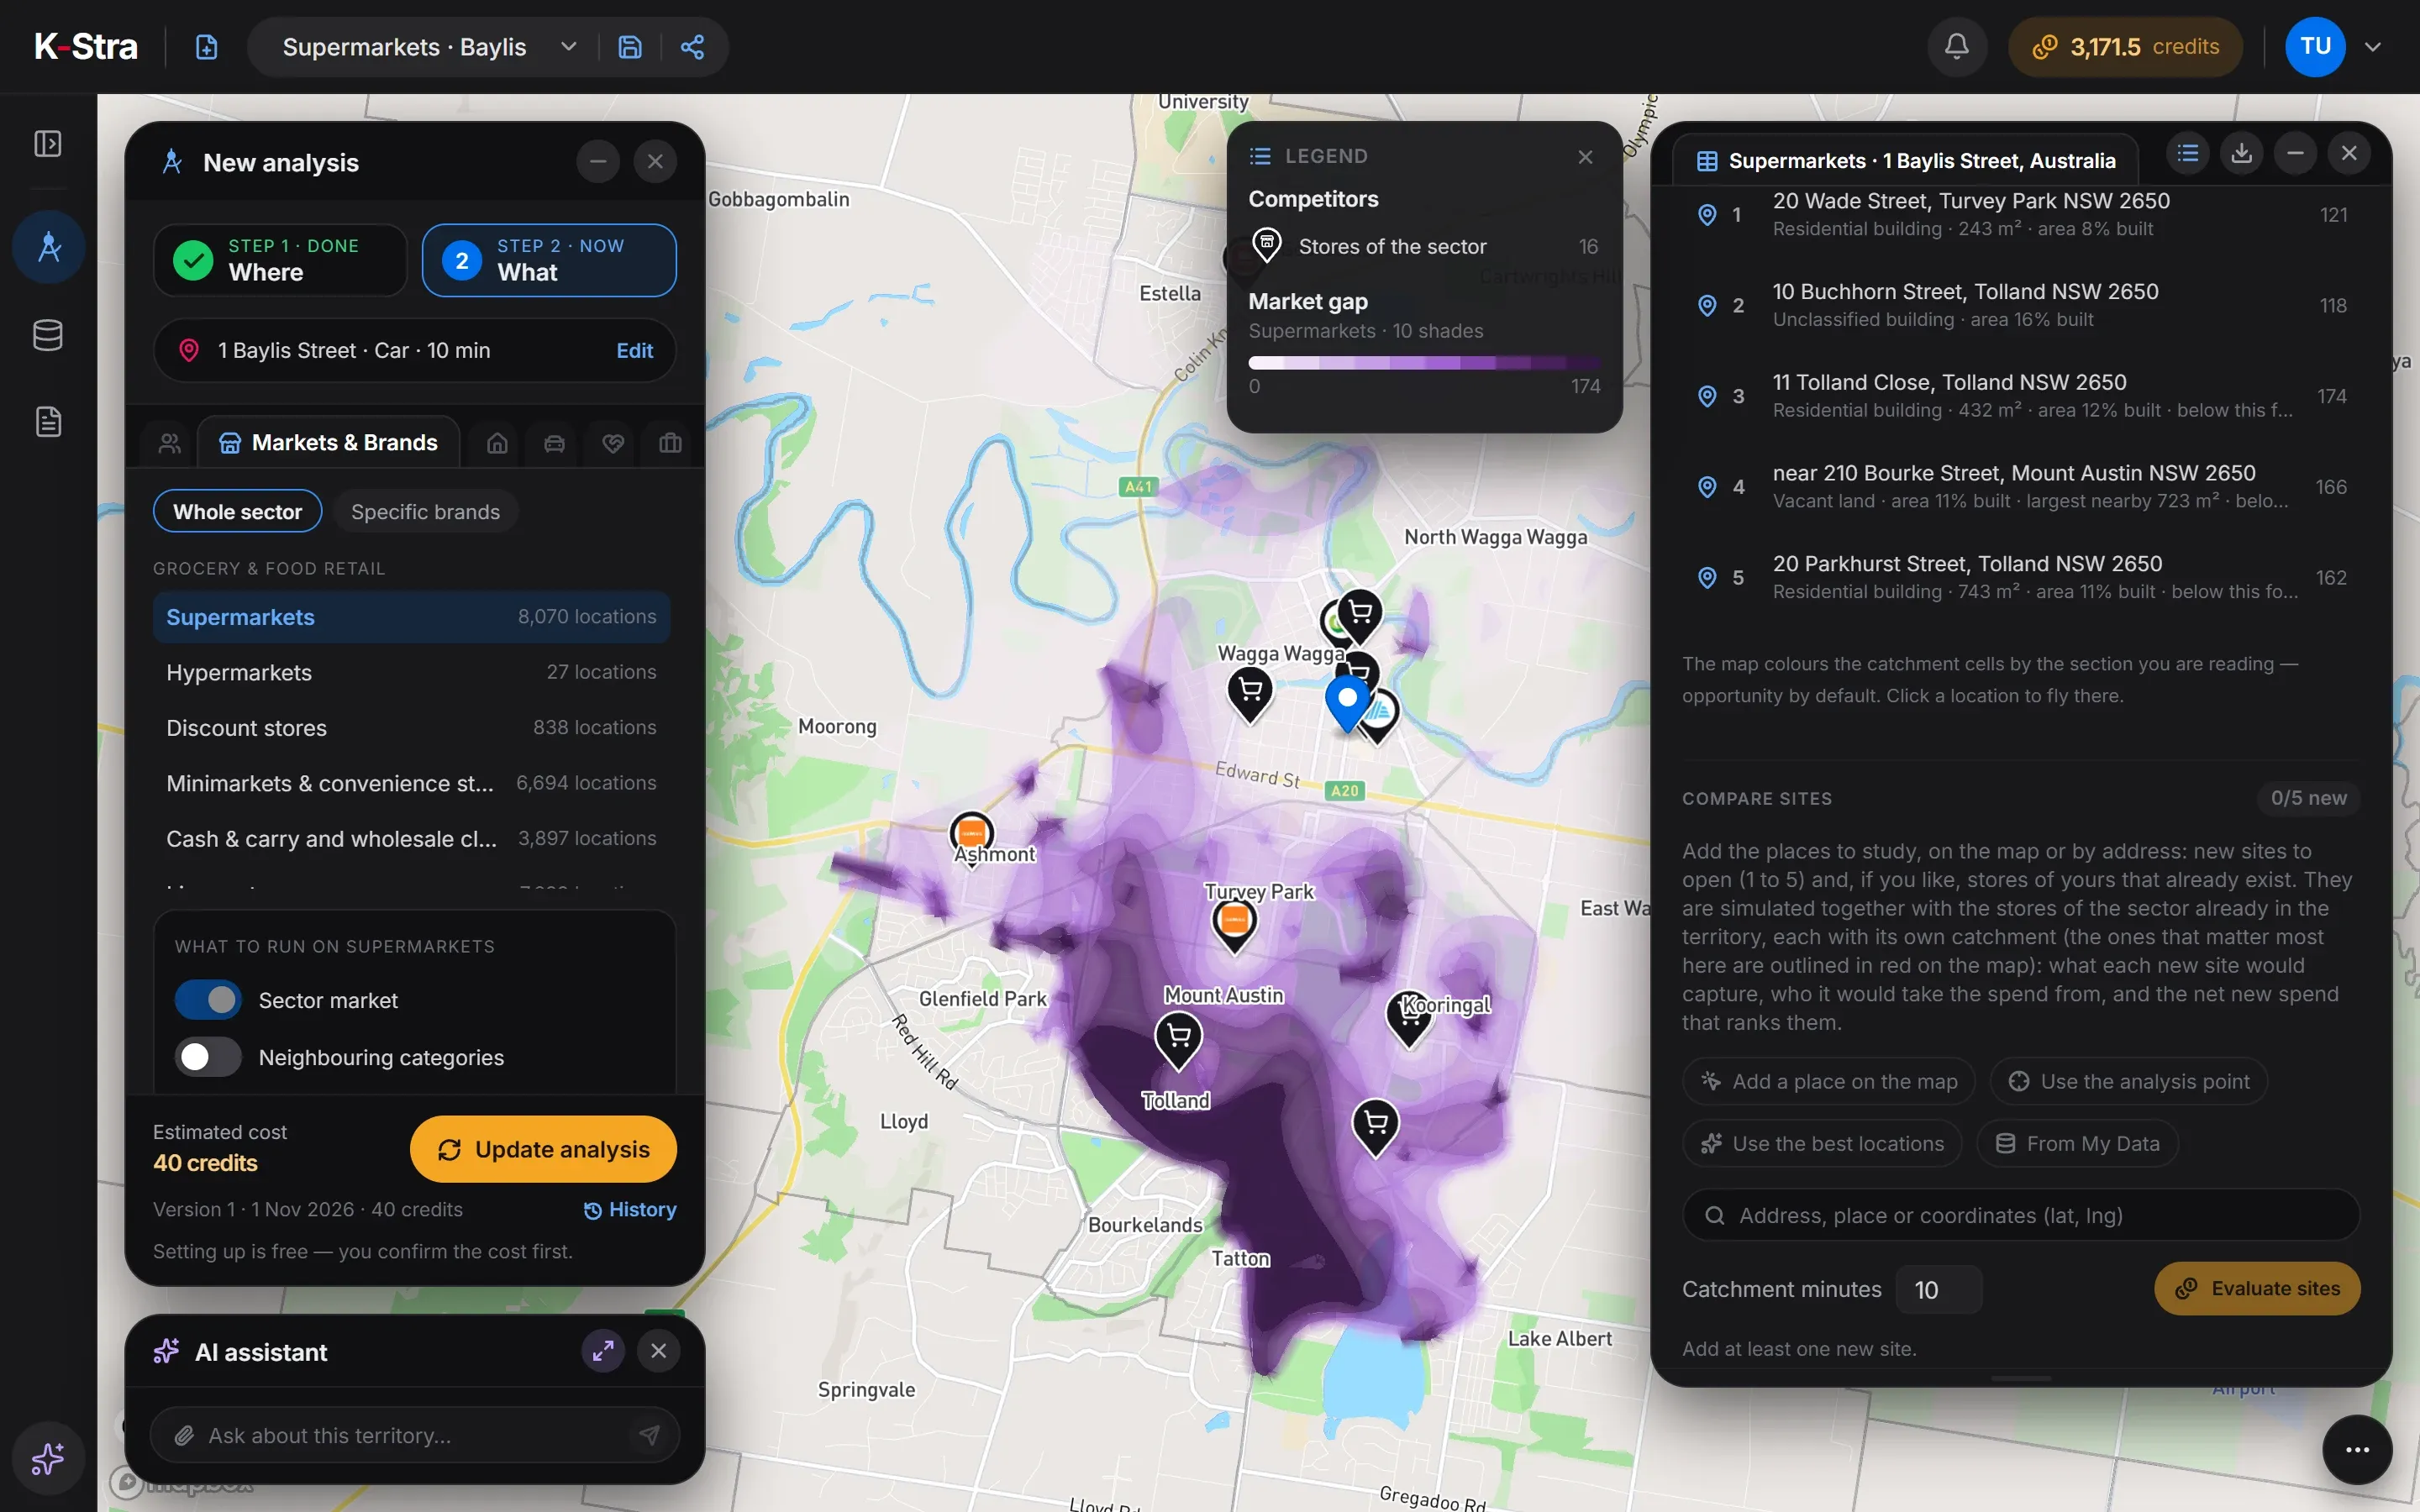 Market gap
Highest away from the centre, where little competition reaches; first near 20 Wade Street, Turvey Park.
Source: one K-Stra analysis of 1 November 2026, supermarket sector, 10 minutes by car from 1 Baylis Street, Wagga Wagga NSW; supermarkets from the K-Stra places catalogue of October 2026, residents from ABS population estimates at 30 June 2025 and spending from the ABS national accounts for 2024–25.
Where is Wagga Wagga’s supermarket market underserved?
Demand and competition both peak in the centre: that is where the most people can be reached, and where the stores already are. The catchment has 4.8 supermarkets per 10,000 residents against 2.92 in Australia, because the centre serves the whole region.
Opportunity moves away from both, to the southern suburbs, where households are many and the central stores pull weakly. The market gap tops out at 174, below the 200 that signals a clear gap: Wagga Wagga is well served overall, and the room left is at its edges.
The lesson holds beyond this town. Opening where demand is highest usually means opening where competition is highest too; opportunity and market gap are what separate a busy place from an available one.
None of the four layers is a sales figure. They describe residents’ spending and how existing stores share it, so visitors, workers and online shopping are outside them, and in centres and tourist towns the market is larger than shown.
What else do people ask about demand and opportunity?
Is demand the same as market potential?
Not quite. Market potential is what the residents of an area spend in total; demand, as used here, is a property of each point — how much spending can be reached from it within the sector’s travel time. Neighbouring points share most of their demand, so demand values do not add up.
Why is competition an index and not a percentage?
Because it measures pull, not share. Each store pulls on every point it can reach, more strongly when it is closer and larger; the index adds those pulls up. A value of 0 means no store reaches the point; there is no meaningful 100%.
Does a high opportunity mean a new store would make money there?
No. It means demand within reach is high against the pull of existing stores. Rent, access, visibility and the format of the store decide the rest, and the model counts residents only, not visitors or workers.
What are the cells on the map?
Each cell is the area closer to one point of the road network than to any other — a Voronoi cell — coloured by that point’s value. The map is a mosaic of these cells, which is why the shading follows the streets.
Four layers,
one map, your sector.
Pick an address and a sector and switch between demand, competition, opportunity and market gap.
Open the app — free to exploreExploring the map is free; you pay only for the analyses you run