
How many people live in Tasmania, and what does that mean for a business?
A small island market with three centres, an older population and more visitors than its residents would suggest: in Tasmania the resident figures tell only part of the story.
Tasmania had 576,261 residents at 30 June 2025, the oldest population of any state, with a median age of 42.7. It grew 5.2% from 2019 to 2025, on average 0.86% a year, the slowest of all. Only 44.3% live in Greater Hobart, and residents spend about A$47,793 each a year, the lowest figure in Australia.
What are the key figures for Tasmania?
| Indicator | Tasmania | Australia |
|---|---|---|
| Residents, 30 June 2025 | 576,261 | 27,613,654 |
| Average yearly change, 2019–2025 | 0.86% | 1.50% |
| Residents added since 2019 | 28,420 | 2,278,828 |
| Area | 68,018 km² | 7,688,095 km² |
| Residents per km² | 8.5 | 3.6 |
| Share in Greater Hobart | 44.3% | — |
| Median age | 42.7 | 38.5 |
| Aged under 15 | 15.9% | 17.4% |
| Aged 65 and over | 22.4% | 17.5% |
| Income index | 90.3 | 100.0 |
| Consumption index | 90.9 | 100.0 |
| Spending per resident, a year | A$47,793 | A$52,582 |
| Resident spending, a year | A$27.5 billion | A$1,452.0 billion |
| Families (Census 2021) | 150,568 | 6,730,182 |
| Homes rented (Census 2021) | 30.6% | 33.6% |
| Flats and apartments (Census 2021) | 5.6% | 19.6% |
- Residents: ABS Estimated Resident Population at 30 June 2025, by council (2025 boundaries). Change: ABS Estimated Resident Population by council, 2019 to 2025; average yearly change as in the K-Stra area dashboard.
- Age: ABS population by five-year age group at 30 June 2025; median age worked out from the age groups. Capital: Greater Capital City Statistical Areas (ABS ASGS Edition 3), residents counted by K-Stra on the address points inside them.
- Indices: Income index from ABS Personal Income 2022–23 (tax data), measured or estimated; consumption index derived from it; 100 = Australia. Spending: Spending per resident from the consumption index and ABS national accounts (5204.0) for 2024–25. Housing and families: ABS Census 2021 (families, rented homes, flats and apartments).
Where do people live in Tasmania?
Greater Hobart counts 255,211 residents, 44.3% of the state, the lowest capital share in Australia. The largest council is not Hobart but Launceston, with 71,341; the Launceston and North East region has 156,393 and the West and North West, around Devonport and Burnie, 120,091.
No Tasmanian council over 20,000 residents has an income index above 100: the highest is Clarence, on Hobart’s eastern shore, at 99.1, and the lowest Devonport, at 83.1.
| Area (capital city, then SA4 regions) | Residents 2025 | Share | Median age | Income index |
|---|---|---|---|---|
| Greater Hobart | 255,211 | 44.3% | 39.7 | 96.3 |
| Launceston and North East | 156,393 | 27.1% | 43.9 | 86.8 |
| West and North West | 120,091 | 20.8% | 45.8 | 86.1 |
| South East | 44,566 | 7.7% | 49.6 | 77.2 |
Residents counted by K-Stra on the address points inside each area; median age from the five-year age groups, income index weighted by residents. The income index comes from ABS personal income tax data for 2022–23, measured for councils and SA2 areas and estimated elsewhere; 100 is the Australian average.
Which councils in Tasmania are growing fastest?
Brighton, at the northern edge of Greater Hobart, grew 14.1% from 2019 to 2025, on average 2.35% a year, almost twice as fast as any other council in the state, and has the youngest population, with a median age of 35.1. Clarence, on the eastern shore, follows at 1.31%.
The centres themselves barely grew: Hobart 0.11% a year, Glenorchy 0.13% and Launceston 0.35%. New households in Tasmania settle on the suburban edge, not in the cities.
| Council | Residents 2019 | Residents 2025 | Change a year | Rank |
|---|---|---|---|---|
| Brighton | 17,995 | 20,527 | 2.35% | Fastest |
| Clarence | 59,447 | 64,119 | 1.31% | Fastest |
| Meander Valley | 20,286 | 21,739 | 1.19% | Fastest |
| West Tamar | 24,602 | 26,136 | 1.04% | Fastest |
| Kingborough | 39,378 | 41,628 | 0.95% | Fastest |
| Hobart | 55,482 | 55,859 | 0.11% | Slowest |
| Glenorchy | 50,068 | 50,450 | 0.13% | Slowest |
| Launceston | 69,888 | 71,341 | 0.35% | Slowest |
Councils with more than 20,000 residents in 2025. Average yearly change = (residents 2025 ÷ residents 2019 − 1) ÷ 6, on 2025 council boundaries.
How much do residents of Tasmania spend, and on what?
Tasmania’s consumption index is 90.9: residents spend A$47,793 each a year, about A$4,789 less than the average Australian, and A$27.5 billion in all. The gap is widest in housing, recreation and restaurants.
| Category | Per resident, TAS | Per resident, Australia | Total, TAS (A$ million) |
|---|---|---|---|
| Food and non-alcoholic beverages | A$4,849 | A$5,032 | 2,794 |
| Alcoholic beverages, tobacco and narcotics | A$1,434 | A$1,509 | 826 |
| Clothing and footwear | A$1,781 | A$1,869 | 1,026 |
| Housing, water, electricity, gas and other fuels | A$11,842 | A$12,788 | 6,824 |
| Furnishings, household equipment and routine household maintenance | A$1,938 | A$2,243 | 1,117 |
| Health | A$3,430 | A$3,823 | 1,977 |
| Transport | A$5,035 | A$5,558 | 2,901 |
| Information and communication | A$874 | A$956 | 504 |
| Recreation, sport and culture | A$4,715 | A$5,380 | 2,717 |
| Education services | A$1,567 | A$1,862 | 903 |
| Restaurants and accommodation services | A$3,844 | A$4,447 | 2,215 |
| Insurance and financial services | A$3,746 | A$4,146 | 2,159 |
| Personal care, social protection and miscellaneous goods and services | A$2,738 | A$2,969 | 1,578 |
| All categories | A$47,793 | A$52,582 | 27,541 |
Spending per resident from the consumption index and ABS national accounts (5204.0) for 2024–25. Spending of residents, wherever it happens; visitors are not included.
How many businesses of each kind does Tasmania have?
Tasmania has 30.66 accommodation businesses per 10,000 residents, twice the national 15.11, and more bars and cafés (15.95) and restaurants (14.98) than any other state. Childcare is the lowest, at 3.57 against 5.24.
| Sector | Locations in TAS | Per 10,000 residents | Australia |
|---|---|---|---|
| Supermarkets | 209 | 3.63 | 2.92 |
| Pharmacies | 209 | 3.63 | 2.63 |
| Gyms & fitness centers | 452 | 7.84 | 7.06 |
| Bars & cafés | 919 | 15.95 | 12.00 |
| Restaurants | 863 | 14.98 | 12.17 |
| Hairdressers | 484 | 8.40 | 9.31 |
| Childcare & early learning | 206 | 3.57 | 5.24 |
| Aged care & retirement living | 165 | 2.86 | 2.50 |
| Fuel stations | 385 | 6.68 | 3.74 |
| Real estate agencies | 261 | 4.53 | 5.34 |
| Hotels & accommodation | 1,767 | 30.66 | 15.11 |
K-Stra places catalogue, October 2026, as the app classifies each business; residents at 30 June 2025. A higher count per resident can mean smaller outlets, visitors or a crowded market: the catchment of each site tells which.
What can you see about Tasmania without an account?
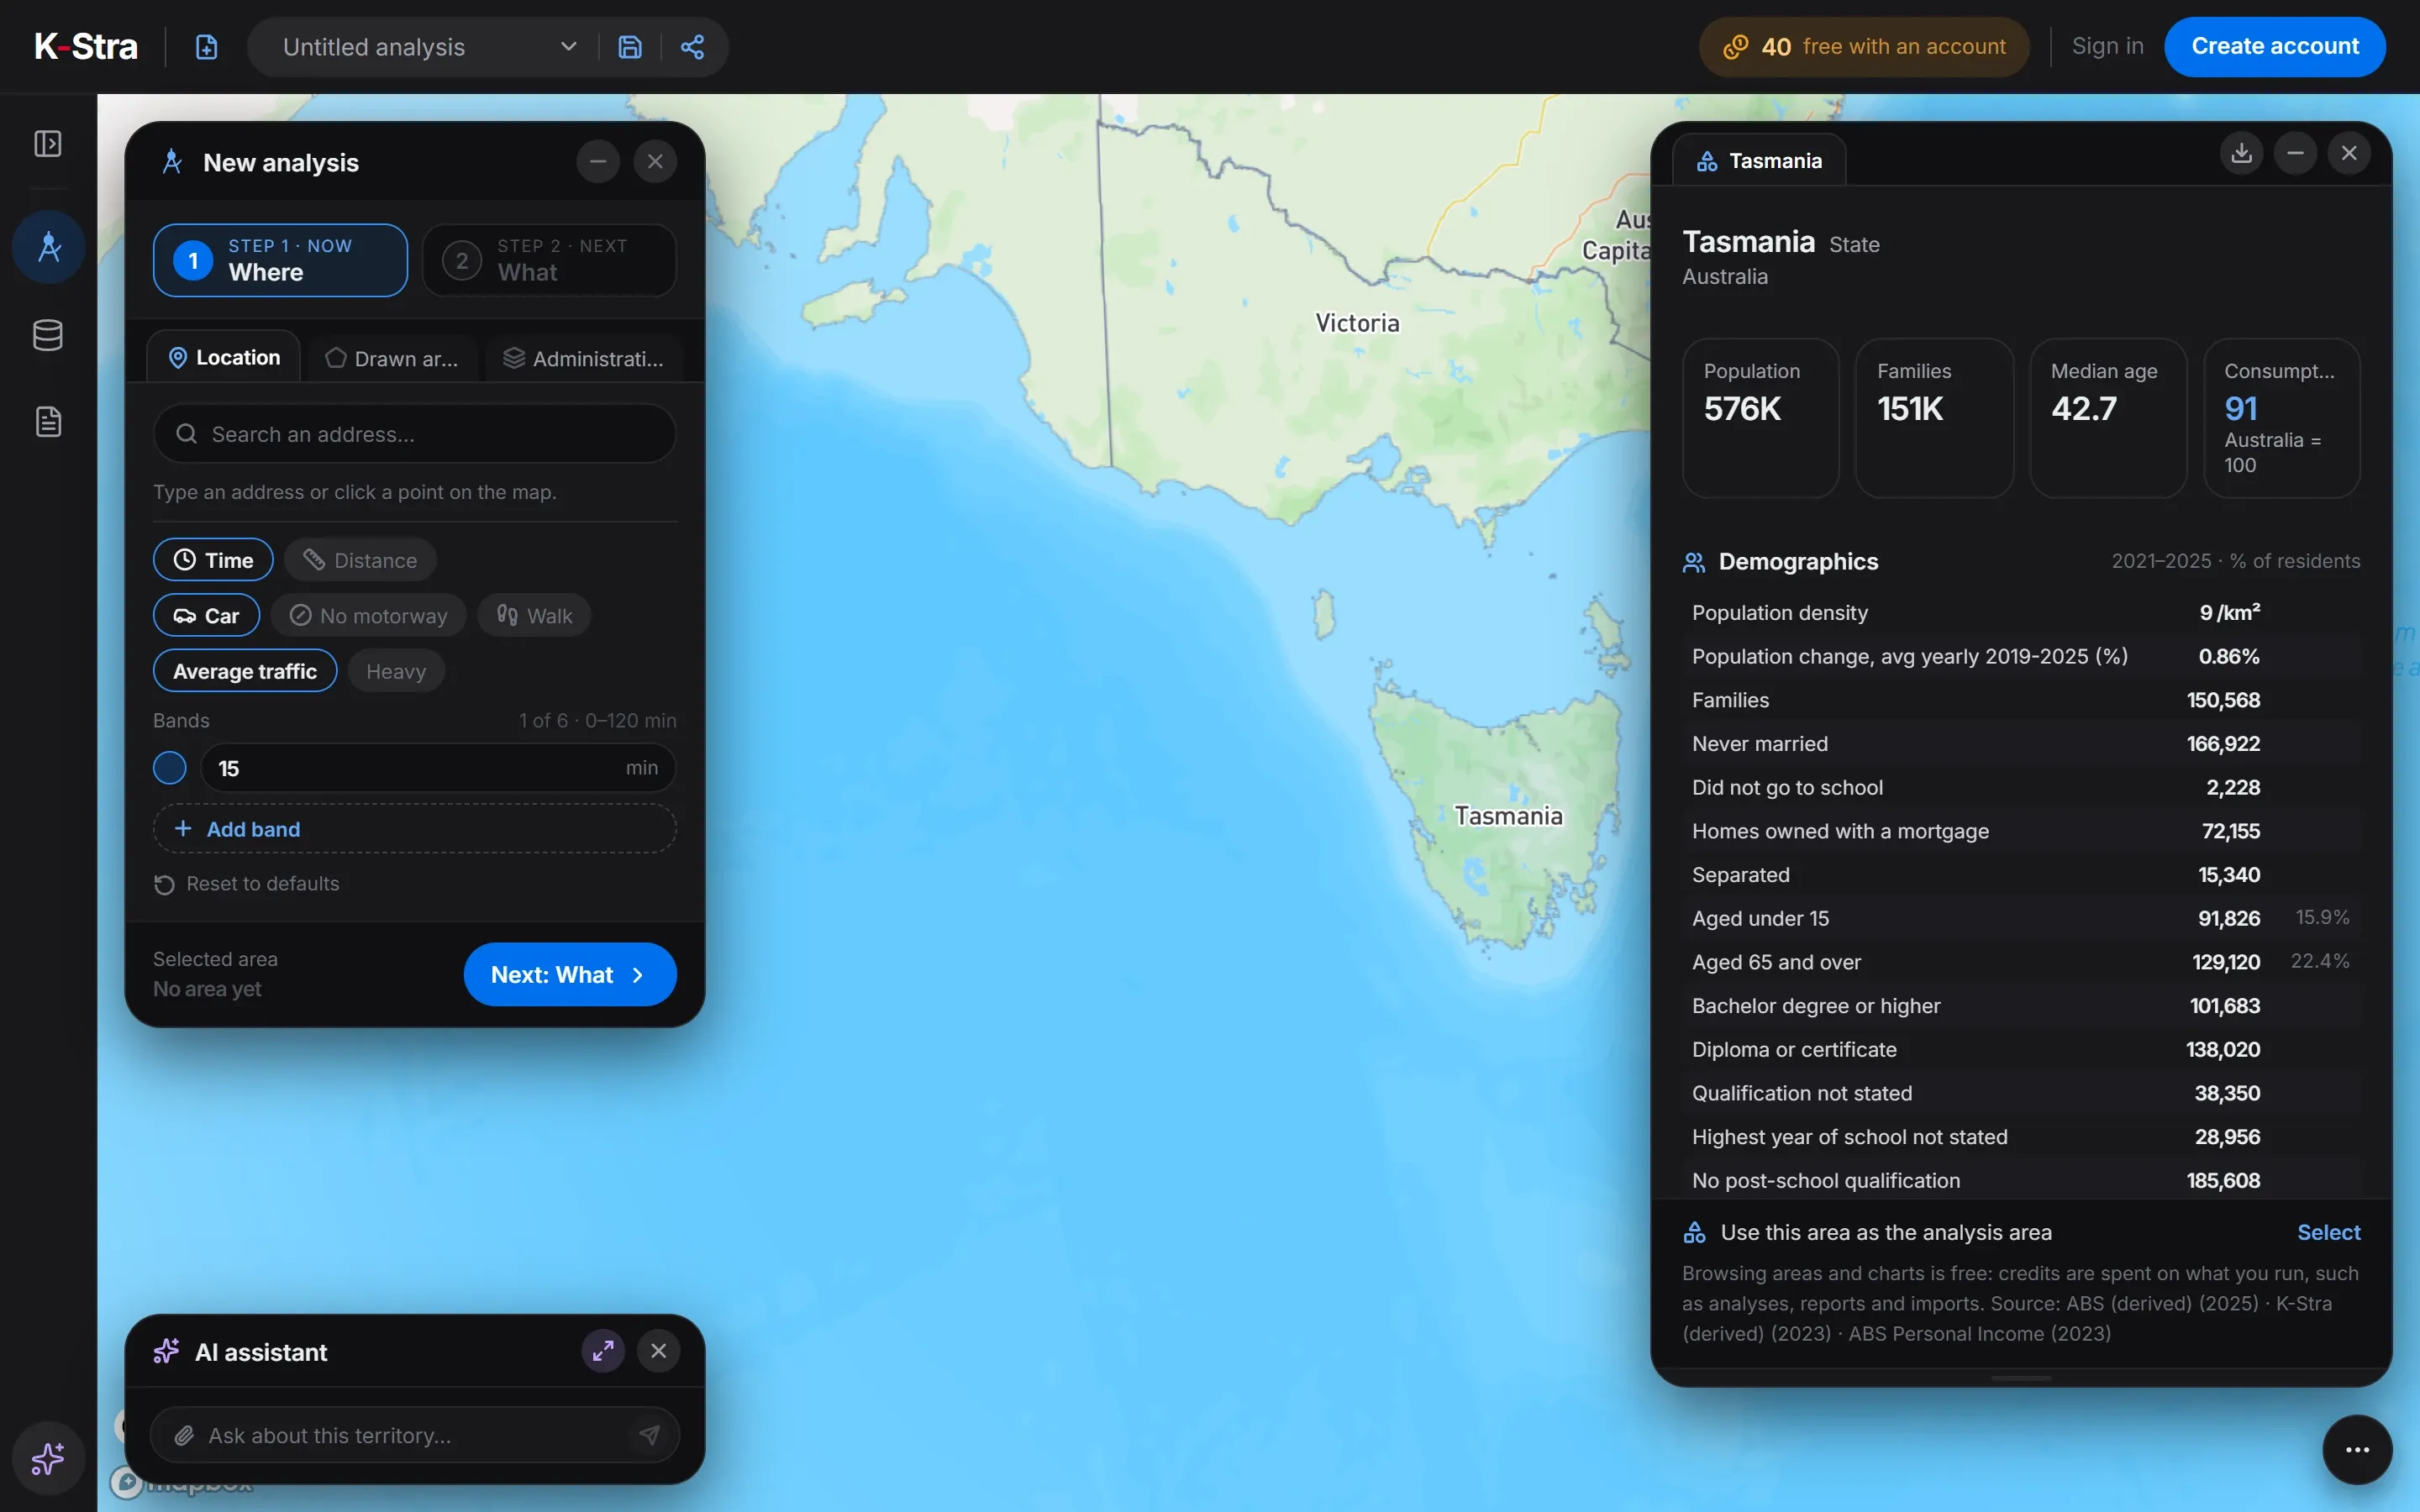 No account needed
On the map of Australia, a click on “Tasmania” opens this dashboard; zooming in, the same click works on every council, postcode and suburb in TAS. Browsing them costs nothing.
Figures for the whole of Tasmania are a starting point: credits start when you measure the catchment of one of its addresses — the residents within a drive, their spending and the competitors already there.
What does this mean for choosing a location in Tasmania?
In Tasmania the hospitality count is built for visitors, not residents. K-Stra models the spending of residents only, so for a café or a hotel in Hobart or Launceston the resident market looks crowded while visitors fill the gap; for everyday retail, the resident figures are the right ones.
An older population with lower incomes spends a larger share of its budget on essentials: 10.1% on food and 24.8% on housing, against 9.6% and 24.3% nationally. The share on health is about the same, 7.2% against 7.3%, and the amount per resident is lower, A$3,430 against A$3,823. Supermarkets and pharmacies are already dense here, 3.63 and 3.63 per 10,000 residents, so a new site has to win share rather than meet new demand.
With three centres far apart and slow growth overall, the decisions are about which suburbs gain residents — Brighton, Clarence, Kingborough — and how each centre’s catchment reaches into its rural surroundings.
What else do people ask about Tasmania?
What is the population of Tasmania?
576,261 at 30 June 2025 (ABS estimate), up from 547,841 in 2019. Greater Hobart accounts for 255,211.
Why does Tasmania have so many hotels and cafés per resident?
Because tourism brings far more visitors than residents in many places. Business counts reflect the visitors, while resident population does not, so comparisons per resident overstate how crowded hospitality is.
Which is the largest council in Tasmania?
Launceston, with 71,341 residents, ahead of Clarence (64,119) and the City of Hobart (55,859). Greater Hobart as a whole is larger, because it spans several councils.
Open Tasmania
on the map.
The app opens on the island: click a council for its free dashboard, or draw a catchment around Hobart, Launceston or Devonport.
Open the app — free to exploreBrowsing areas and dashboards is free