
Where do Australians rent rather than own their home?
Renting changes who lives in an area and how long they stay. Across the 231 councils with more than 20,000 residents, the Census shows three very different kinds of renters’ council.
33.6% of Australian homes were rented at the 2021 Census. Renting peaks in the centres of Melbourne (69.1%) and Sydney, and in mining councils such as Karratha (65.3%) and Isaac. It is lowest on the semi-rural fringes of the capitals, down to 7.3% in Golden Plains, west of Melbourne.
Which councils have the highest share of rented homes?
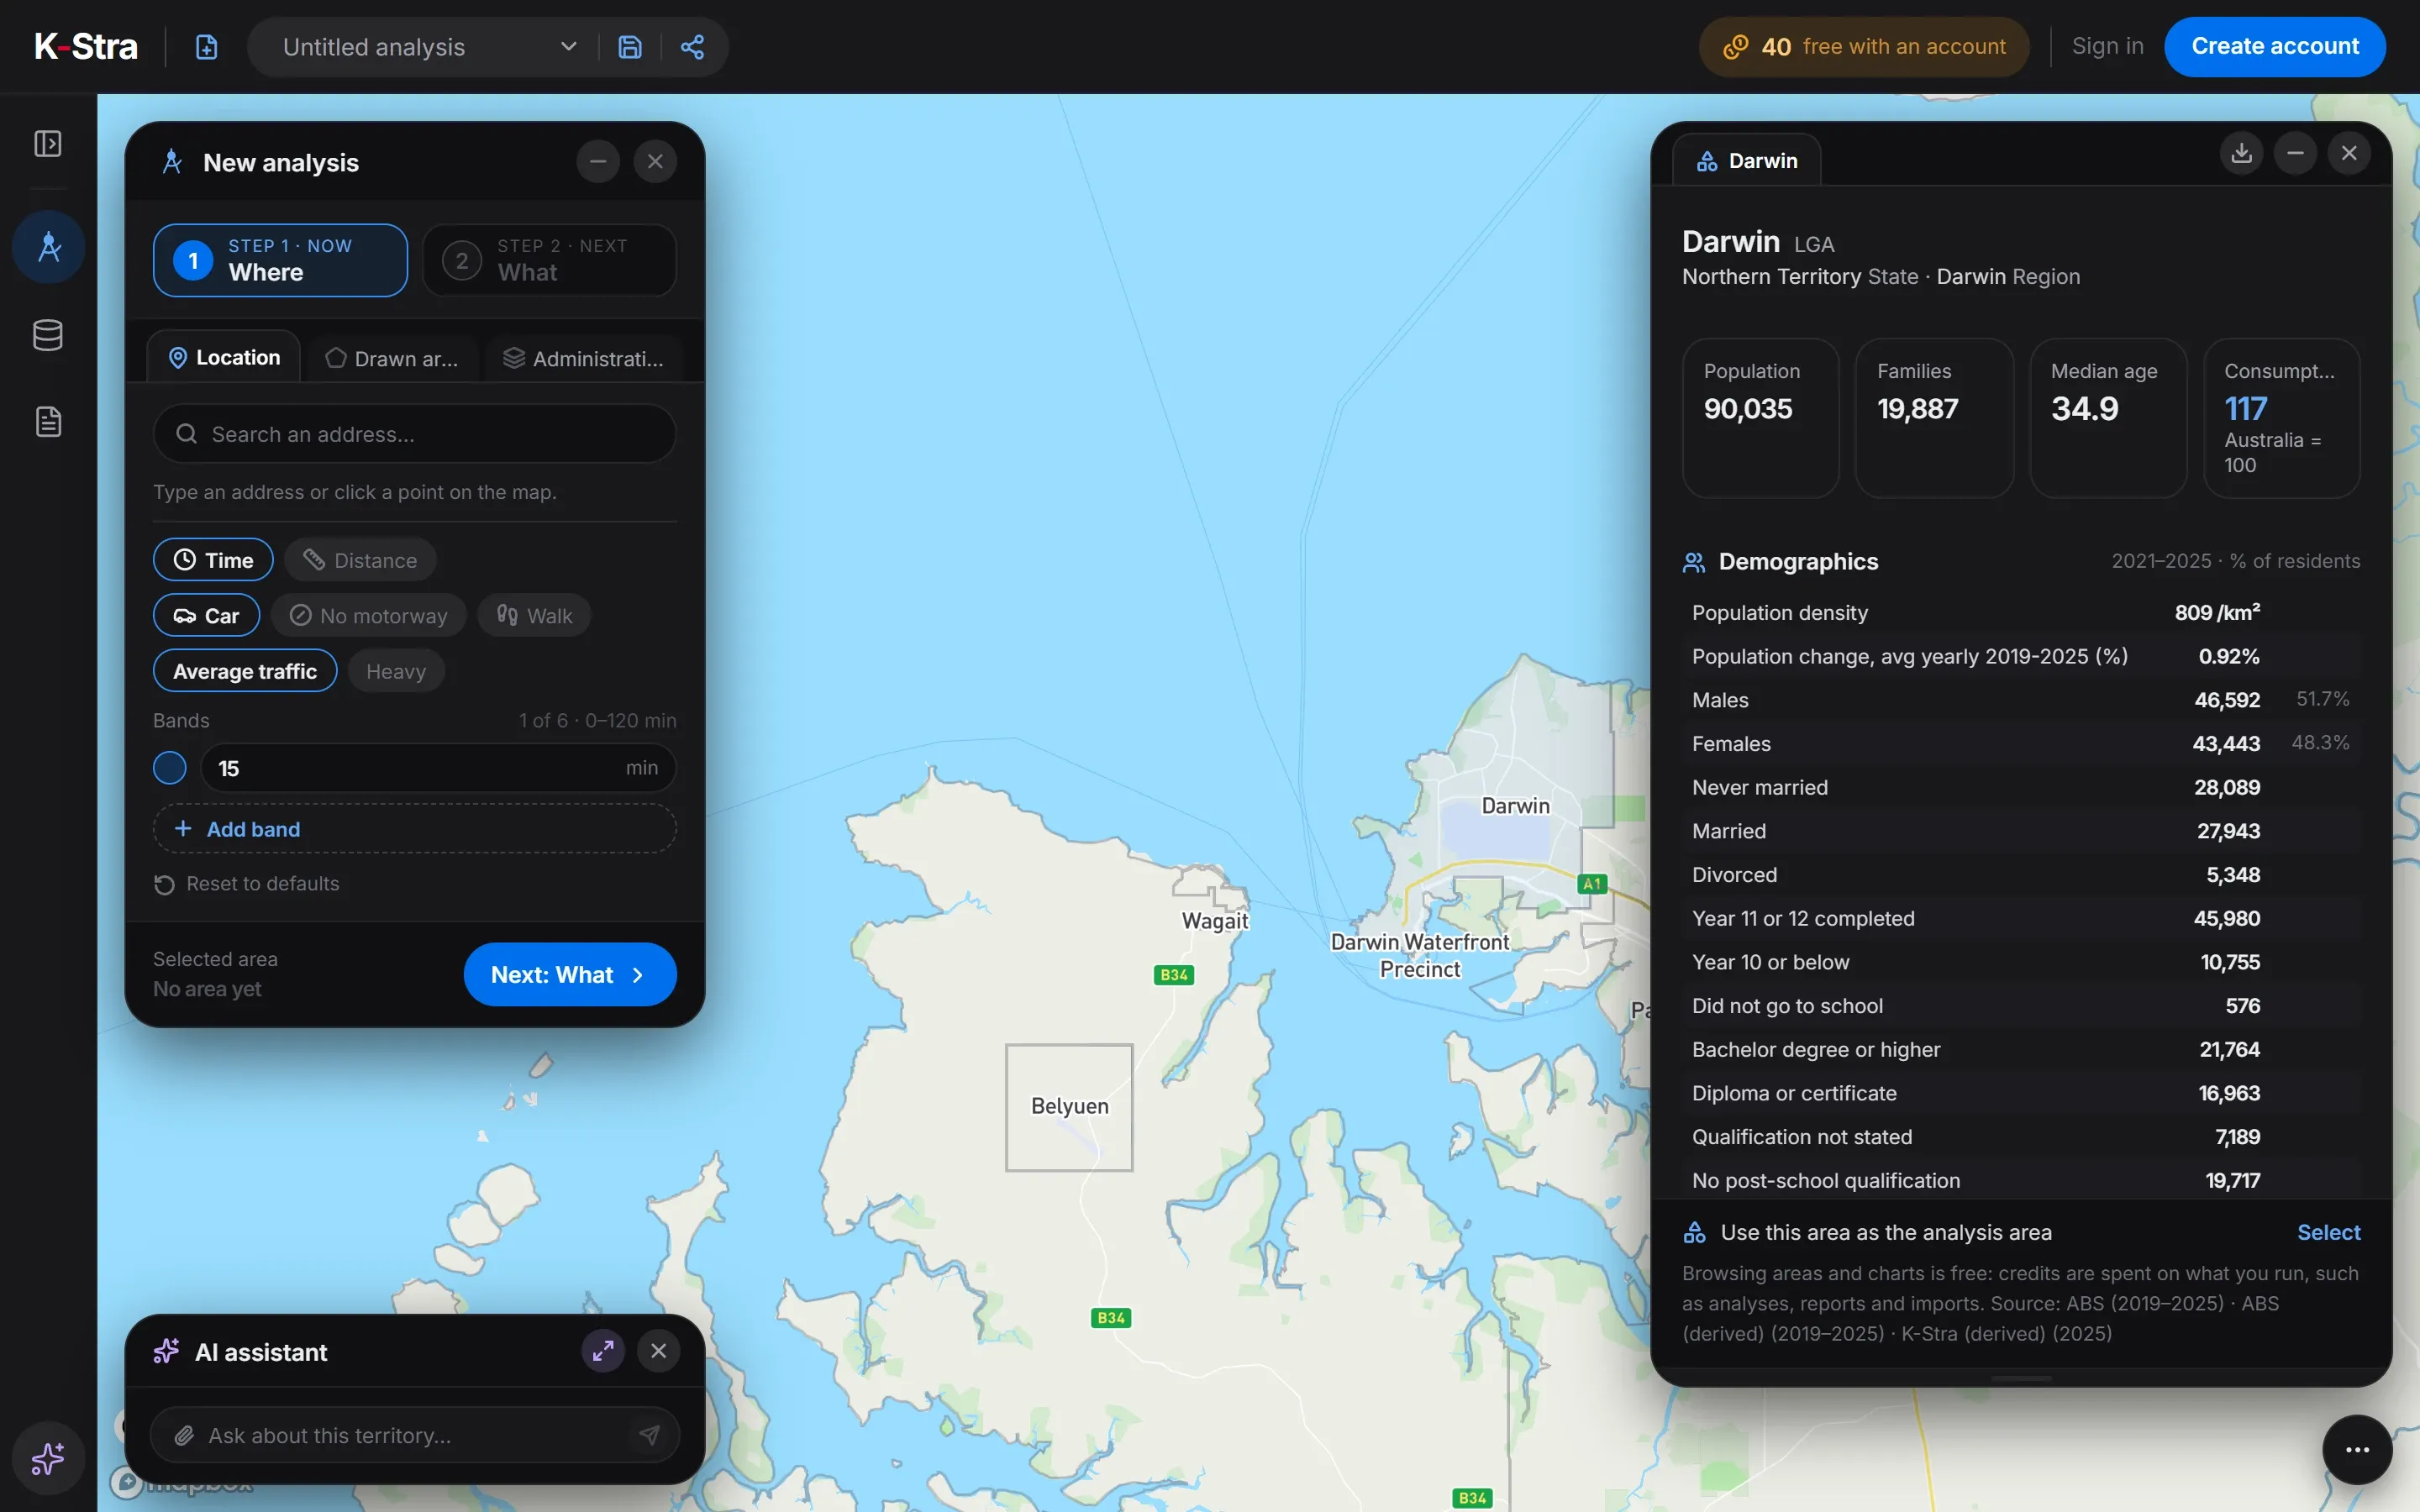 Free area dashboard · Darwin
Three groups share the top of the list. City centres, where apartments and students dominate; inner suburbs such as Yarra, Port Phillip and Waverley; and remote mining towns, where many workers live in housing provided by employers or stay only a few years.
Darwin sits between the groups: a capital city council where 44.6% of homes are flats, 53.0% are rented and the median age is 34.9, against 38.5 for Australia.
| Council | State | Residents 2025 | Homes rented | Flats and apartments | Median age |
|---|---|---|---|---|---|
| Melbourne | VIC | 194,481 | 69.1% | 92.2% | 29.5 |
| Sydney | NSW | 241,797 | 67.4% | 87.4% | 33.3 |
| Perth | WA | 35,673 | 66.8% | 94.4% | 33.1 |
| Karratha | WA | 25,429 | 65.3% | 7.9% | 33.0 |
| Adelaide | SA | 30,173 | 62.8% | 70.4% | 31.7 |
| Yarra | VIC | 101,356 | 57.6% | 60.9% | 34.6 |
| Isaac | QLD | 23,186 | 57.5% | 1.6% | 35.2 |
| Port Phillip | VIC | 114,434 | 54.3% | 74.4% | 38.0 |
| North Sydney | NSW | 73,705 | 53.1% | 83.1% | 38.6 |
| Darwin | NT | 90,035 | 53.0% | 44.6% | 34.9 |
| Waverley | NSW | 73,345 | 50.5% | 70.4% | 35.0 |
| Randwick | NSW | 146,484 | 50.2% | 62.4% | 34.6 |
| Australia | 27,613,654 | 33.6% | 19.6% | 38.5 |
ABS Census 2021 (homes rented, social housing, flats and apartments); rented includes social housing. ABS population by five-year age group at 30 June 2025; median age worked out from the age groups.
Where do most households own their home?
At the other end are the green fringes of the capitals: Golden Plains and Macedon Ranges near Melbourne, Nillumbik and the Yarra Ranges, the Adelaide Hills, Mundaring and Serpentine-Jarrahdale near Perth. Large blocks, family houses and almost no apartments.
Across the 231 councils with more than 20,000 residents, the share of flats and the share of renting move together (correlation 0.66), and older councils rent less (correlation -0.58). Mining towns are the main exception: few flats, many renters.
| Council | State | Residents 2025 | Homes rented | Flats and apartments | Median age |
|---|---|---|---|---|---|
| Golden Plains | VIC | 26,620 | 7.3% | 0.1% | 40.3 |
| Nillumbik | VIC | 63,797 | 9.5% | 3.1% | 43.4 |
| Adelaide Hills | SA | 42,875 | 11.3% | 1.5% | 44.7 |
| Mundaring | WA | 43,577 | 12.1% | 0.2% | 43.2 |
| Serpentine-Jarrahdale | WA | 40,531 | 12.9% | 0.4% | 33.6 |
| Macedon Ranges | VIC | 54,464 | 14.8% | 0.3% | 44.1 |
| Yarra Ranges | VIC | 160,906 | 15.0% | 0.6% | 40.9 |
| Joondalup | WA | 176,595 | 17.0% | 3.4% | 41.1 |
Correlation: Pearson coefficient across councils, from −1 to 1; 0 means no relationship.
Where is social housing most common?
Social housing, rented from a state housing authority or a community provider, is a separate pattern again. It is highest in Whyalla (14.8% of homes), a steel town built largely with public housing, and in parts of Adelaide, Hobart and Sydney with large public housing estates.
For a business it signals a share of households on low incomes, but not always a poor area: in Whyalla, Alice Springs and Karratha high wages lift the income index above 100.
| Council | State | Residents 2025 | Social housing | All rented | Income index |
|---|---|---|---|---|---|
| Whyalla | SA | 21,720 | 14.8% | 49.1% | 104.7 |
| Brighton | TAS | 20,527 | 12.9% | 41.7% | 94.0 |
| Port Adelaide Enfield | SA | 143,022 | 9.7% | 42.7% | 94.9 |
| Alice Springs | NT | 30,875 | 9.5% | 49.4% | 114.1 |
| Devonport | TAS | 26,994 | 9.1% | 38.4% | 83.1 |
| Karratha | WA | 25,429 | 8.8% | 65.3% | 156.9 |
| Glenorchy | TAS | 50,450 | 8.3% | 41.9% | 93.5 |
| Campbelltown (NSW) | NSW | 191,285 | 8.2% | 39.8% | 99.2 |
ABS Census 2021 (homes rented, social housing, flats and apartments). Income index from ABS Personal Income 2022–23 (tax data); consumption index derived from it; 100 = Australia.
Why does the share of renters matter for a business?
Renters change address more often than owners, so a renters’ area replaces part of its customers every year: good for businesses that win new arrivals, harder for those that live on loyalty. An area of apartments also packs more customers into a short walk.
The figures are from the 2021 Census, the latest count by small area; the 2026 Census results arrive from June 2027. Areas that grew fast since 2021, like the outer suburbs, may have more renters today than these numbers show.
What else do people ask about housing?
What share of Australian homes is rented?
33.6% at the 2021 Census, including social housing. The share is above half in twelve councils with more than 20,000 residents.
Why are mining towns full of renters?
Because many workers live in housing provided by their employer or stay only a few years. In Karratha and Isaac, in the Pilbara and the Bowen Basin, more than half of homes are rented.
Is the data up to date?
It is the latest available by small area: housing tenure comes from the Census, held every five years. The 2026 Census results start arriving in June 2027.
Can I see renting for a postcode or suburb?
Yes. The free dashboard of every council, postcode and suburb in K-Stra shows homes owned outright, owned with a mortgage, rented and rented as social housing.
Look up renting
in any area.
Click a council, postcode or suburb on the map: the dashboard is free and needs no account.
Open the app — free to exploreBrowsing areas and their dashboards is free; you pay only for the analyses you run