
Which Australian councils have the highest incomes?
Two kinds of high income and one kind of low: a ranking of the 231 councils with more than 20,000 residents by the income their residents declare, and what it means for spending.
Karratha, in the Pilbara, has the highest income index of any Australian council with more than 20,000 residents: 156.9, where Australia is 100. North Sydney, Woollahra and Lane Cove in Sydney follow. The lowest are on the NSW North Coast and in Far North Queensland, down to 66.7 in Nambucca Valley.
Which councils have the highest incomes in Australia?
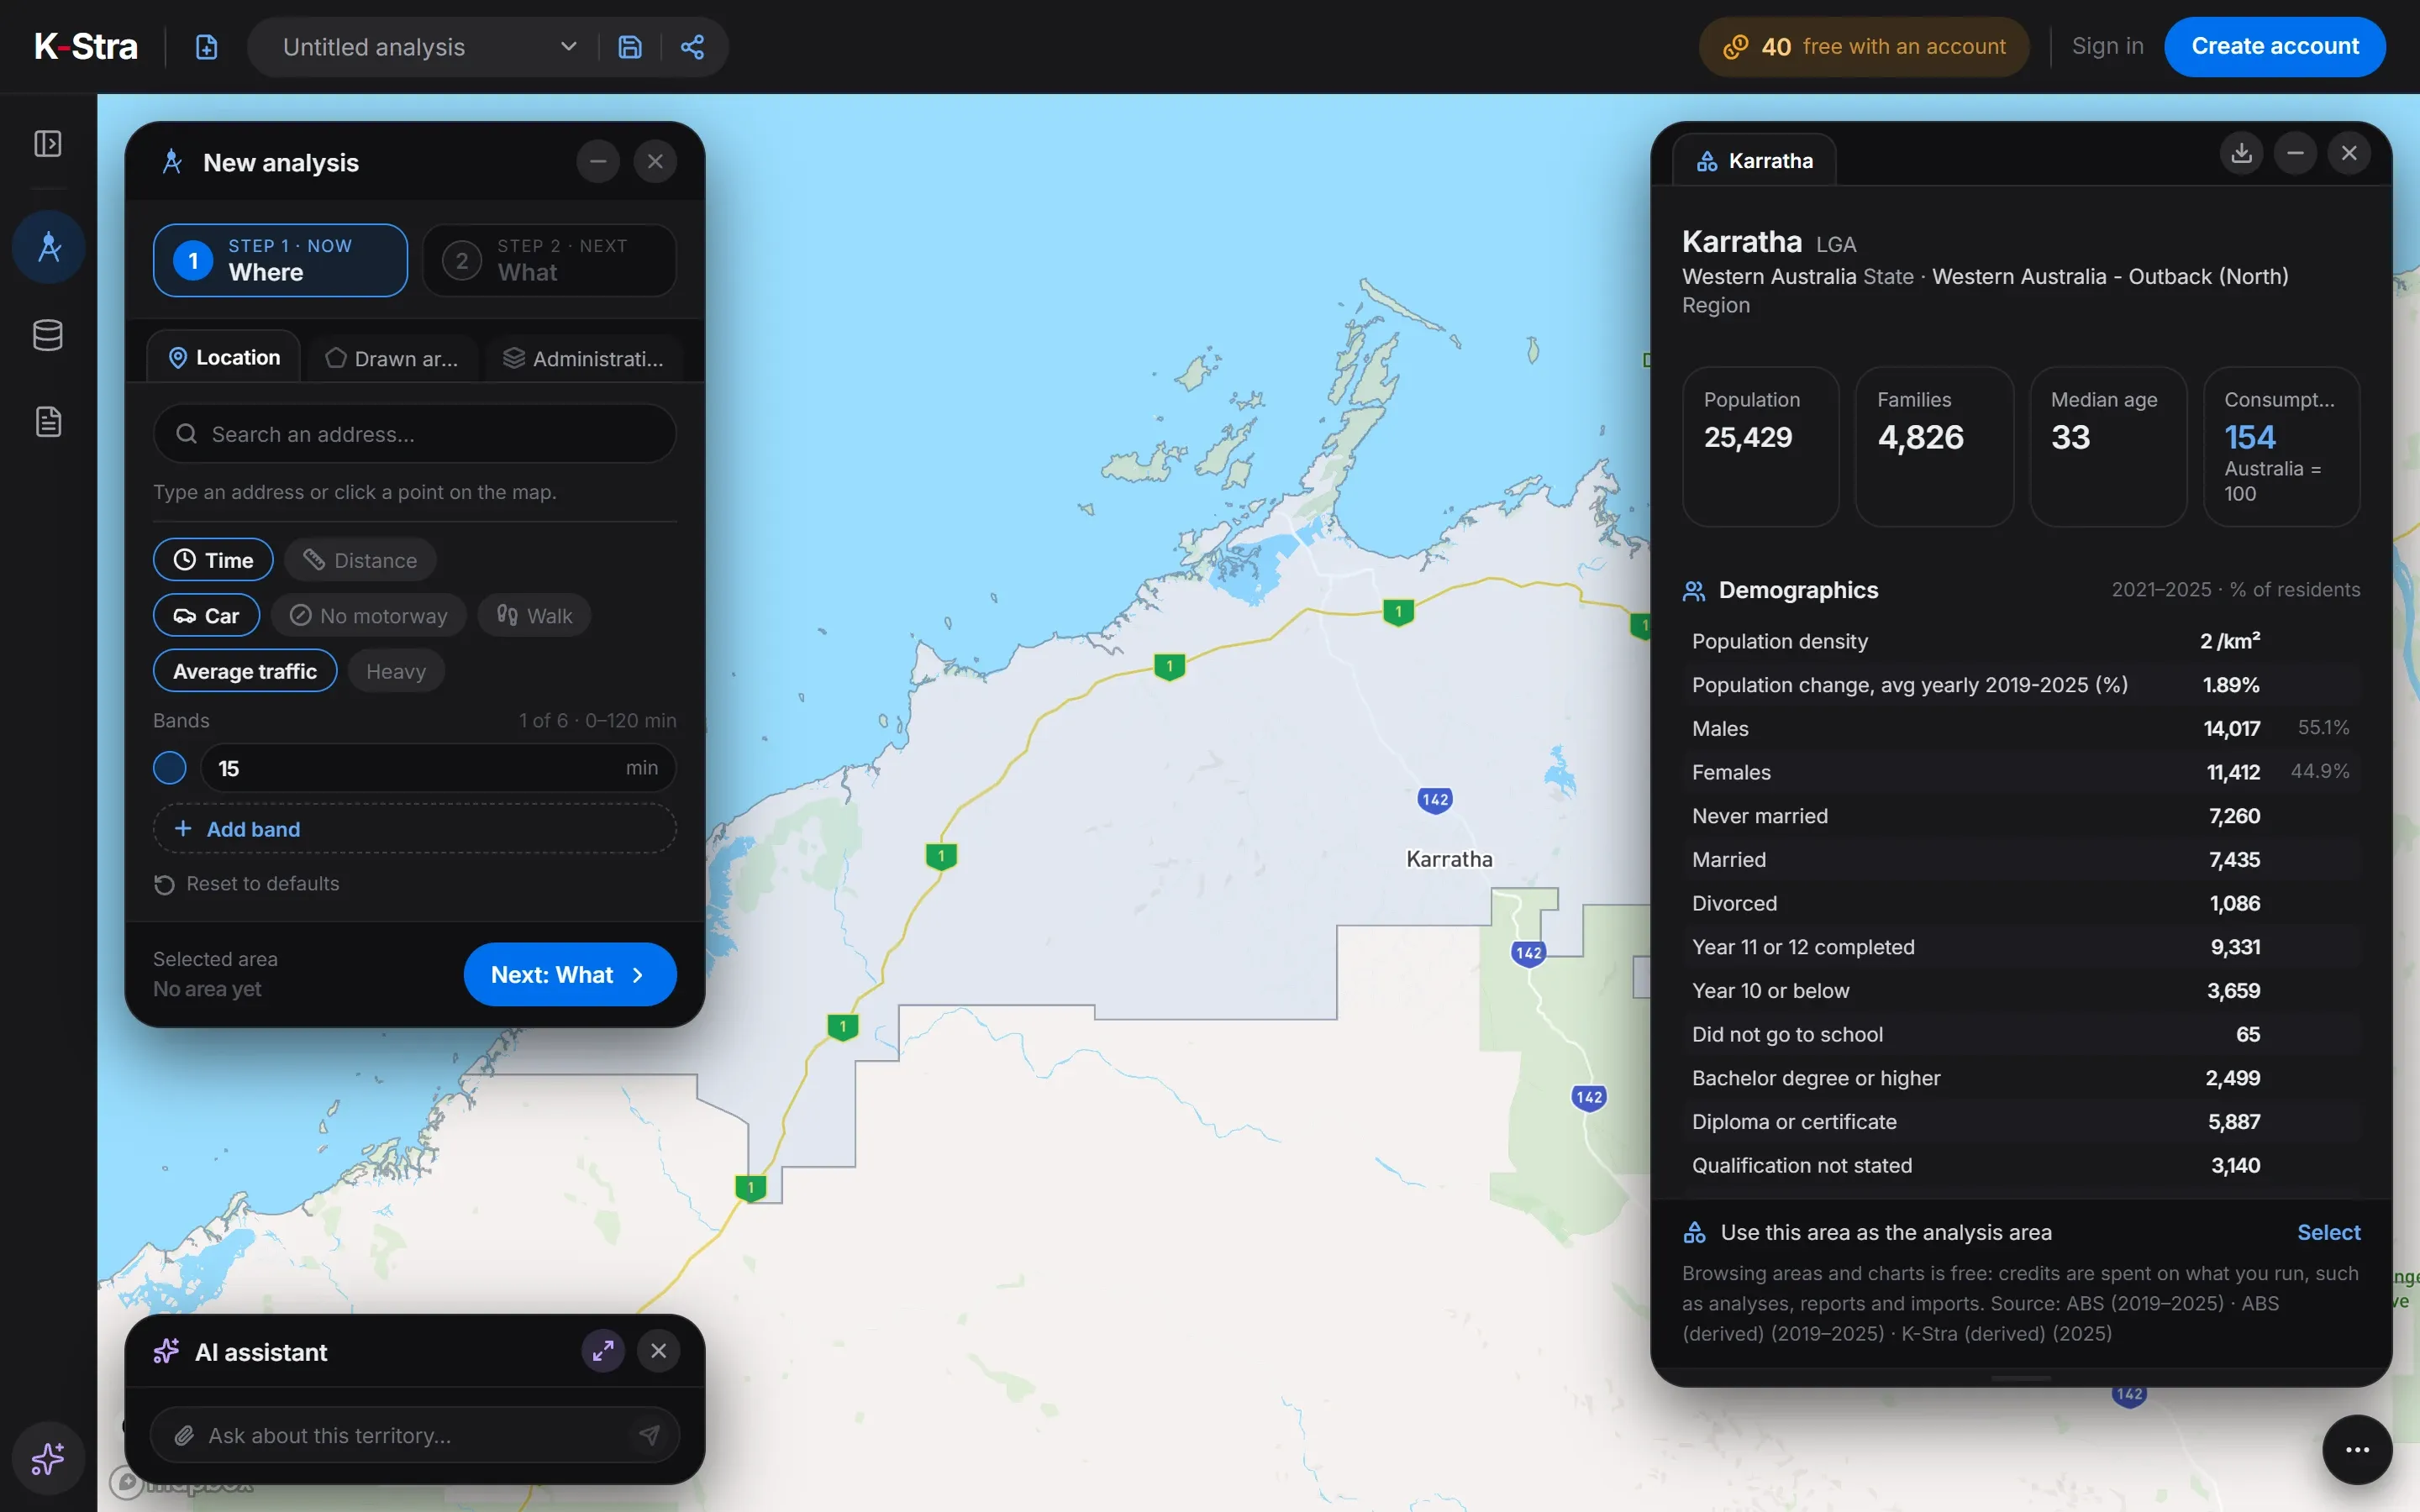 Free area dashboard · Karratha
The top of the list has two origins. Mining councils, Karratha and Kalgoorlie-Boulder in Western Australia and Isaac in Queensland, where young workforces earn high wages; and established suburbs of professionals, on Sydney’s lower north shore and eastern suburbs and in Perth’s western suburbs.
The two groups are different markets. Isaac (141.4) and Mosman (141.8) have almost the same index, but Isaac has a median age of 35.2 and 8.4% of residents over 65, Mosman 43.9 and 22.2%.
| Council | State | Residents 2025 | Income index | Spending per resident | Median age |
|---|---|---|---|---|---|
| Karratha | WA | 25,429 | 156.9 | A$80,728 | 33.0 |
| North Sydney | NSW | 73,705 | 150.3 | A$77,463 | 38.6 |
| Woollahra | NSW | 55,218 | 150.1 | A$77,341 | 39.5 |
| Lane Cove | NSW | 43,094 | 144.7 | A$74,671 | 38.0 |
| Mosman | NSW | 29,374 | 141.8 | A$73,228 | 43.9 |
| Isaac | QLD | 23,186 | 141.4 | A$73,039 | 35.2 |
| Kalgoorlie-Boulder | WA | 31,268 | 135.5 | A$70,128 | 34.3 |
| Cambridge | WA | 32,684 | 134.4 | A$69,578 | 40.3 |
| Nedlands | WA | 25,711 | 132.7 | A$68,739 | 39.8 |
| Yarra | VIC | 101,356 | 131.5 | A$68,148 | 34.6 |
| Inner West | NSW | 193,125 | 128.6 | A$66,738 | 37.3 |
| Waverley | NSW | 73,345 | 128.3 | A$66,567 | 35.0 |
| Australia | 27,613,654 | 100.0 | A$52,582 | 38.5 |
Income index from ABS Personal Income 2022–23 (tax data); consumption index derived from it; 100 = Australia. Spending per resident from the consumption index and ABS national accounts (5204.0) for 2024–25.
Which councils have the lowest incomes, and why?
The lowest indices are mostly in coastal and hinterland areas of northern NSW and Queensland, from Nambucca Valley and Kempsey to the Cassowary Coast and the Atherton Tablelands. Many residents are retired, work part time or live on pensions, which tax data records as low income.
Byron, at 67.2, shows the limit of the measure: the index is about income declared by residents, not about wealth or house prices. A place can be expensive to buy into and still have modest incomes on paper.
| Council | State | Residents 2025 | Income index | Spending per resident | Aged 65 and over |
|---|---|---|---|---|---|
| Nambucca Valley | NSW | 21,237 | 66.7 | A$36,146 | 32.0% |
| Byron | NSW | 38,784 | 67.2 | A$36,394 | 19.5% |
| Cassowary Coast | QLD | 30,666 | 68.9 | A$37,213 | 25.0% |
| Tablelands | QLD | 27,902 | 69.5 | A$37,515 | 28.1% |
| Mareeba | QLD | 24,205 | 70.1 | A$37,807 | 22.0% |
| Southern Downs | QLD | 38,064 | 70.9 | A$38,216 | 28.1% |
| Mid-Coast | NSW | 99,448 | 72.7 | A$39,107 | 34.8% |
| Kempsey | NSW | 31,950 | 73.1 | A$39,285 | 27.2% |
| Gympie | QLD | 58,487 | 73.5 | A$39,473 | 26.5% |
| Eurobodalla | NSW | 41,309 | 73.6 | A$39,548 | 34.5% |
Income index from ABS Personal Income 2022–23 (tax data); consumption index derived from it; 100 = Australia. ABS population by five-year age group at 30 June 2025; median age worked out from the age groups.
Does a high income mean a large market?
Per resident, yes; in total, rarely. North Sydney’s residents spend about A$5.7 billion a year, while Brisbane, with an income index of 107.2, adds up to A$77.2 billion because it has 1,375,301 residents.
For a premium brand the index picks the area; for a mass-market one, the number of residents within reach usually matters more. Both come together in a catchment analysis, which multiplies residents by what each spends.
What is the K-Stra income index?
It compares the average income of an area’s residents with the Australian average, set at 100, using ABS Personal Income data from tax returns for 2022–23. A council at 150 has residents earning half as much again as the average Australian.
The consumption index is derived from it and moves less, because spending varies less than income: Karratha scores 153.5 on consumption and Nambucca Valley 68.7. Spending per resident applies that index to national household spending.
What else do people ask about income?
What is the richest council in Australia?
By income index among councils with more than 20,000 residents, Karratha in Western Australia (156.9), followed by North Sydney (150.3). The index measures declared income, not wealth.
Why do mining towns rank so high?
Mining wages are among the highest in Australia, and mining councils have young populations with few retirees, so the average income per resident is high.
Why does Byron have a low income index?
Because the index reflects income declared in tax returns. Retirees, part-time and self-employed residents lower it, whatever house prices are.
Can I see the income index of a postcode?
Yes. Every council, postcode and suburb in K-Stra has an income and a consumption index in its free dashboard.
Compare incomes
area by area.
The income and consumption index of every council, postcode and suburb is free on the map.
Open the app — free to exploreBrowsing areas and their dashboards is free; you pay only for the analyses you run