
How do you measure market share and penetration in an area?
A store’s total sales hide where it wins and where it is unknown. Share and penetration, area by area, show both.
Local market share is a store’s sales in an area divided by what the area’s residents spend on the category. Penetration is the share of the area’s households that are its customers. Both are measured postcode by postcode from customer data, and both usually fall with distance from the store, which is how the trade area shows itself.
What are market share, penetration and spend per customer?
| Measure | Formula | Data needed | What it tells you |
|---|---|---|---|
| Market share | Your sales in the area ÷ residents’ spending on the category in the area | Sales or card spending by postcode, and spending statistics | How much of the local market you win |
| Penetration | Households that are your customers ÷ all households in the area | Customers or cards by postcode, and Census households | How widely you are known and used |
| Spend per customer | Your sales in the area ÷ your customers in the area | Sales and customers by postcode | How much each customer gives you |
The three are linked: share equals penetration times spend per customer, divided by spending per household. A low share can come from too few customers or from customers who spend little, and the remedy is different for each.
Retail geographers have measured trade areas and market penetration together since the 1960s, and studies of store saturation read penetration alongside the size of the catchment: the same share means more in a big market than in a small one.
Sources: Applebaum (1966), “Methods for determining store trade areas, market penetration, and potential sales”, Journal of Marketing Research 3(2); Guy (1994), International Journal of Retail & Distribution Management 22(1).
What data do you need to measure share and penetration?
Your side of the fraction comes from your own records: sales or card spending, and the number of customers, by postcode or suburb. Names and street addresses are not needed; a postcode per customer is enough.
The market side comes from public statistics: households from the ABS Census and spending on the category from the ABS national accounts, shared out by area according to income. Both must cover the same postcodes as your data.
What do share and penetration look like for one store?
A fictional grocery store in Braddon, Canberra ACT has 4,682 loyalty cards over a year, November 2025 to October 2026, spending A$7.19 million in all. The cards come from 20 postcodes with 461,577 residents and 113,278 families.
Across all 20 postcodes the store’s cards reach 4.1% of families and win 0.3% of residents’ food spending. Close to the store the picture changes: in postcode 2612 its share is 1.2%, four times the average.
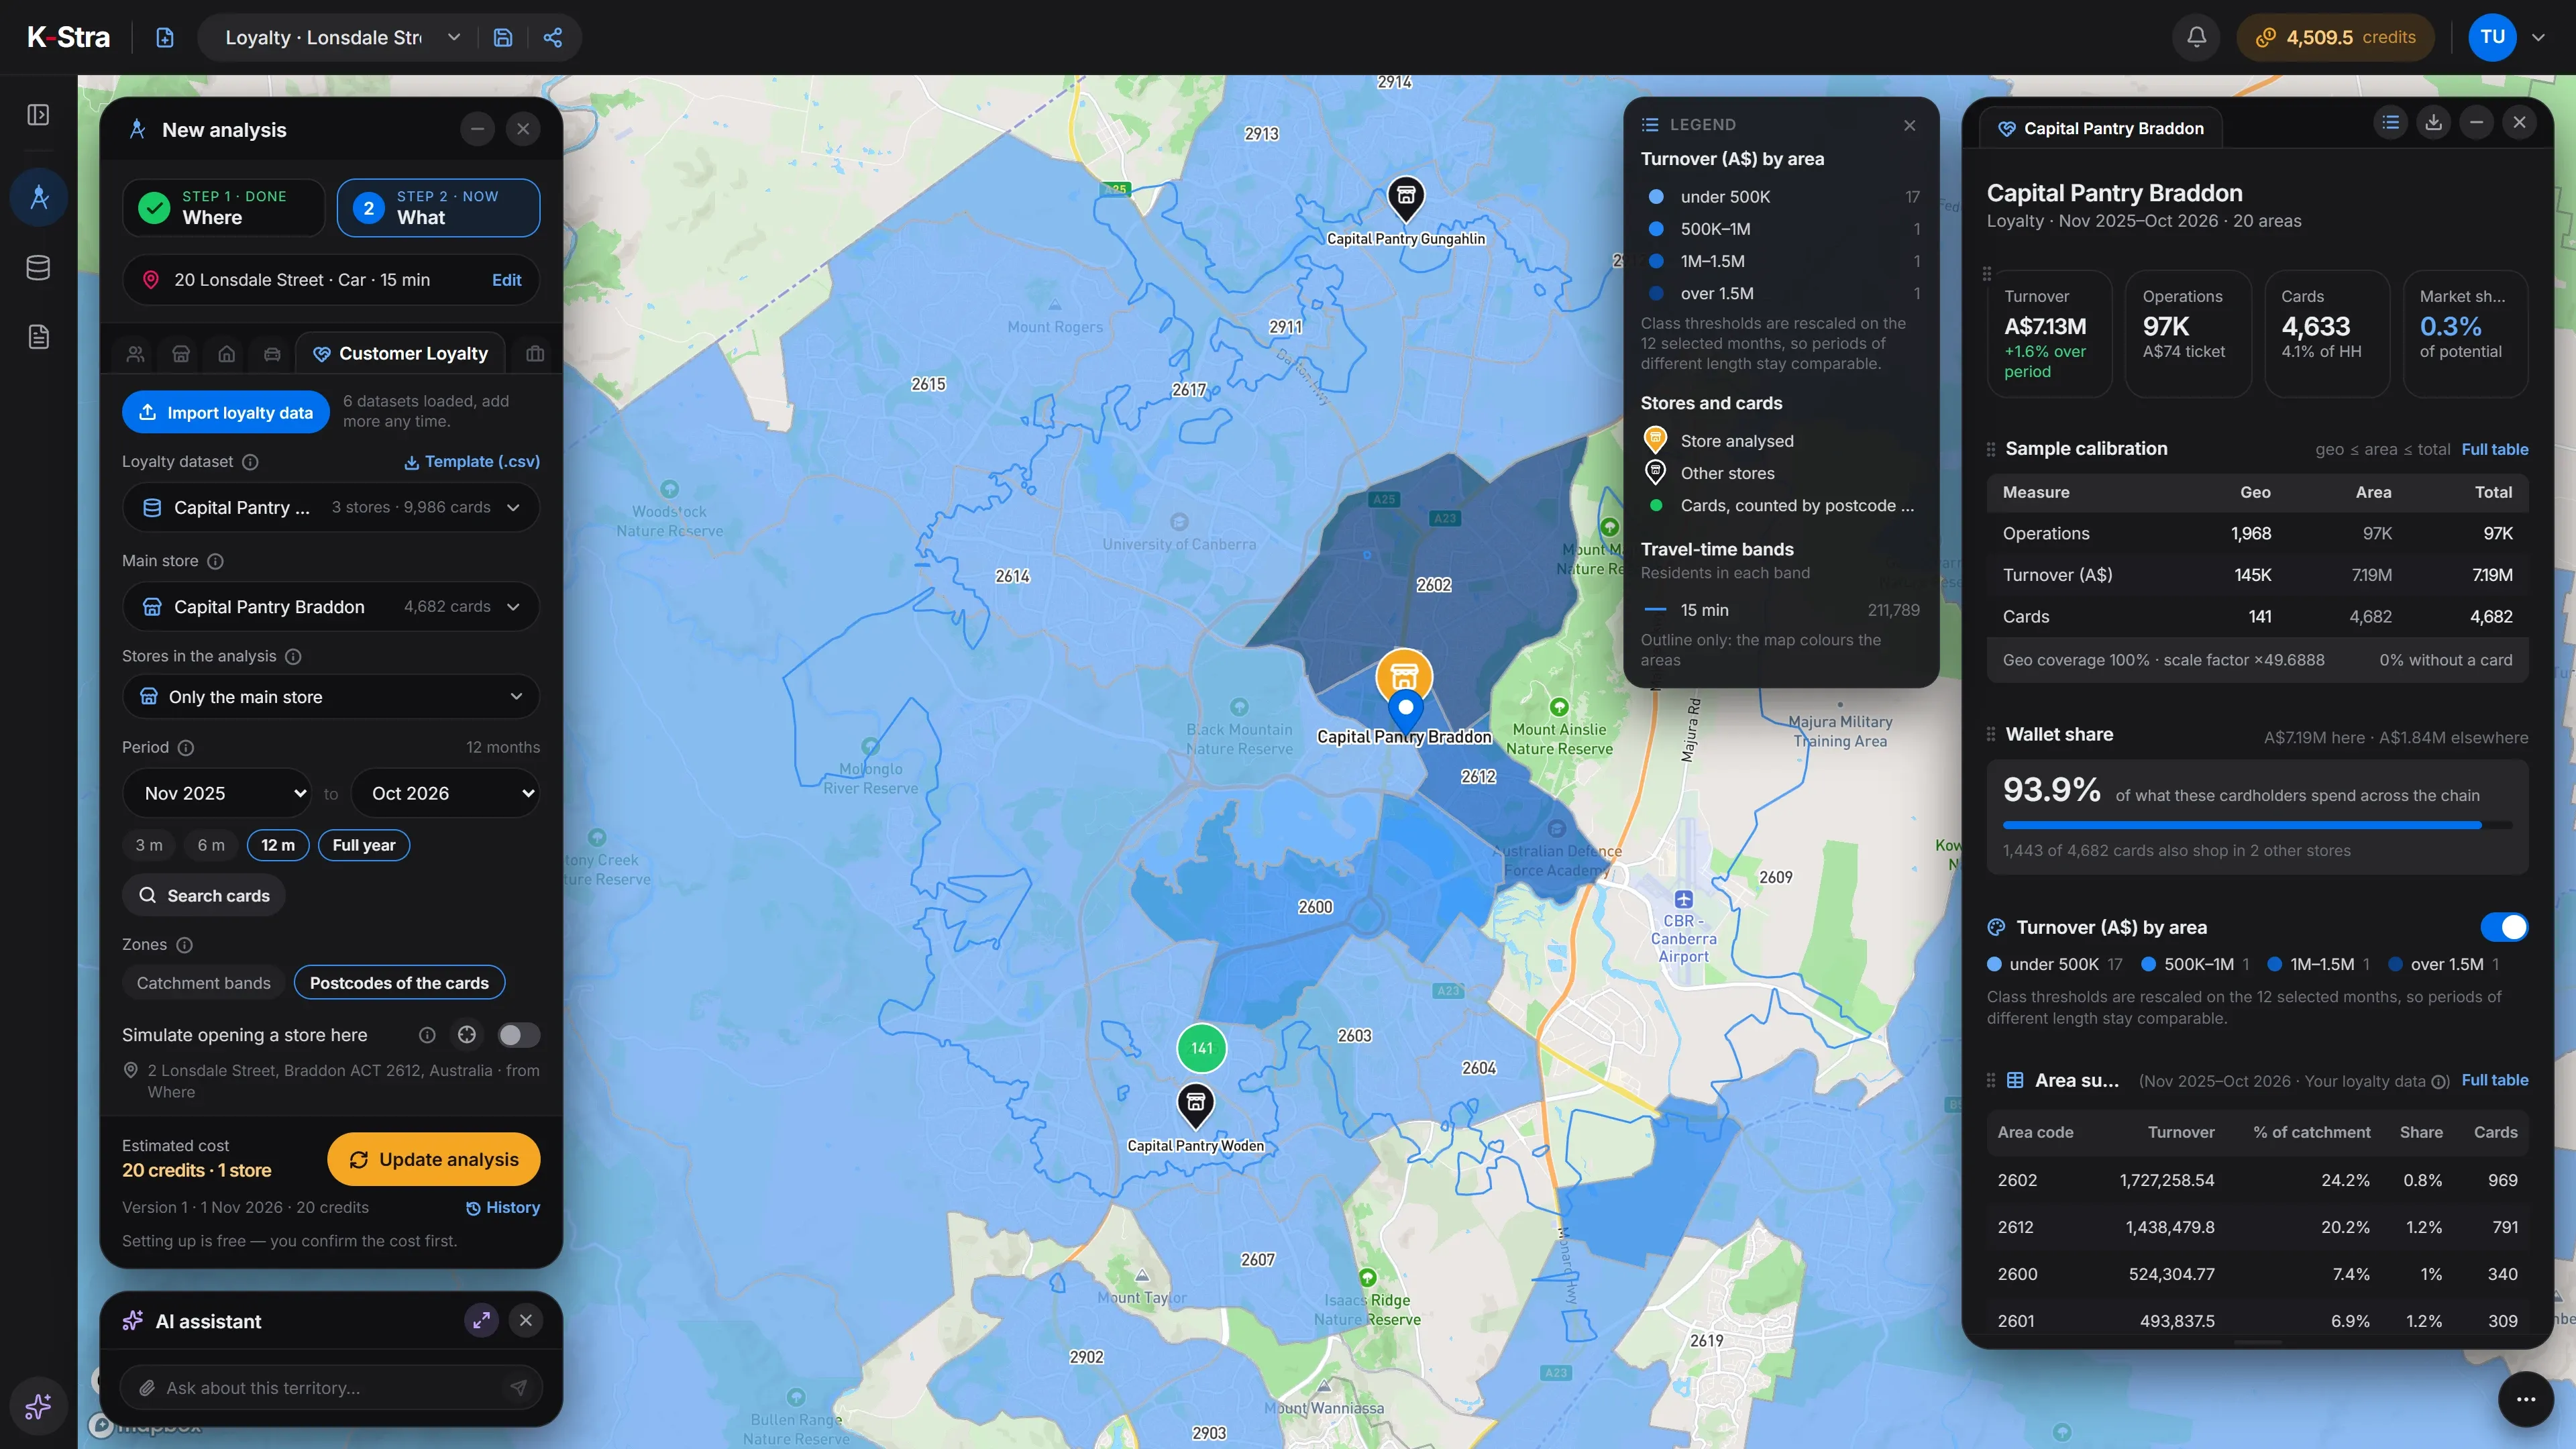 Market share · Canberra
| Postcode | Card spending (A$ M) | Share of the store’s cards’ spending | Market share of food spending |
|---|---|---|---|
| 2602 | 1.73 | 24.2% | 0.8% |
| 2612 | 1.44 | 20.2% | 1.2% |
| 2600 | 0.52 | 7.4% | 1.0% |
| 2601 | 0.49 | 6.9% | 1.2% |
| All 20 postcodes | 7.19 | 100% | 0.3% |
Source: 9,986 fictional loyalty cards of a 3-store chain in a K-Stra sample account, with suburb and postcode only, November 2025 to October 2026; families from the ABS Census 2021; food spending from the ABS national accounts 2024–25. K-Stra Customer Loyalty of 1 November 2026. Shares cover card holders only.
What should the store do with these numbers?
The biggest postcode by spending is not the one with the highest share. 2602 brings 24.2% of the store’s card spending at a share of 0.8%, while 2612 gives less money at a higher share: the first is a large market barely tapped, the second a small one already won.
That is where the two measures earn their keep. Marketing money goes further where penetration is low and the market is large; loyalty efforts belong where share is already high. Total sales alone would have sent both budgets to the same place.
What else do people ask about market share and penetration?
What is the difference between market share and penetration?
Market share measures money: the part of residents’ spending on a category that goes to you. Penetration measures people: the part of households that buy from you at all. A store can have high penetration and low share if many households buy a little.
Can I calculate a competitor’s market share?
Not from public data. Market share needs sales, which competitors do not publish by area. What can be modelled is how residents’ spending would divide among stores by distance and attraction, which is a different and weaker measure.
Why do share and penetration fall with distance?
Because each extra minute of travel makes a store less convenient against the others customers can reach. The fall is steepest for frequent, low-value purchases such as groceries and gentlest for rare, specialist ones.
Is a share from loyalty cards accurate?
It is a floor. Customers without a card, and purchases made without scanning it, are missing, so the true share is higher. It is still the best way to compare postcodes with each other, because the gap is similar everywhere.
See where you win,
postcode by postcode.
Load your cards or sales by postcode, without names, and read share and penetration on the map.
Open the app — free to exploreExploring the map is free; you pay only for the analyses you run