
What is retail cannibalisation, and how is it measured?
Every chain eventually opens a store that competes with its own. The question is not whether that happens, but how much, and whether the network still gains.
Retail cannibalisation is the share of a new store’s customers or sales that comes from the same company’s existing stores rather than from competitors. It is measured three ways: the residents two stores’ catchments share, the customers who use both, and the spending a model moves from one store to the other when the new one opens.
Why do stores of the same network take customers from each other?
Customers do not belong to a store; they choose among the stores they can reach. When a chain opens a new branch, the households between the old and the new one now have two of its stores within reach, and some of them switch.
Huff’s model, published in 1963, describes this as probability: each household has a chance of choosing each store, rising with the store’s attraction and falling with travel time. A new store changes every household’s probabilities nearby, including those of its sister stores.
Cannibalisation is therefore not a mistake but a side effect of being close to customers. A network with no overlap at all usually has gaps; one with too much pays rent twice for the same people.
Source: Huff (1963), “A probabilistic analysis of shopping center trade areas”, Land Economics 39(1).
How do you measure cannibalisation?
| Measure | What it counts | Data needed | Example |
|---|---|---|---|
| Shared residents | People living inside the catchments of two stores at once | Store locations and population | 84.2% of one store’s residents also within 5 minutes of the other (Port Macquarie) |
| Shared customers | Customers who buy at more than one store of the network | Loyalty cards or customer records | 1,443 of one store’s 4,682 cards also used at another store of the chain (Canberra) |
| Moved spending | Spending a model shifts from existing stores to the new one | Population, spending and every competing store | A planned site taking 31% of a sister store’s captured spending (Brisbane) |
Shared residents is the simplest and needs no customer data: it says how much of the market two stores could fight over. It overstates the problem when two stores serve different needs, or when one of them is much stronger.
Shared customers shows what people actually do, but only for card holders and only after the store has opened. Moved spending is the one that can be estimated before opening, and it weighs competitors as well as distance.
What does overlap look like between two stores?
A fictional two-store grocery network in Port Macquarie NSW, each store with a 5-minute catchment by car. The CBD store reaches 11,654 residents, and every one of them is also within 5 minutes of the Lighthouse Beach store, which reaches 13,846.
Seen from Lighthouse Beach, 84.2% of its residents are shared with the CBD store, and 97.5% can also reach one of the 4 competing supermarkets. Almost all of this network’s market is contested twice: by its own other store and by the competition.
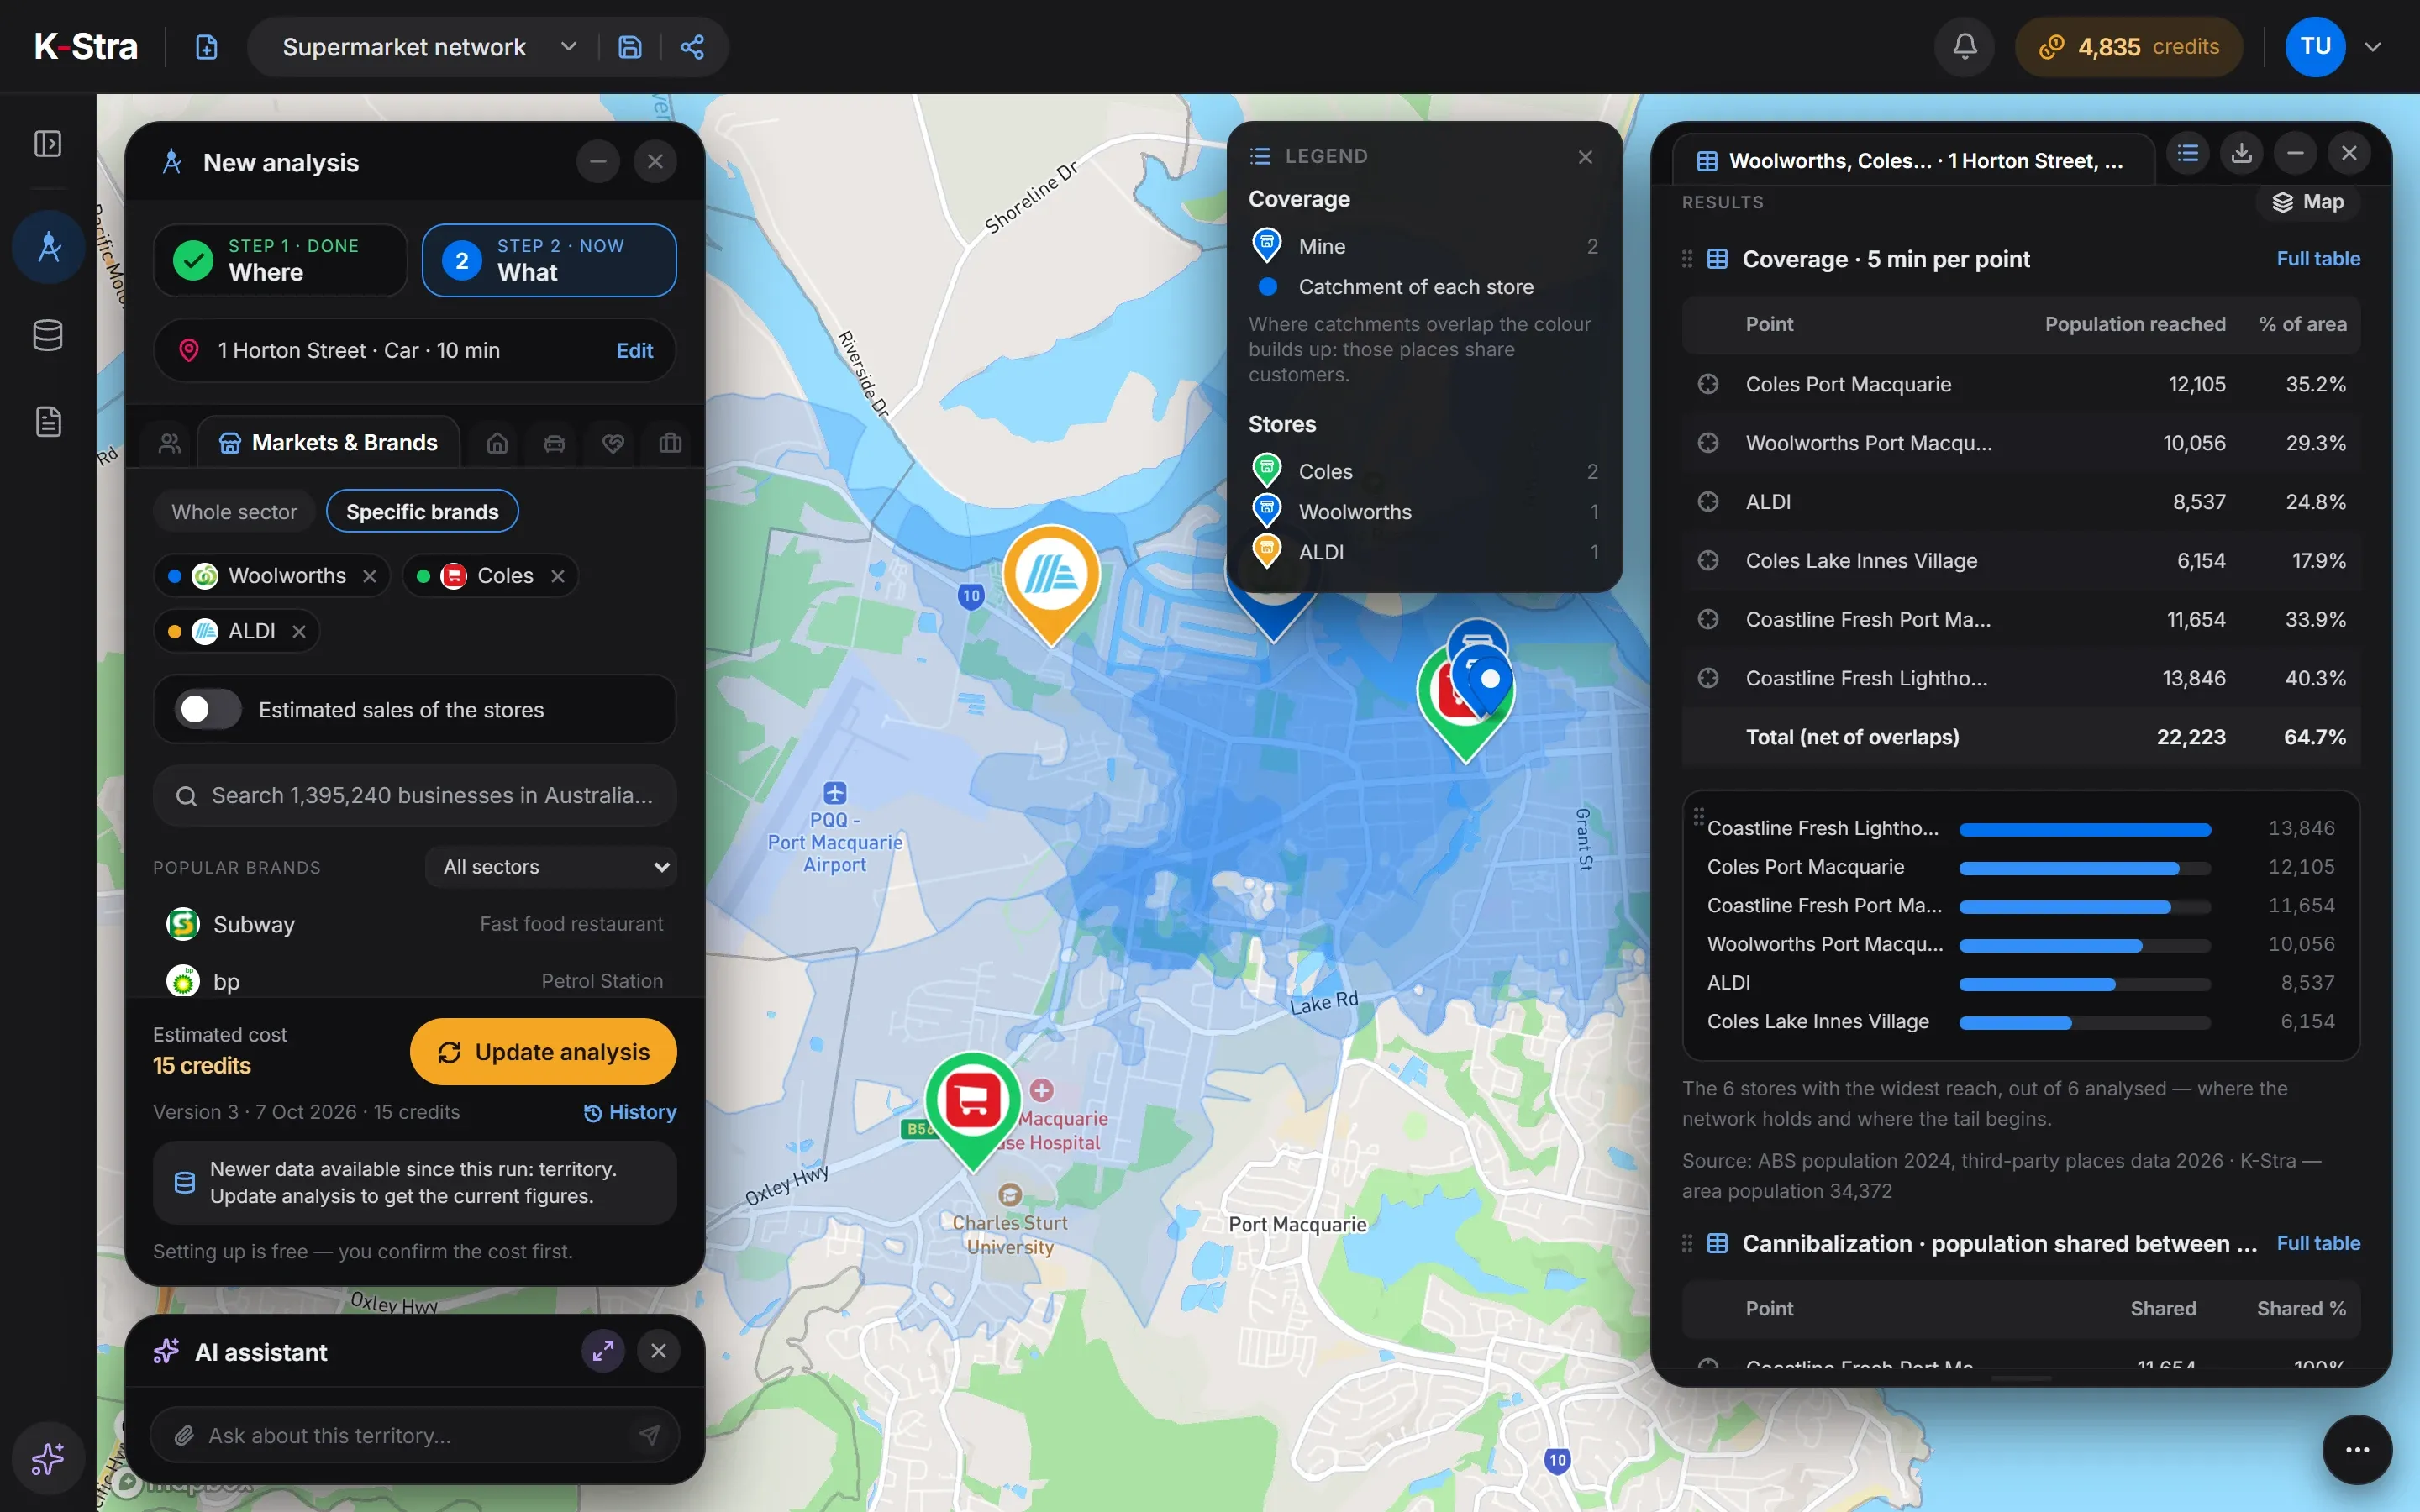 Overlap · Port Macquarie
Source: a fictional pair of stores placed in a K-Stra sample account and the 4 supermarkets of the places catalogue nearby; Coverage of 7 October 2026 with 5-minute drive times; residents from ABS population estimates for 2024.
Does a high overlap mean one store should close?
Not on its own. Overlap says where to look; behaviour says how much it matters. In a fictional Canberra chain with 3 stores, 1,443 of the 4,682 cards of the Braddon store also shopped at another store of the chain, yet Braddon itself still took 79.6% of what its card holders spent in the chain.
For a store not yet open, the moved-spending measure answers the question. In a fictional Brisbane network, a planned site at Holland Park would take 31% of the residents’ spending that Mount Gravatt captures today: a real cost to weigh against the 24,734 residents it would add to the network.
Sources: fictional networks in a K-Stra sample account — Customer Loyalty of 1 November 2026 on 4,682 sample cards (November 2025 to October 2026); Coverage of 1 November 2026, 5 minutes by car per store; ABS population estimates at 30 June 2025. Captured spending is a modelled share of residents’ spending, not sales.
What else do people ask about cannibalisation?
Is cannibalisation always bad?
No. A new store that takes some customers from a sister store can still add more than it moves, by reaching people the network missed or by winning share from competitors. The question is the balance: what the network gains against what each store loses.
What is an acceptable level of cannibalisation?
There is no universal figure. It depends on margins, rent and how full the existing store is: a store that turns customers away at peak times can lose some without harm. Measure it for every candidate and compare sites on what they add net of it.
How do franchise networks deal with cannibalisation?
Mostly through territories: each franchisee has an area, and a new unit is checked for the residents it would share with neighbours before it is granted. Territories built on equal markets make the check easier to explain.
Can I measure cannibalisation without customer data?
Yes, with shared residents and modelled spending, which need only store locations and public data. Customer data, where you have it, shows how much of the overlap is real behaviour rather than geography.
See where your stores
share the same people.
Put your stores on the map, give each a catchment and read the overlap, store by store.
Open the app — free to exploreExploring the map is free; you pay only for the analyses you run