
How do I see traffic and footfall for an area in K-Stra?
Traffic & Footfall gives a band of vehicles or a grade of footfall to every road of the area. This guide covers the panel, the period, the results and the cost.
Choose the area in the Where step, then open “Traffic & Footfall” in the What step. Pick “Vehicles” or “Pedestrians”, a day, a range of days or a month in the calendar and, if you want, the hours. “Show vehicles” or “Show pedestrians” runs it for 30 credits per area; other periods on the same area are then free.
How do I run Traffic & Footfall?
Any area of the Where step works: a travel-time area around an address, a drawn shape or administrative areas. Until there is one, the panel says “Choose the area in Where first”.
The “i” next to “Vehicles” and “Pedestrians” opens “How the estimate is made”. The line under “When” says what you are about to see, for example “Vehicles a day, both directions”.
Choose the area
In the Where step, type an address and keep a travel-time band, draw a shape, or pick administrative areas.
Open Traffic & Footfall
Click “Next: What”, then the “Traffic & Footfall” tab.
Vehicles or pedestrians
Choose “Vehicles” or “Pedestrians” at the top of the panel.
Choose the period
Leave “Average day of the year”, or click a day, a second day for a range, or “Whole month”; pick hours on the “Hours” bar.
Run it
Click “Show vehicles” or “Show pedestrians” and confirm “Run analysis” for 30 credits per area.
How do the calendar and the hours work?
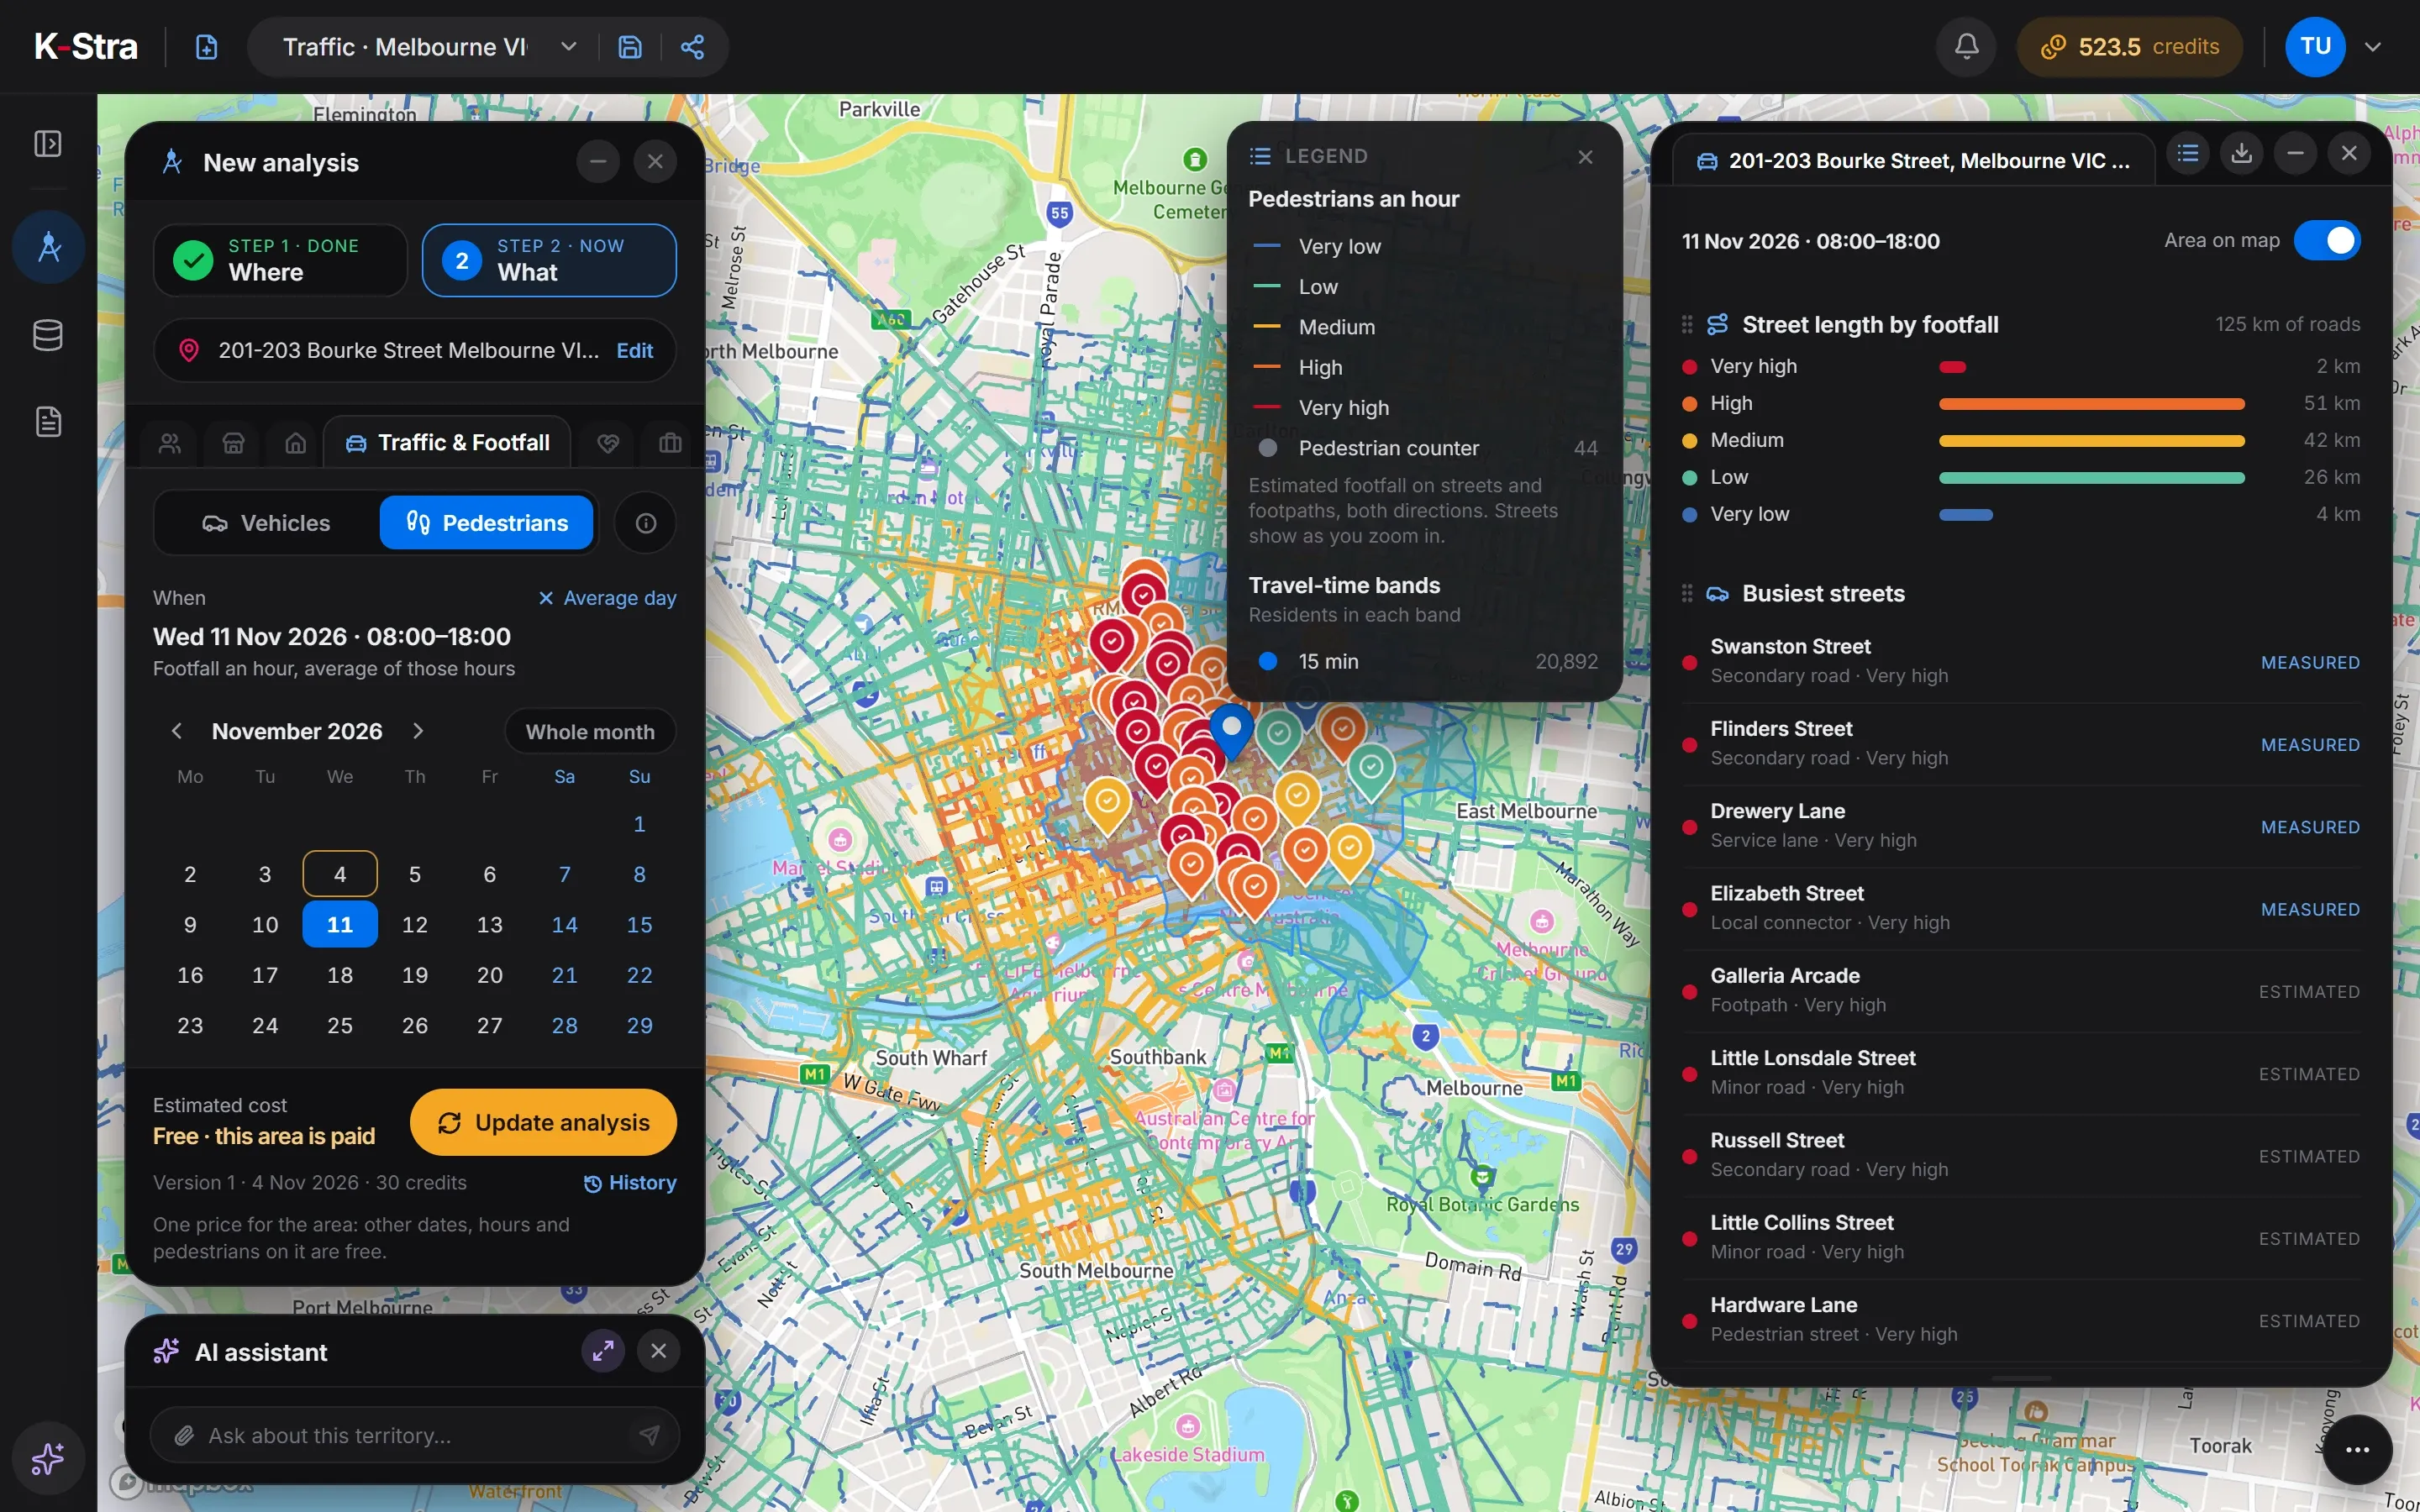 In the app
A click on a day chooses it, a second click closes a range, a third starts again; “Whole month” takes the month and “Average day” clears the dates. A range shows the average day of the days inside it, and public holidays count as Sundays.
Hours work the same way on the bar of 24 hours, and “All day” clears them. With an hour the bands become “Vehicles in the hour”; with a range of hours, “Vehicles an hour, average of those hours”.
How do I read the results?
The map colours every road by band, from “Under 1,000 a day” to “Over 60,000 a day”, or by grade of footfall, from “Very low” to “Very high”. Markers are official counts or pedestrian counters, in the colour of the measured band.
“Road length by traffic” gives the kilometres in each band, “Busiest roads” the busiest named roads tagged “Measured” or “Estimated”, and “Official counts in the area” each count with the agency and its year. “Area on map” hides the area to see the roads better.
| Vehicles | Pedestrians | What it shows |
|---|---|---|
| Road length by traffic | Street length by footfall | Kilometres of road in each band or grade |
| Busiest roads | Busiest streets | The busiest named roads, “Measured” or “Estimated” |
| Official counts in the area | Pedestrian counters in the area | Each count with its band, agency and year |
What does it cost to change the day?
Nothing. An area costs 30 credits per area once, however large it is and for any period. Once it is paid, the footer says “Free · this area is paid” and “Update analysis” runs other days, other hours or pedestrians at no cost.
After an update of the road network the same place counts as a new area and is paid again the first time. A failed run charges nothing.
What else do people ask about Traffic & Footfall?
Why is there no exact number of vehicles?
Because a model cannot know it: every road gets a band, and a measured count is shown in its band too. Estimates are closest on main roads and wider on local streets and motorways.
Can I compare two dates on the same area?
Yes, for free once the area is paid. Change the date and click “Update analysis”: each run is kept as a version of the analysis.
Can I add traffic to a report?
Yes. Drag the tables of the results into a report, and capture the map view with the coloured roads.
Open K-Stra
and try it yourself.
The map, address search and area dashboards work without an account; a free account adds credits for your first analyses.
Open the app — free to exploreBrowsing areas and their dashboards is free; you pay only for the analyses you run