
How do I run an analysis in K-Stra?
The full sequence, with the options of each step and the limits that apply, from an empty map to a saved analysis you can reopen for free.
An analysis has two steps. In “Where” you choose the area: an address with drive or walk bands, a drawn shape, or administrative areas. In “What” you choose what to measure. “Evaluate & decide” shows the exact cost; credits are charged only when the run finishes, and nothing is charged if it fails.
What are the steps of an analysis?
The analysis panel opens on the left when you start. You can go back to “Where” at any time with “Edit”; nothing runs until you confirm the cost.
Choose the area in Where
In the “Location” tab type an address or click the map; in “Drawn area” draw a shape; in “Administrative” pick states, regions, councils, postcodes or suburbs.
Set the bands
For an address choose “Time” or “Distance”, then “Car”, “No motorway” or “Walk”, “Average traffic” or “Heavy”, and up to 6 bands. For a circle, choose “Distance”: a fourth option, “Radius”, appears next to the three modes.
Go to What
Click “Next: What” and pick a category: People & Economy, Markets & Brands, Real Estate, Customer Loyalty or Sales.
Check the quote
Click “Evaluate & decide”. The window “Run this analysis?” shows the total cost and your balance after.
Run it
Click “Run analysis”. The result opens in the workspace and the analysis is saved with its own link.
Which options does the Where step have?
Bands go from 0–120 minutes in time or 0.1–30 km in distance, up to 6 per analysis. “Radius”, offered only with “Distance”, draws a true circle as the crow flies and ignores roads, so it has no traffic setting; “No motorway” keeps the drive off motorways; traffic applies to driving only.
A drawn area accepts up to 10 shapes and 5,000 vertices in all: click to place the corners and double-click to close. The Administrative tab takes up to 12 areas.
| Tab | What you choose | Limit |
|---|---|---|
| Location | An address or a point; Time or Distance; Car, No motorway or Walk (or Radius, with Distance); Average traffic or Heavy | 6 bands (8 for Customer Loyalty), 0–120 minutes or 0.1–30 km |
| Drawn area | One or more shapes drawn on the map | 10 shapes, 5,000 vertices |
| Administrative | State, Region, LGA, Postcode or Suburb | 12 areas |
| Any | The territory covered by the analysis | 1,000,000 address points; above, “Narrow the territory first” |
What can I measure in the What step?
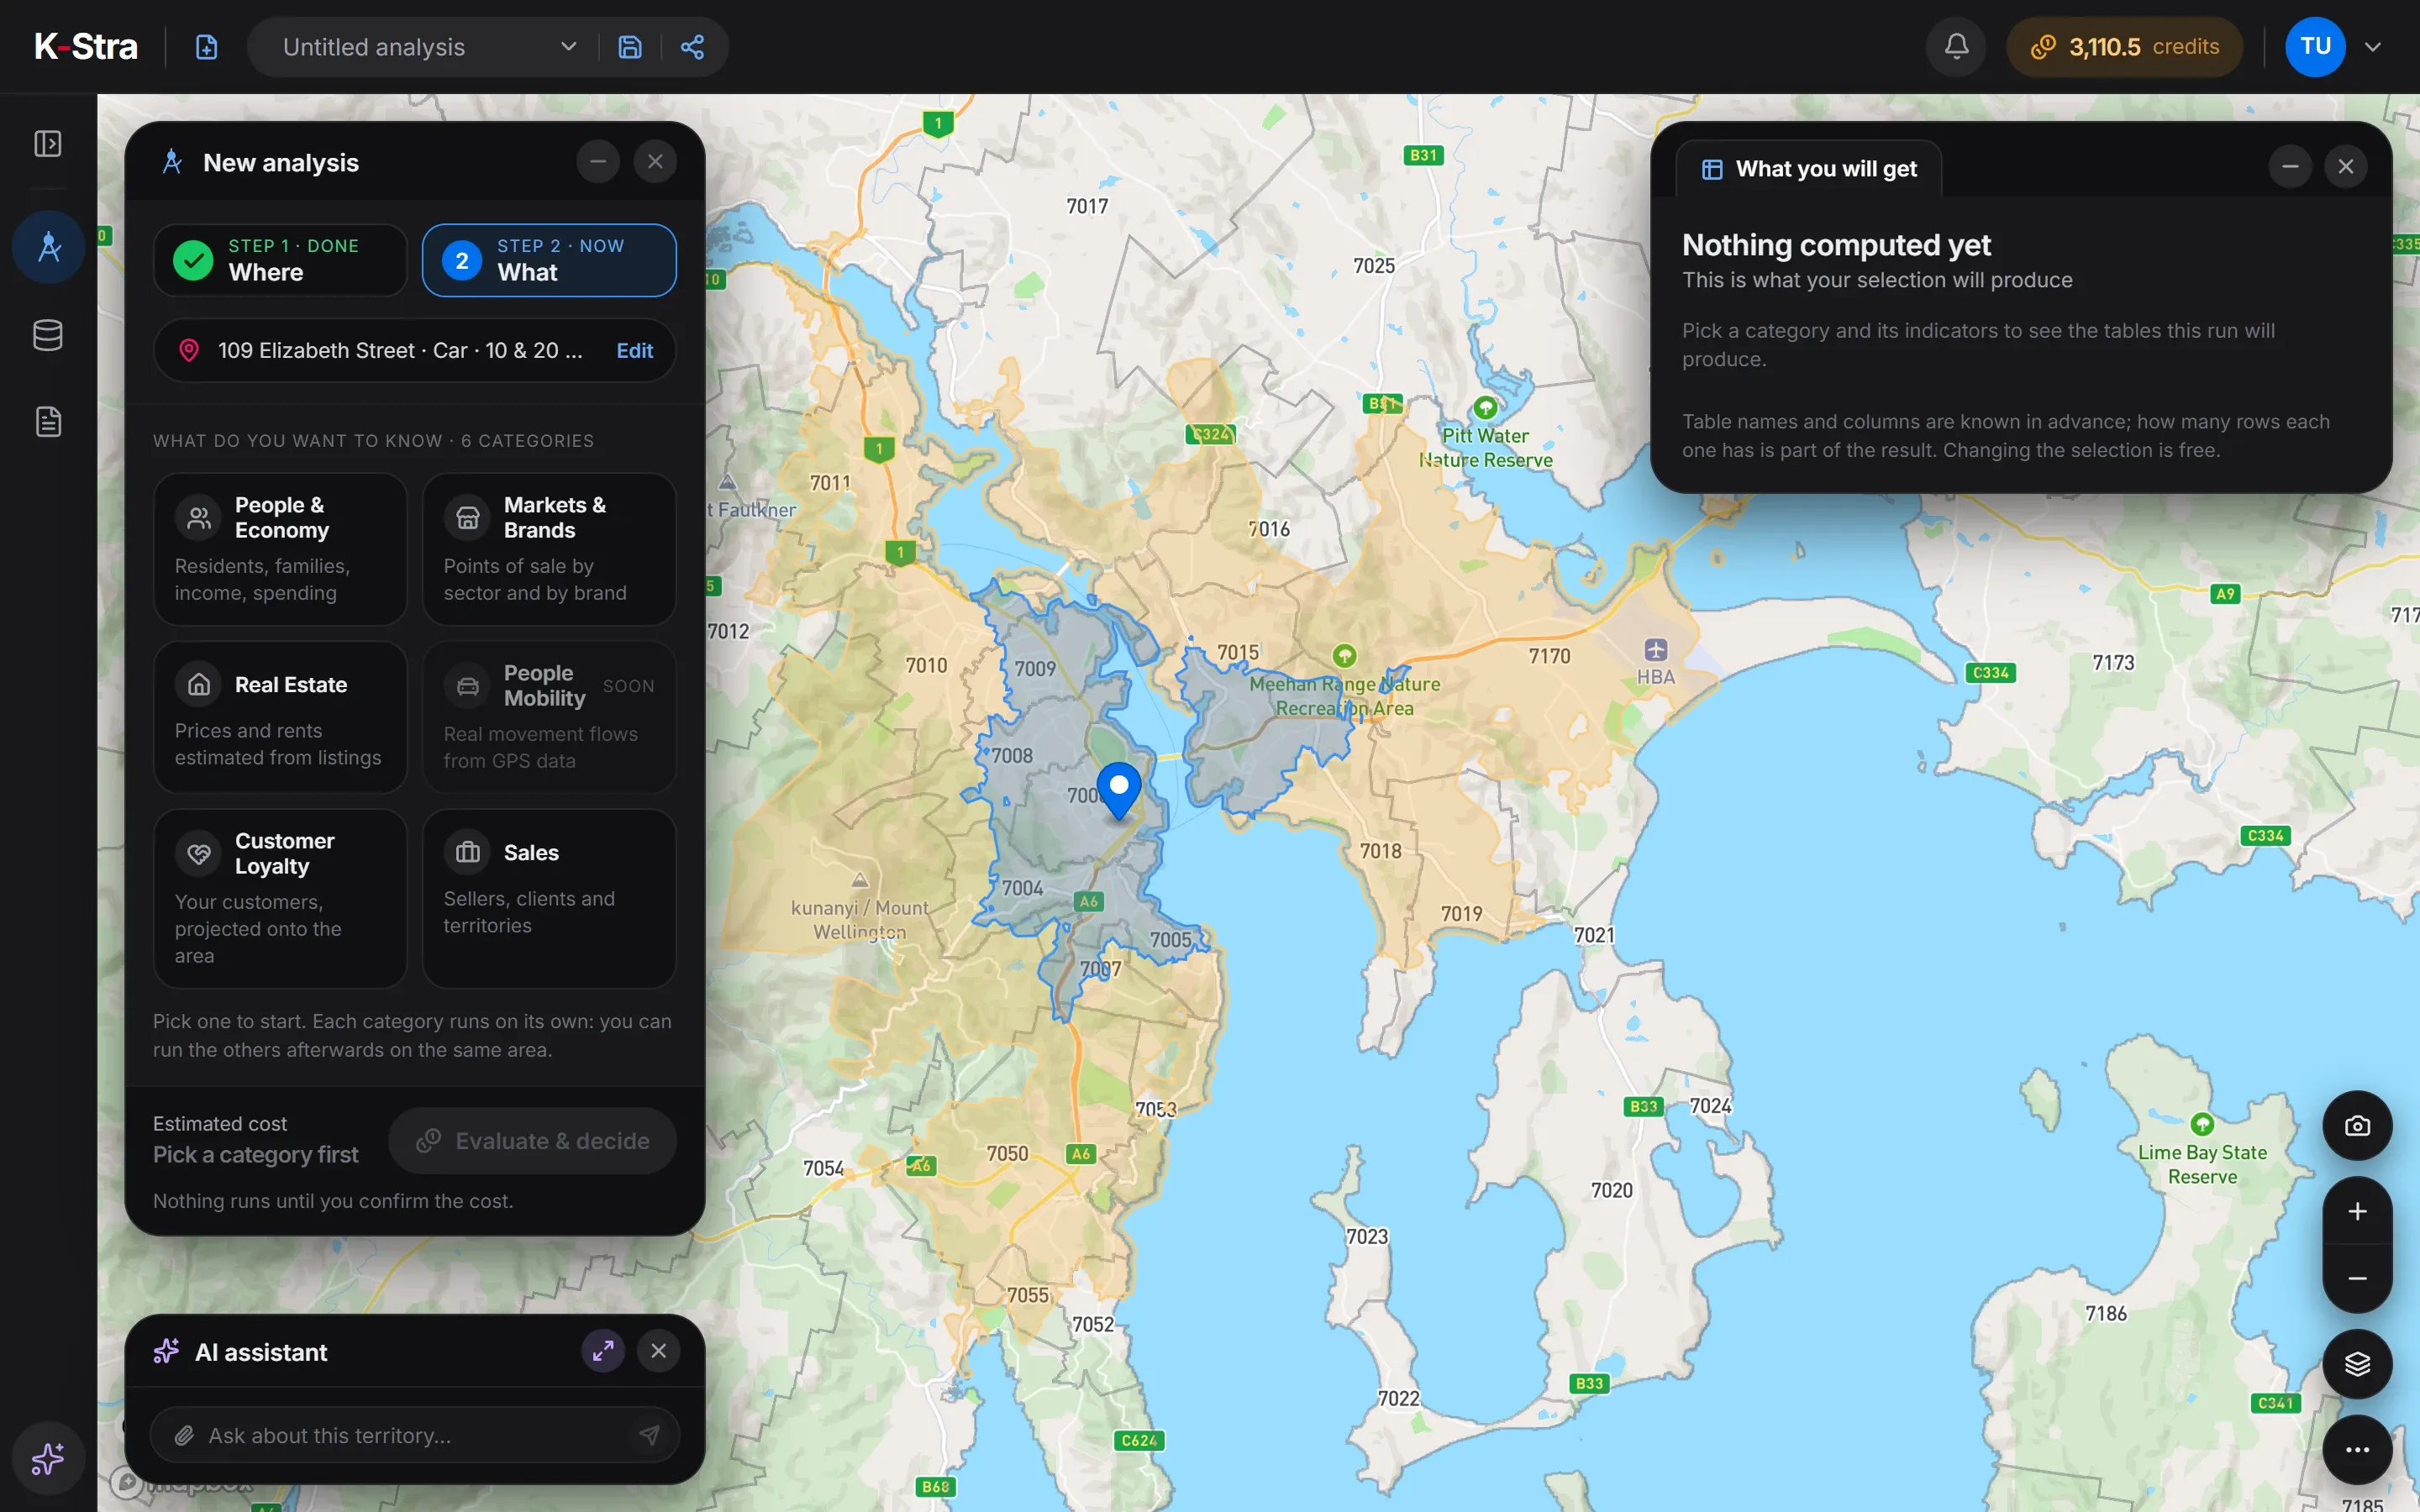 In the app
People & Economy has 10 topics at 2 credits per topic. Markets & Brands measures a whole sector (40 credits per sector), specific brands (up to 10 a run) or a category mix, and adds network coverage and site comparison.
Real Estate prices an area or one property; Customer Loyalty and Sales work on your own data from My Data. Traffic & Footfall estimates vehicles and pedestrians on every road of the area (30 credits per area).
When are credits charged for an analysis?
When the analysis finishes, as the quote window says: “Credits are charged when the analysis finishes.” If the run fails, nothing is charged.
If a run fails, the result card offers “Try again”, and a retry is not charged twice. Every operation, with its cost, is listed in the account menu under “Usage”.
How do I save, reopen and update an analysis?
A paid run saves the analysis and names it after what, where and when; you can also save a draft with “Save analysis”. Each analysis has a link of the form /a/ followed by a 12-character code, and “Saved analyses” at the top lists them.
Reopening is free: “Only a new run uses credits.” With nothing changed the button reads “Update analysis” and runs it again at the same price; the result becomes the next version under “History”, or a new analysis with “Save as a new analysis”.
What else do people ask about running an analysis?
Can I run an analysis without an account?
No. Drawing areas and opening dashboards is free for everyone, but running an analysis needs a free account, which starts with welcome credits.
How many bands can an analysis have?
Up to 6, from 0–120 minutes in time or 0.1–30 km in distance. Customer Loyalty is the exception: its catchment takes up to 8 bands.
Do results expire?
No. A paid result stays in the analysis and can be reopened at any time for free. When newer data is available, a banner says so and “Update analysis” runs it again.
Can I compare two versions side by side?
Not yet. “History” lists every version with its date and credits, and you can open each one.
Open K-Stra
and try it yourself.
The map, address search and area dashboards work without an account; a free account adds credits for your first analyses.
Open the app — free to exploreBrowsing areas and their dashboards is free; you pay only for the analyses you run