
Did Australians leave the capital cities during the pandemic?
Six years of ABS population estimates, split between the capital cities and the rest of each state, show how short the capitals’ dip was, and where the move to the regions lasted.
For one year, largely because overseas migration stopped. In the year to June 2021 Australia’s capital cities lost 0.27% of their residents while the rest of the country grew 0.99%; Melbourne fell 1.71% and Sydney 0.64%. From 2022 the capitals grew faster again, and over 2019–2025 they grew more than regional areas in every state.
How fast did the capitals and the regions grow each year?
The pandemic year stands out. With international borders closed from March 2020, overseas migration, which settles mostly in the capitals, collapsed, and in the year to June 2021 the capitals as a whole lost residents while regional Australia kept growing.
The reversal was fast. In the year to June 2023 the capitals grew 2.99%, more than twice the regional rate, as students and migrants returned; regional growth stayed between 0.99% and 1.38% a year throughout.
| Year to 30 June | Capital cities | Rest of Australia | Difference (points) |
|---|---|---|---|
| 2020 | +1.27% | +1.19% | +0.08 |
| 2021 | -0.27% | +0.99% | -1.27 |
| 2022 | +1.33% | +1.24% | +0.09 |
| 2023 | +2.99% | +1.38% | +1.61 |
| 2024 | +2.33% | +1.32% | +1.01 |
| 2025 | +1.75% | +1.10% | +0.65 |
| 2019–2025, in total | +9.74% | +7.45% | +2.30 |
ABS Estimated Resident Population by council at 30 June, 2019 to 2025, on 2025 council boundaries. Capital cities are the ABS Greater Capital City Statistical Areas (ASGS Edition 3); each council is split by the share of its address points inside one.
Which capitals shrank in 2021, and which kept growing?
The dip was a Sydney and Melbourne story. Melbourne, after the longest lockdowns, lost 1.71% of its residents in the year to June 2021 and Sydney 0.64%; Brisbane, Perth and Adelaide slowed but kept growing.
Over the whole six years the picture turns around. Greater Perth grew 16.0% and Greater Brisbane 13.2%, far ahead of their own regions, and in every state the capital ended up growing at least as much as the rest.
| State | Capital | Capital, year to June 2021 | Rest of state, year to June 2021 | Capital, 2019–2025 | Rest of state, 2019–2025 |
|---|---|---|---|---|---|
| New South Wales | Sydney | -0.64% | +0.72% | +7.27% | +5.87% |
| Victoria | Melbourne | -1.71% | +1.24% | +8.45% | +7.41% |
| Queensland | Brisbane | +0.88% | +1.06% | +13.18% | +9.71% |
| Western Australia | Perth | +1.40% | +1.12% | +16.01% | +8.48% |
| South Australia | Adelaide | +0.65% | +0.79% | +8.59% | +4.40% |
| Tasmania | Hobart | +1.56% | +1.87% | +5.25% | +5.14% |
| Northern Territory | Darwin | +0.09% | +0.59% | +7.66% | +6.77% |
ABS Estimated Resident Population by council at 30 June, 2019 to 2025, on 2025 council boundaries. The ACT is left out: it is all capital city, with no regional part. Capital cities are the ABS Greater Capital City Statistical Areas (ASGS Edition 3); each council is split by the share of its address points inside one.
Which regional councils grew fastest, and did they keep growing?
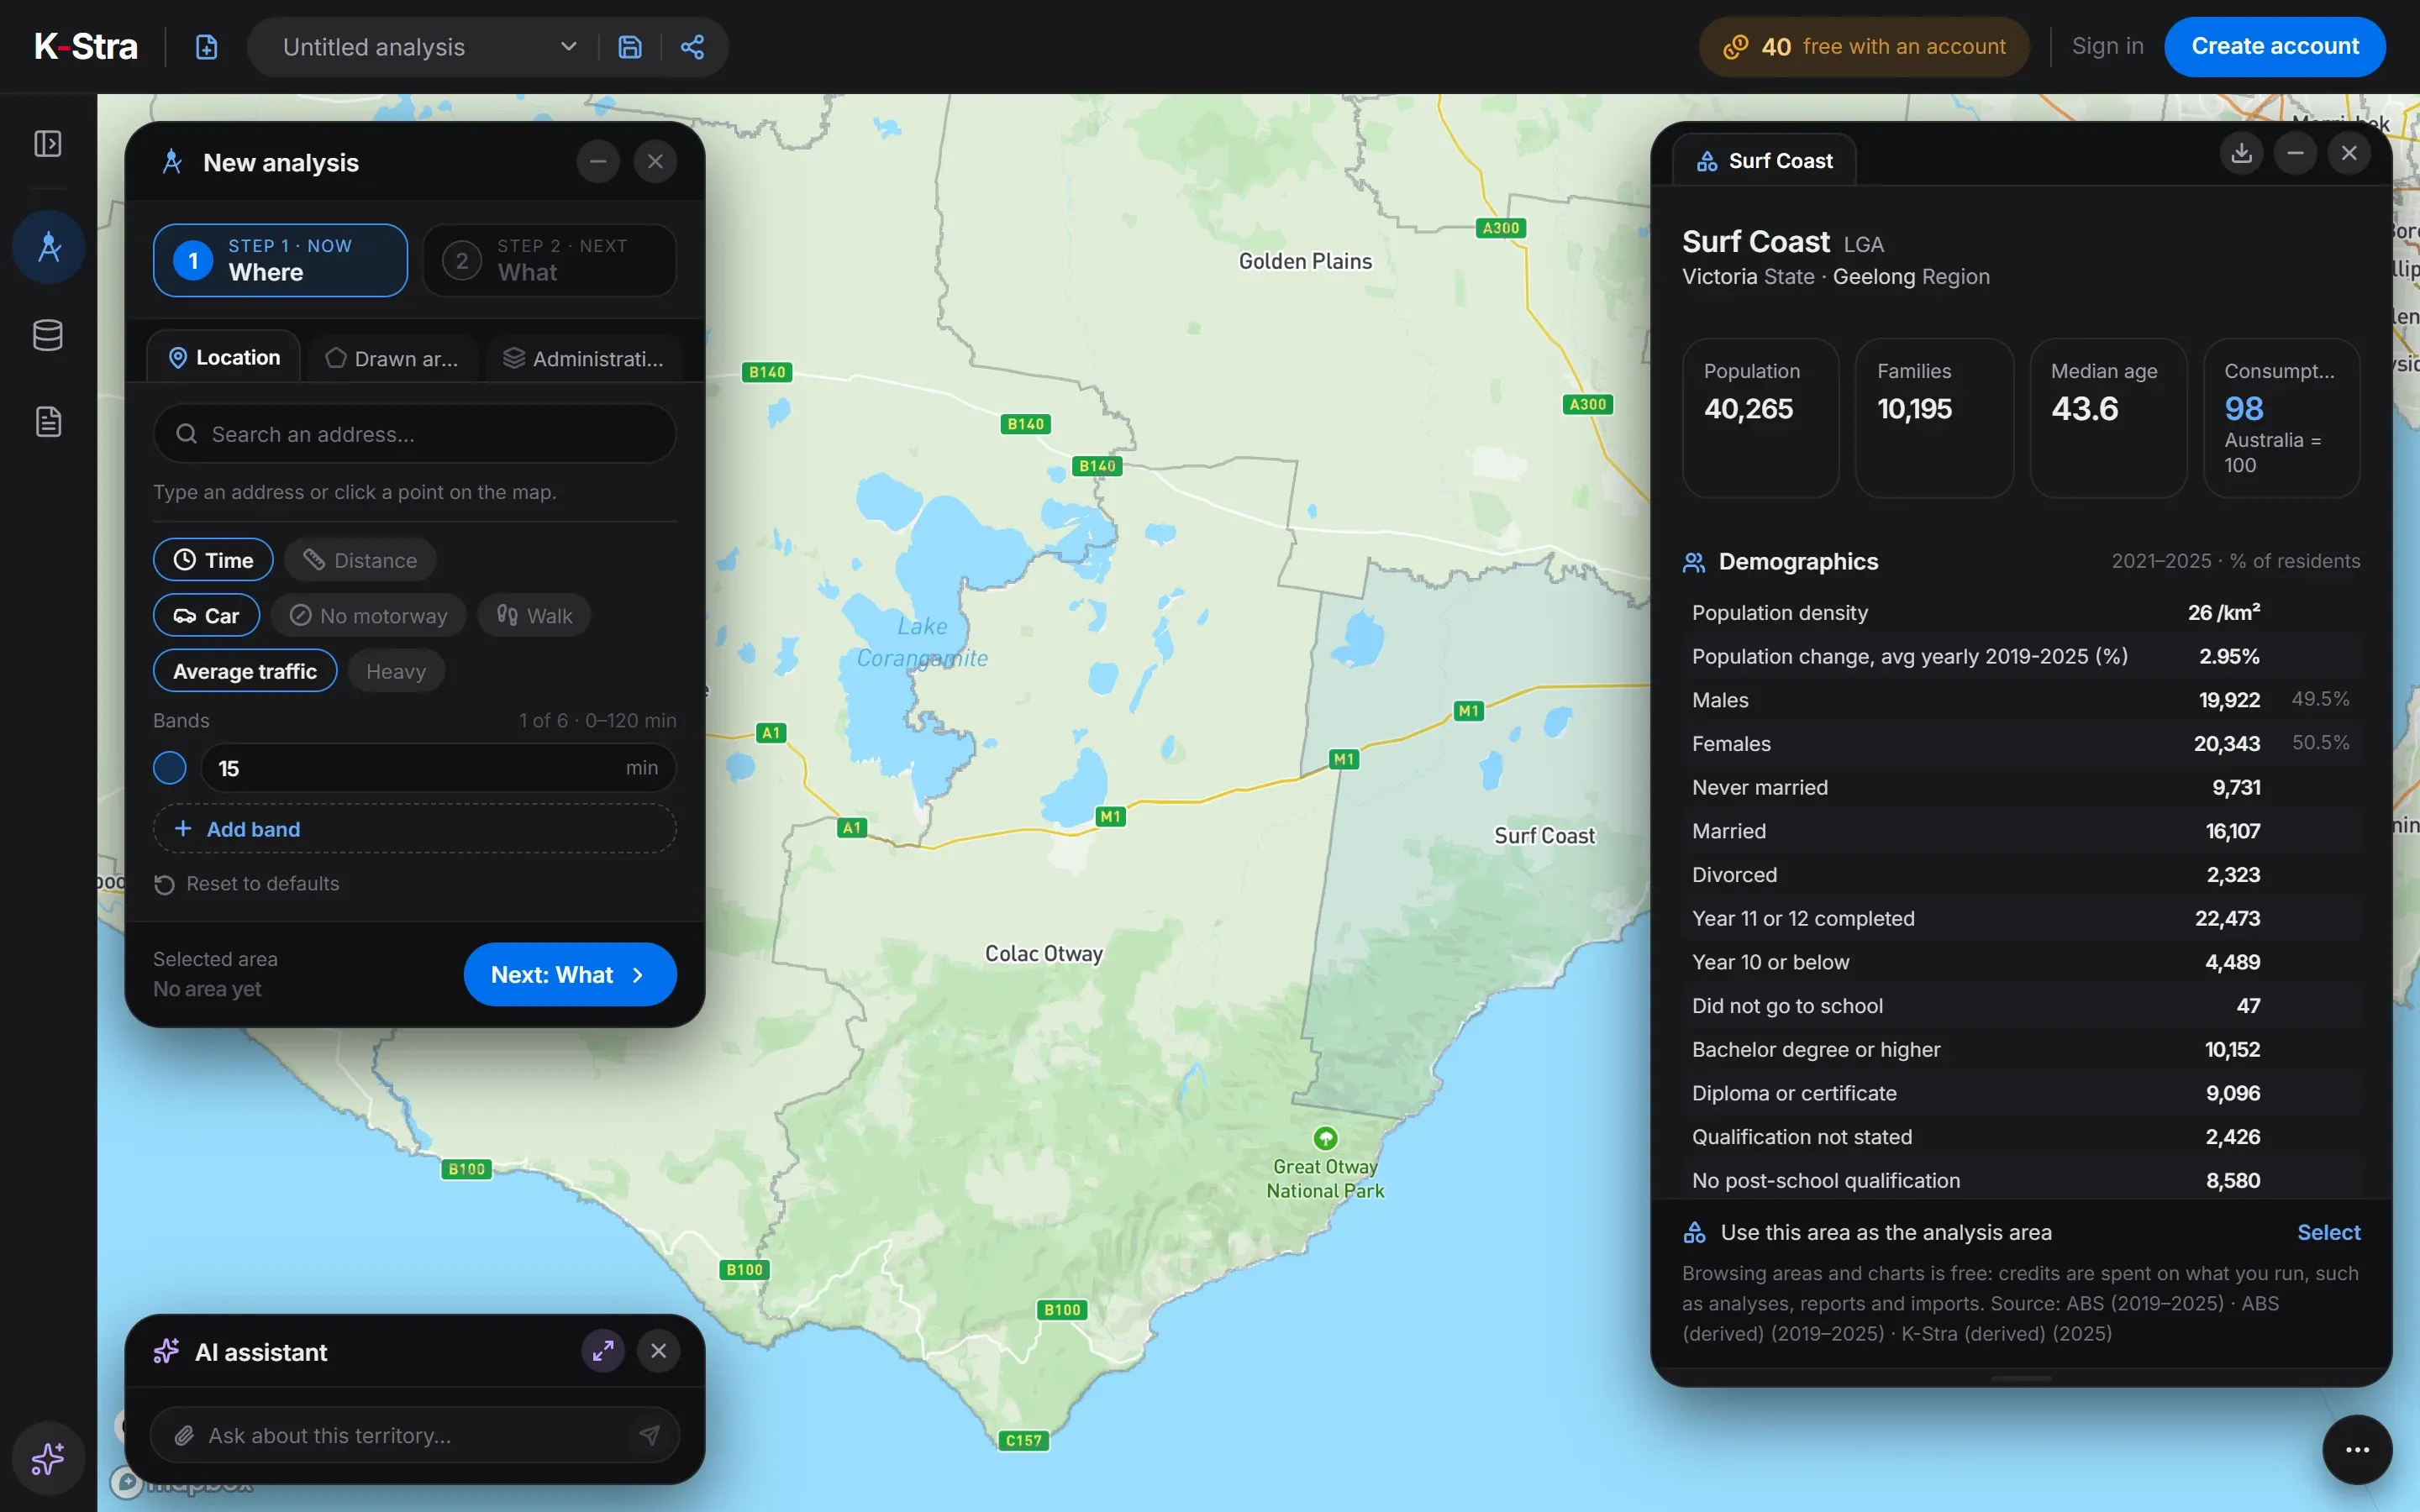 Free area dashboard · Surf Coast
The “sea change” councils boomed and then slowed. Surf Coast, on the coast south-west of Geelong, grew 5.08% in the year to June 2021 and only 1.08% in the year to June 2025; Bass Coast, around Phillip Island, followed the same curve.
Councils within commuting reach of a large city kept their pace. Maitland and Cessnock in the Hunter, next to Newcastle, grew between 2% and 3.5% every year, and Cessnock grew faster in 2025 than in 2021.
| Council | State | Residents 2025 | Growth 2019–25 | Average yearly change | Year to June 2021 | Year to June 2025 |
|---|---|---|---|---|---|---|
| Augusta Margaret River | WA | 20,170 | 24.2% | 4.04% | +3.04% | +3.50% |
| Bass Coast | VIC | 44,377 | 18.5% | 3.09% | +4.43% | +2.09% |
| Maitland | NSW | 100,439 | 17.7% | 2.96% | +3.06% | +2.25% |
| Surf Coast | VIC | 40,265 | 17.7% | 2.95% | +5.08% | +1.08% |
| Cessnock | NSW | 71,443 | 17.5% | 2.91% | +2.71% | +2.90% |
| Baw Baw | VIC | 62,784 | 16.2% | 2.69% | +3.35% | +1.60% |
| Sunshine Coast | QLD | 381,957 | 15.8% | 2.63% | +2.44% | +2.05% |
| Busselton | WA | 46,184 | 14.9% | 2.49% | +2.31% | +2.20% |
| Whitsunday | QLD | 41,374 | 14.1% | 2.35% | +1.45% | +1.81% |
| Fraser Coast | QLD | 122,924 | 13.7% | 2.28% | +1.94% | +2.14% |
Regional: less than 10% of the council’s residents inside a Greater Capital City area.
What does this mean for opening a store outside a capital city?
A six-year average can describe a town that no longer exists. A council that grew 5% in 2021 and 1% in 2025 still shows a strong average, so for a decision about the next five years the last two years say more than the whole series.
The steady growers include councils within commuting reach of a large city, such as Maitland, Cessnock and the Sunshine Coast, and a few holiday regions that kept attracting residents: Augusta Margaret River grew faster in 2025 than in 2021. Check the latest years of the place itself, not the label “regional”.
What else do people ask about capitals and regions?
Did people really move from Sydney and Melbourne to the regions?
Some did, but the capitals’ fall was brief. Both capitals lost residents in the year to June 2021, while the rest of Australia grew 0.99%. Much of the fall came from overseas migration stopping, not only from people moving out.
Is regional Australia still growing faster than the capitals?
No. From the year to June 2022 onwards the capitals grew faster each year, and over 2019–2025 they grew 9.7% against 7.4% for the rest of Australia.
How is a council assigned to a capital city?
By where its residents live. K-Stra counts each council’s residents on the address points inside the ABS Greater Capital City area; a council partly inside is split in the same proportion.
Where can I see the yearly figures for one council?
In the free dashboard of the council in K-Stra, which shows the average yearly change since 2019, and in a population analysis of any catchment you draw.
See how your region
has changed.
Every council, postcode and suburb has a free dashboard with residents, age, income and growth.
Open the app — free to exploreBrowsing areas and their dashboards is free; you pay only for the analyses you run