
How many people live in Perth, and how much do they spend?
A long coastal city of houses, growing at both ends: Perth spends more per head than any other large Australian city, and spreads that spending more evenly.
Greater Perth had 2,452,786 residents at 30 June 2025 and grew about 16.3% from 2019, on average 2.72% a year, the fastest of the large capitals. Residents spend about A$56,330 each a year, the most of the six largest cities. A 45-minute drive from Forrest Place reaches 2,188,565 people, and incomes vary less between postcodes than in Sydney or Melbourne.
How many people live within 15, 30 and 45 minutes of central Perth?
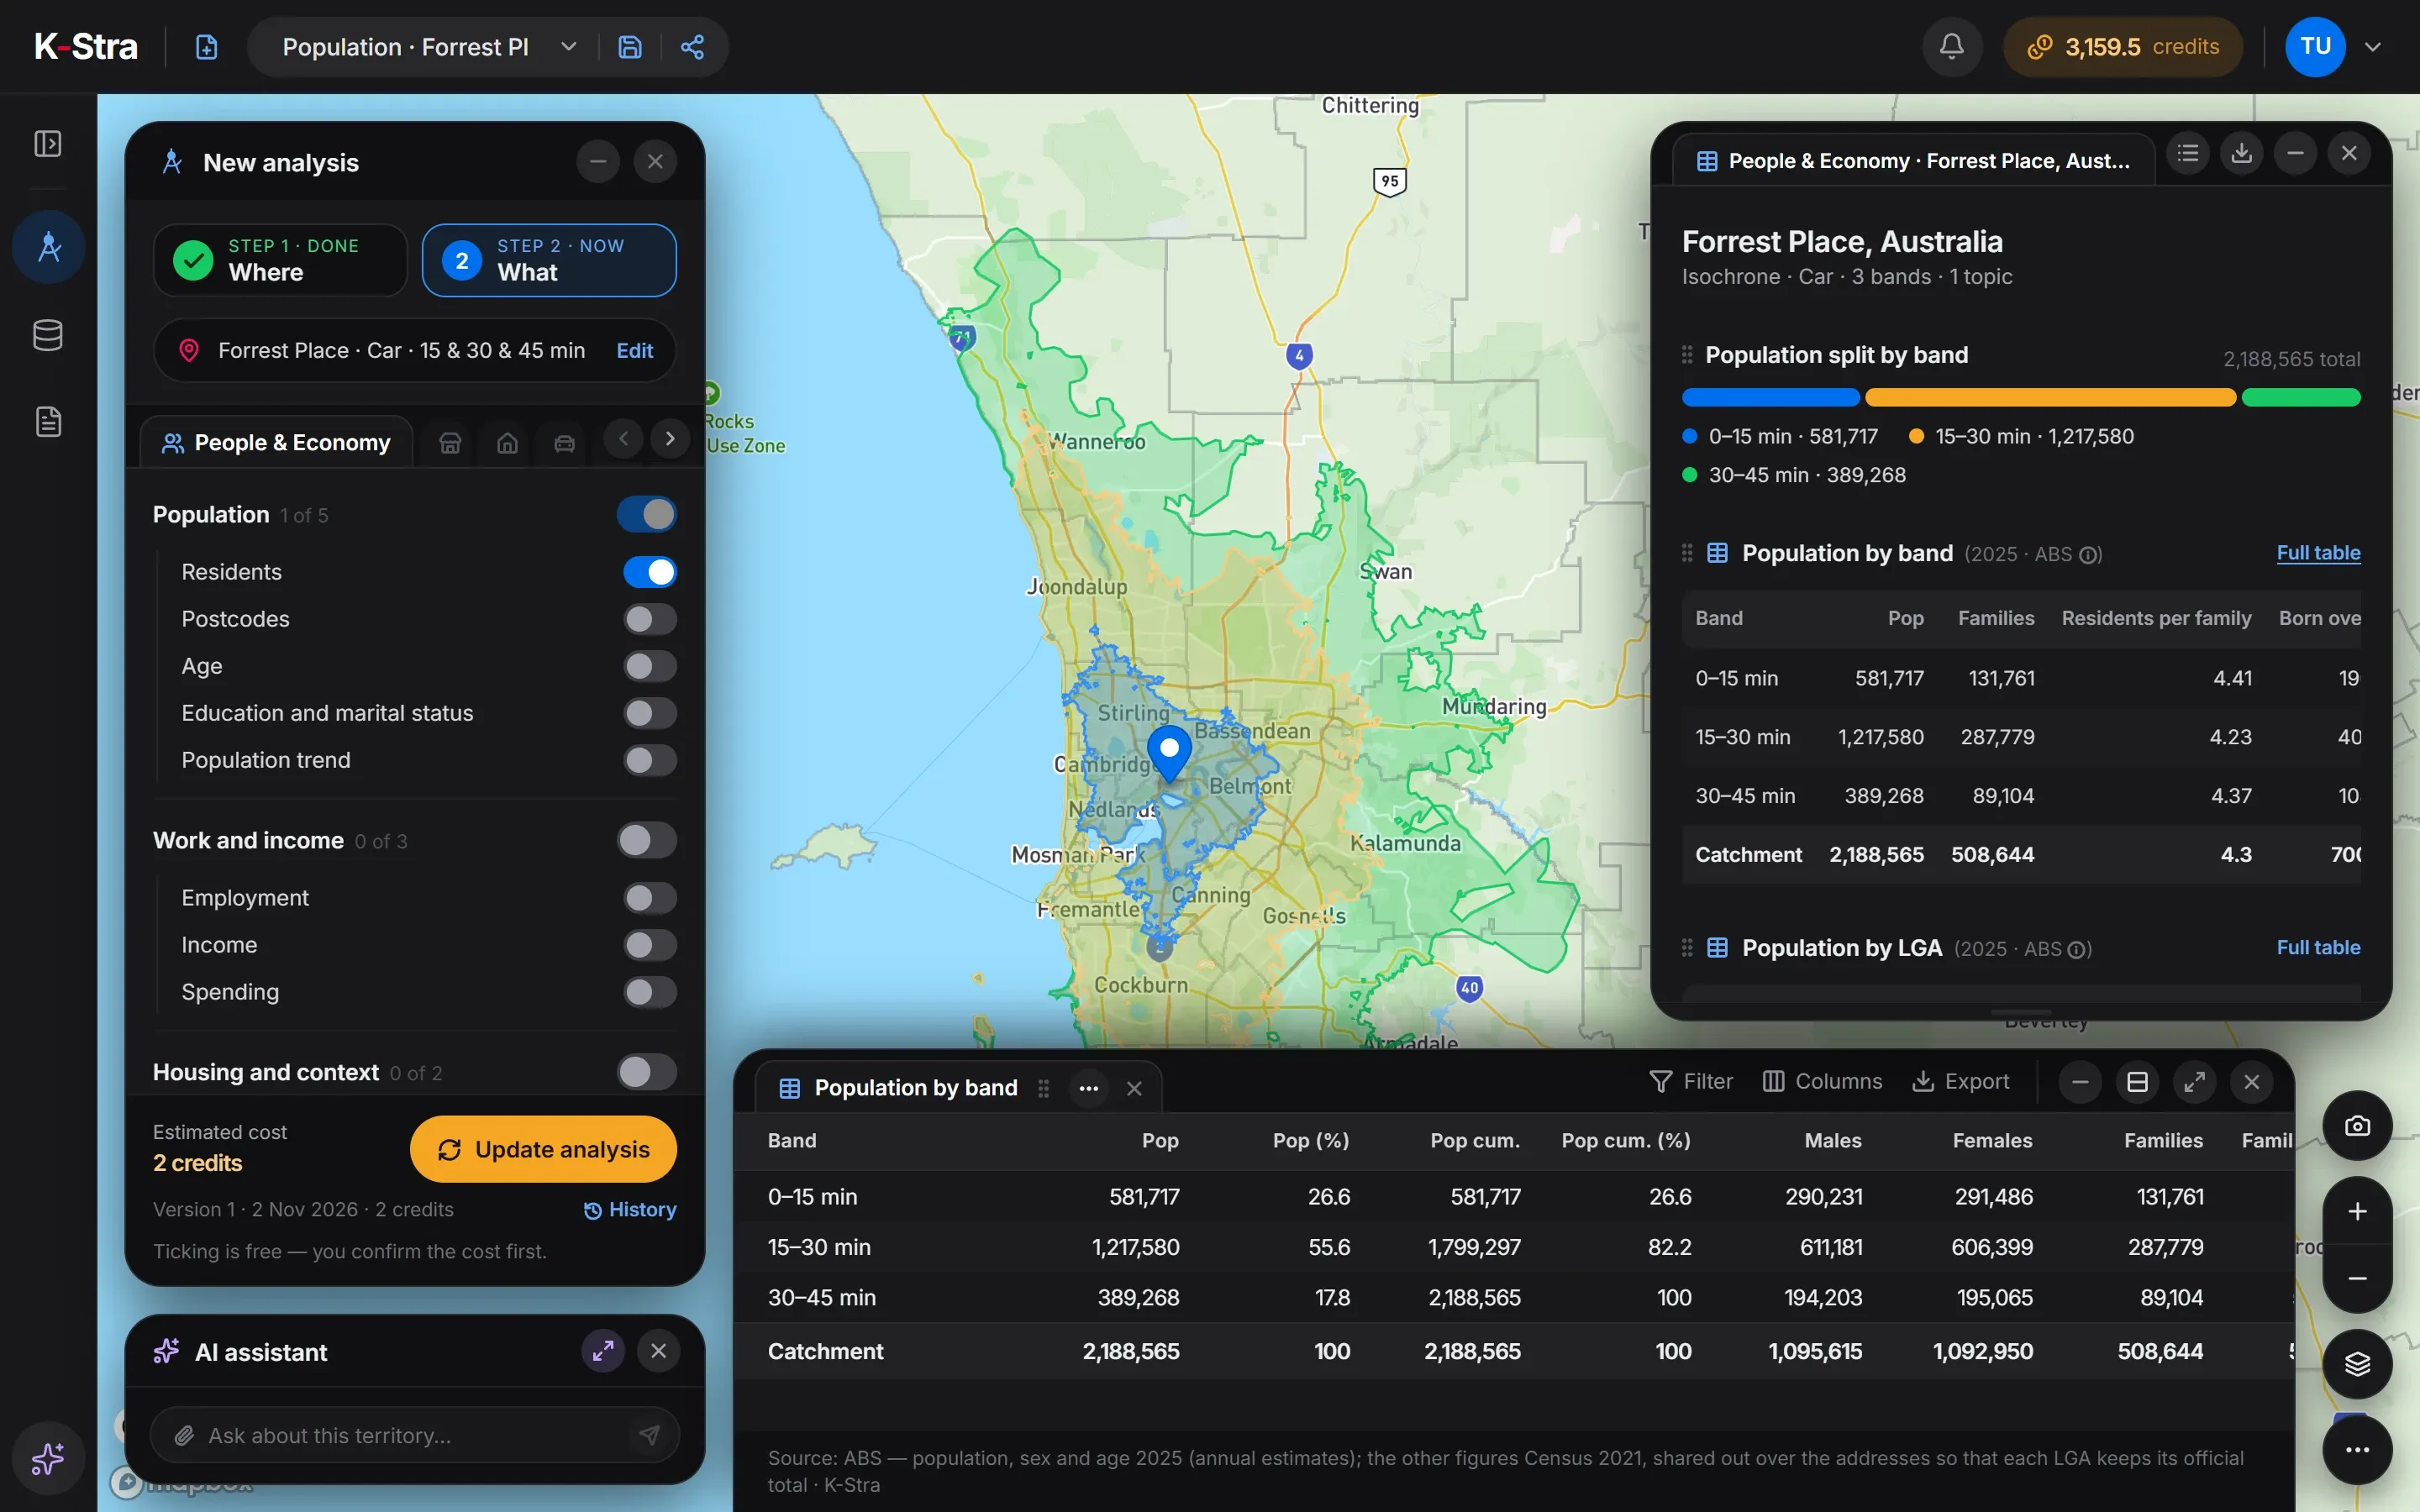 People & Economy · Perth
From Forrest Place, 581,717 people live within 15 minutes by car, 1,217,580 between 15 and 30 minutes and only 389,268 between 30 and 45. The 45-minute area covers 2,690 km² and 89.2% of Greater Perth.
The 15–30 minute band holds 55.6% of the total: the freeways along the coast bring the middle suburbs close in time. Rockingham, to the south, falls almost entirely in the outer band, with 70,098 of its residents between 30 and 45 minutes.
| Drive time | Residents | Cumulative |
|---|---|---|
| 0–15 min | 581,717 | 581,717 |
| 15–30 min | 1,217,580 | 1,799,297 |
| 30–45 min | 389,268 | 2,188,565 |
Source: K-Stra analysis of 2 November 2026, drive time by car in average traffic from Forrest Place; residents from ABS Estimated Resident Population at 30 June 2025, placed on address points.
How does Perth change with distance from the centre?
In a straight line, 632,752 people live within 10 kilometres of Forrest Place and 1,534,365 within 20. Flats are about half of the homes within 5 km, 51.5%, and only 10.2% between 5 and 10, far fewer than in the eastern capitals.
The income index stays above 105 in every ring, from 115.8 within 5 km to 107.3 between 30 and 50: unlike the eastern capitals, Perth has no low-income belt in its middle suburbs.
| Distance from Forrest Place | Residents | Within this distance | Income index | Median age | Flats (2021) | Rented (2021) |
|---|---|---|---|---|---|---|
| 0–5 km | 194,814 | 194,814 | 115.8 | 36.1 | 51.5% | 47.1% |
| 5–10 km | 437,938 | 632,752 | 109.6 | 37.6 | 10.2% | 36.2% |
| 10–20 km | 901,613 | 1,534,365 | 105.4 | 38.1 | 5.8% | 25.6% |
| 20–30 km | 414,792 | 1,949,157 | 109.9 | 36.2 | 2.2% | 21.5% |
| 30–50 km | 341,801 | 2,290,958 | 107.3 | 35.8 | 2.7% | 25.7% |
Straight-line rings counted by K-Stra on every address point, inside or outside the city boundary. Residents and age: ABS 2025; income index: ABS Personal Income 2022–23; flats and renting: ABS Census 2021.
What are the key figures for Greater Perth?
| Indicator | Greater Perth | WA | Australia |
|---|---|---|---|
| Residents, 30 June 2025 | 2,452,786 | 3,044,382 | 27,613,654 |
| Average yearly change, 2019–2025 | 2.72% | 2.41% | 1.50% |
| Area | 6,417 km² | 2,526,633 km² | 7,688,095 km² |
| Residents per km² | 382.3 | 1.2 | 3.6 |
| Median age | 37.4 | 37.9 | 38.5 |
| Aged under 15 | 17.8% | 17.9% | 17.4% |
| Aged 65 and over | 15.7% | 16.3% | 17.5% |
| Income index | 107.6 | 106.4 | 100.0 |
| Consumption index | 107.1 | 106.0 | 100.0 |
| Spending per resident, a year | A$56,330 | A$55,725 | A$52,582 |
| Resident spending, a year | A$138.2 billion | A$169.6 billion | A$1,452.0 billion |
| Families (Census 2021) | 570,107 | 703,116 | 6,730,182 |
| Homes rented (Census 2021) | 29.1% | 30.3% | 33.6% |
| Flats and apartments (Census 2021) | 10.6% | 8.9% | 19.6% |
Area: the Greater Capital City Statistical Area (ABS ASGS Edition 3). Residents counted by K-Stra on the address points inside it; yearly change: council estimates 2019–2025 weighted by the residents each council brings. Income index from ABS Personal Income 2022–23 (tax data), measured or estimated; consumption index derived from it; 100 = Australia. Spending per resident from the consumption index and ABS national accounts (5204.0) for 2024–25.
Which parts of Perth are largest, richest and youngest?
Perth – North West, from Scarborough to Joondalup and Wanneroo, is the most populous region, with 656,994 residents; the South East follows with 611,762. Perth – Inner has an income index of 119.7, the highest.
Mandurah, at the southern end of the metropolitan area, is the oldest region, with a median age of 44.3, and the only one with an income index below 100, 94.6.
| Region (SA4) | Residents 2025 | Median age | Income index | Flats (2021) |
|---|---|---|---|---|
| Perth – North West | 656,994 | 37.9 | 108.1 | 4.3% |
| Perth – South East | 611,762 | 36.0 | 103.7 | 7.9% |
| Perth – South West | 519,352 | 37.5 | 110.1 | 8.0% |
| Perth – North East | 324,566 | 37.0 | 107.0 | 4.7% |
| Perth – Inner | 212,572 | 36.7 | 119.7 | 47.0% |
| Mandurah | 127,540 | 44.3 | 94.6 | 3.3% |
Which Perth councils are growing fastest?
Serpentine-Jarrahdale grew 29.0% from 2019 to 2025, on average 4.84% a year and Kwinana 4.74% a year, in the south; Swan 4.31% in the north-east and Armadale 3.91% in the south-east. Stirling, with 254,821 residents, is the largest council.
Even the slowest councils of the metropolitan area grew by about 1.5% a year: Joondalup and Kalamunda at 1.47%, Mundaring at 1.55%. No Perth council lost residents.
| Council | Residents 2019 | Residents 2025 | Change a year | Median age | Income index |
|---|---|---|---|---|---|
| Stirling | 227,540 | 254,821 | 2.00% | 38.0 | 110.9 |
| Wanneroo | 208,263 | 246,147 | 3.03% | 35.7 | 104.4 |
| Swan | 148,672 | 187,090 | 4.31% | 35.1 | 106.3 |
| Joondalup | 162,308 | 176,595 | 1.47% | 41.1 | 111.0 |
| Rockingham | 135,440 | 159,934 | 3.01% | 36.3 | 108.6 |
| Gosnells | 127,017 | 144,475 | 2.29% | 36.2 | 96.7 |
| Cockburn | 115,577 | 139,499 | 3.45% | 36.8 | 113.1 |
| Melville | 104,340 | 115,945 | 1.85% | 41.3 | 109.7 |
| Serpentine-Jarrahdale | 31,410 | 40,531 | 4.84% | 33.6 | 113.3 |
| Kwinana | 44,700 | 57,422 | 4.74% | 33.8 | 108.7 |
| Perth | 28,214 | 35,673 | 4.41% | 33.1 | 102.6 |
| Armadale | 91,543 | 113,003 | 3.91% | 35.1 | 106.8 |
The eight largest councils mostly inside the city, then the fastest growing of those with more than 20,000 residents. Change on 2025 council boundaries; the average yearly change is the total change over the six years divided by six. Income index and median age are worked out from the addresses inside the city, so a council’s figure can differ slightly from the ABS figure for the whole council.
Which postcodes in Perth have the highest and lowest incomes?
The highest income indices are on the coast and in the inner west: 6015 City Beach (137.9), 6011 Cottesloe (137.4), 6016 Mount Hawthorn (133.7). The lowest is 6102 Bentley, by Curtin University, at 85.3.
That range is narrow: the lowest postcode in Perth sits far higher than the lowest in Sydney, Melbourne or Brisbane. The youngest postcodes are new estates at the edges — 6174 Golden Bay (30.4), 6038 Alkimos (31.3) — and the oldest is 6076 Lesmurdie, in the hills, at 47.0.
| Highest income index | Residents | Median age | Income index |
|---|---|---|---|
| 6015 City Beach | 7,615 | 46.1 | 137.9 |
| 6011 Cottesloe | 10,782 | 41.0 | 137.4 |
| 6016 Mount Hawthorn | 12,470 | 36.2 | 133.7 |
| 6007 West Leederville | 9,164 | 35.7 | 127.3 |
| 6008 Subiaco | 18,855 | 38.5 | 126.4 |
| Lowest income index | Residents | Median age | Income index |
|---|---|---|---|
| 6102 Bentley (WA) | 15,998 | 31.9 | 85.3 |
| 6064 Marangaroo | 37,210 | 38.1 | 89.9 |
| 6061 Balga | 47,055 | 34.1 | 91.9 |
| 6107 Beckenham | 55,363 | 32.8 | 92.2 |
| 6109 Maddington | 15,109 | 35.7 | 92.8 |
ABS postal areas with more than 5,000 residents inside the city, named after their most populous suburb; the part of each postcode inside the city boundary only. Income index: ABS personal income tax data for 2022–23, measured for councils and SA2 areas and estimated elsewhere; a postcode is the average of its addresses, weighted by residents, so it can differ from the council that contains it.
How much do residents of Perth spend, and how many businesses serve them?
Greater Perth has fewer hairdressers per 10,000 residents than any of the other five cities, 8.28, and fewer restaurants (10.69) and supermarkets (2.35) than Sydney, Melbourne or Adelaide, while its residents spend the most per head. More resident spending for each outlet is consistent with larger stores, or with room for more.
| Category | Per resident | Total (A$ million) |
|---|---|---|
| Food and non-alcoholic beverages | A$5,174 | 12,691 |
| Alcoholic beverages, tobacco and narcotics | A$1,568 | 3,846 |
| Clothing and footwear | A$1,938 | 4,753 |
| Housing, water, electricity, gas and other fuels | A$13,529 | 33,184 |
| Furnishings, household equipment and routine household maintenance | A$2,482 | 6,088 |
| Health | A$4,130 | 10,130 |
| Transport | A$5,967 | 14,636 |
| Information and communication | A$1,021 | 2,504 |
| Recreation, sport and culture | A$5,900 | 14,471 |
| Education services | A$2,093 | 5,134 |
| Restaurants and accommodation services | A$4,918 | 12,063 |
| Insurance and financial services | A$4,459 | 10,937 |
| Personal care, social protection and miscellaneous goods and services | A$3,151 | 7,729 |
| All categories | A$56,330 | 138,165 |
| Per 10,000 residents | Perth | WA | Australia |
|---|---|---|---|
| Supermarkets | 2.35 | 2.72 | 2.92 |
| Pharmacies | 2.53 | 2.64 | 2.63 |
| Gyms & fitness centers | 6.47 | 6.82 | 7.06 |
| Bars & cafés | 9.72 | 11.03 | 12.00 |
| Restaurants | 10.69 | 10.82 | 12.17 |
| Hairdressers | 8.28 | 8.06 | 9.31 |
| Childcare & early learning | 4.80 | 4.63 | 5.24 |
| Aged care & retirement living | 2.41 | 2.43 | 2.50 |
| Fuel stations | 2.13 | 4.27 | 3.74 |
| Real estate agencies | 4.24 | 4.24 | 5.34 |
| Hotels & accommodation | 4.62 | 12.33 | 15.11 |
Spending per resident from the consumption index and ABS national accounts (5204.0) for 2024–25; residents only, visitors not included. K-Stra places catalogue, October 2026, as the app classifies each business; residents at 30 June 2025.
What does this mean for choosing a location in Perth?
High spending, fast growth and a narrow income range make Perth an easier market to read than Sydney: a site in an average suburb is not far from the city average, and most of the city is a car-based market of houses.
Growth comes from both ends of a long coastal corridor, where the new estates are young and shops and services follow the houses. A site there is a bet on timing as well as on place.
Fewer outlets per resident with the highest spending per resident means more resident spending for each outlet on average. The catchment of a specific site shows whether the competitors nearby already take it; visitors and workers are not in these figures.
What else do people ask about Perth?
What is the population of Perth?
Greater Perth had 2,452,786 residents at 30 June 2025 (estimated from ABS council figures), 80.6% of Western Australia. The City of Perth council, which covers only the centre, had 35,673.
Is Perth the fastest-growing capital city in Australia?
Among the large capitals, yes: Greater Perth grew on average about 2.72% a year from 2019 to 2025 (about 16.3% in all), against 2.22% for Greater Brisbane, 1.56% for Greater Melbourne and 1.30% for Greater Sydney, on council estimates weighted by residents.
Which Perth postcodes have the highest incomes?
By income index, 6015 City Beach, 6011 Cottesloe, 6016 Mount Hawthorn, 6007 West Leederville and 6008 Subiaco, among postcodes with more than 5,000 residents.
Draw your catchment
in Perth.
The app opens on Perth with drive bands of 15, 30 and 45 minutes ready: type an address and see who lives within reach.
Open the app — free to exploreDrawing an area is free; you pay only for the analyses you run