
How do I choose a location for a service station or car business?
Car businesses serve two kinds of customer: the people who live nearby and the people driving through. Here is how to measure the first, and how to allow for the second. The worked example is a fuel station in Tamworth; the same method applies to car washes, garages, dealerships and auto parts.
Choose a service station or car business location by counting the residents and the cars within a ten-minute drive, then the fuel stations, workshops or car washes already serving them, per 10,000 residents against the council, the state and Australia. Highway towns carry far more stations than their residents explain, because travellers fill up there too.
Which automotive businesses does K-Stra map?
K-Stra splits automotive into seven sectors: car dealerships, garages and repair shops, car washes, service areas, fuel stations, EV charging and auto parts. Each has its own share of ABS household spending on vehicles and fuel, and its own reach.
Garages and repair shops are the largest, with 27,733 locations — more than fuel stations and car dealers put together. EV charging is listed with its locations but cannot yet be analysed as a sector.
| Sector in the app | Locations | What it counts |
|---|---|---|
| Car dealerships | 7,314 | New and used car dealerships. |
| Garages & repair shops | 27,733 | Mechanics, repair shops, tyre and body shops. |
| Car washes | 5,629 | Car washes and detailing. |
| Service areas | 900 | Motorway and highway service areas. |
| Fuel stations | 10,335 | Fuel stations, chains and independents. |
| EV charging stations | 1,029 | Public EV charging stations. Listed, not yet analysable. |
| Auto parts & accessories | 5,313 | Auto parts and accessories stores. |
Source: the Automotive & Mobility group in the sector list of the K-Stra app on 1 November 2026, with the names the app uses; business catalogue of 23 October 2026, built from public online business listings. The counts here are the whole catalogue, as on the Australia pages; the national figure in the per 10,000 table of the example below counts only the locations K-Stra can place on an Australian address, so it can be a few places lower, which moves its rate by at most a hundredth.
Which numbers matter most for a car business?
Residents and cars within reach
The K-Stra model measures fuel stations on a 10-minute drive. Residents are the regular customers; the number of cars per household says how many tanks there are to fill.
In the app: the Where step, and People & Economy, Housing, for cars per dwelling.
Spending on fuel and vehicles
Residents of the Tamworth example spend about A$1,097 a head a year on what fuel stations sell, from ABS household spending for 2024–25.
In the app: the Demand map and its table of resident spending by band.
Stations per 10,000 residents
Australia has 3.74. A highway or regional service town sits far above it because travellers and farms from the district fill up there; a commuter suburb can sit well below.
In the app: the density table: catchment, council, state and Australia side by side.
Traffic the model does not see
Passing traffic is not in the model. Read the numbers of a highway site next to its position on the map: on the main road out of town, the market is bigger than the residents.
In the app: the map itself, with the road network and the stations on it.
Market gap and good neighbours
Where spending within reach is high against the stations already there, the market gap rises above 100. Fast food, convenience stores and supermarkets nearby add reasons to stop.
In the app: the Market gap map, the best locations and the neighbouring categories option.
What data do you need to assess a car business site?
Stations, workshops, residents, cars and spending, already loaded. Nothing needs uploading.
Every automotive business
10,335 fuel stations and six more automotive sectors, with category, rating and reviews, from public online business listings.
Business and competition dataCars per dwelling
Dwellings with no car, one, two, and three or more, from the ABS Census 2021.
Housing dataSpending on vehicles and fuel
Household spending from the ABS national accounts for 2024–25, assigned to each automotive sector.
Work, income and spendingThe road network
Drive times along real roads, with or without motorways, in average or heavy traffic.
How the engine works
How do you analyse a car business site in K-Stra?
Type the address, keep a 10-minute drive, open Markets & Brands and pick Fuel stations — or Car washes, Garages, Car dealerships, Auto parts — as a whole sector.
- WhereThe address and a drive time, with or without motorways. The size of the area does not change the price.
- WhatMarkets & Brands, whole sector, the automotive sector you work in, with estimated sales switched on for fuel and parts.
- ReadDemand, competition and market gap on the map, every business in a table, and five best locations.
What does a fuel station analysis show?
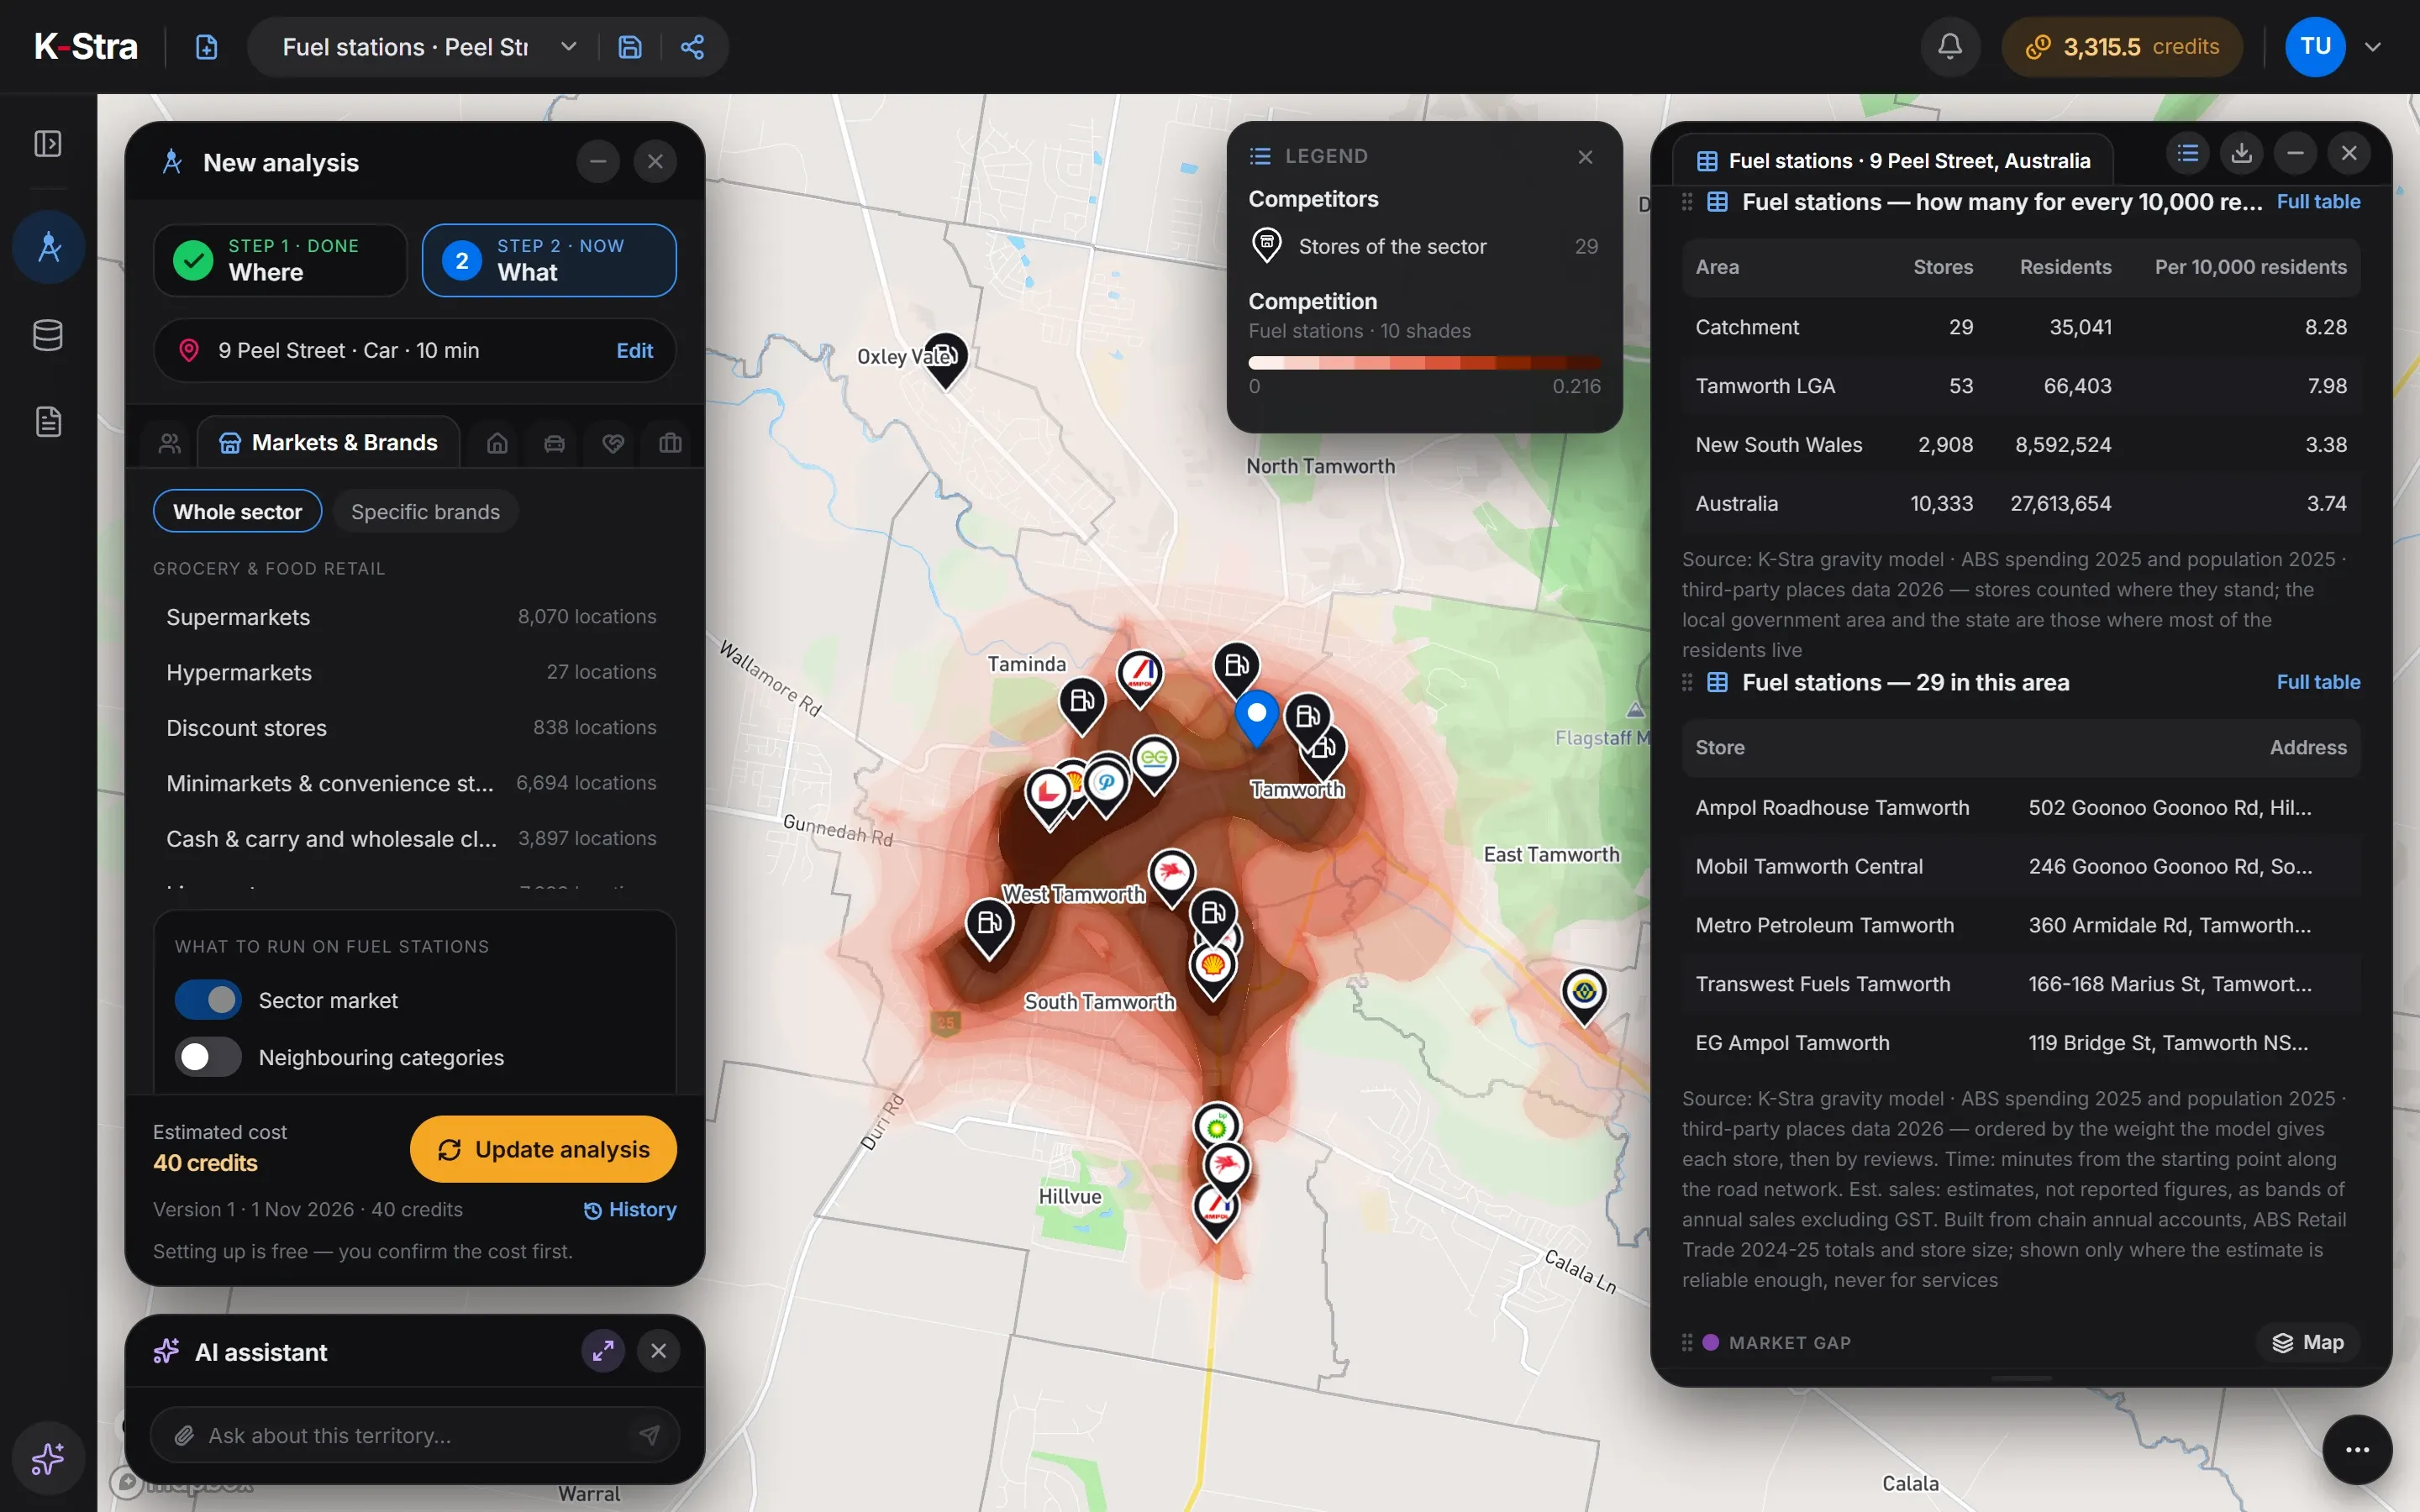
Fuel stations within 10 minutes by car of 9 Peel Street, Tamworth NSW: 29 stations for 35,041 residents, 8.28 per 10,000 — 2.2 times the Australian 3.74. 3 of them show an estimated annual sales band, A$0.5–1M, with its confidence; the other 26 have no visible estimate. These are estimates, not reported figures.
| Area | Stations | Residents | Per 10,000 residents |
|---|---|---|---|
| Catchment | 29 | 35,041 | 8.28 |
| Tamworth (council) | 53 | 66,403 | 7.98 |
| New South Wales | 2,908 | 8,592,524 | 3.38 |
| Australia | 10,333 | 27,613,654 | 3.74 |
Sources: K-Stra analysis of 1 November 2026: fuel stations within a 10-minute drive in average traffic of 9 Peel Street, Tamworth. Businesses: K-Stra places catalogue, October 2026. Residents: ABS population estimates at 30 June 2025. Spending: ABS national accounts, 2024–25. Estimated annual sales: estimates, not reported figures.
Why does Tamworth have so many fuel stations?
Most likely because it sells fuel to far more people than live there. The Tamworth council area as a whole has 7.98 stations per 10,000 residents, more than twice New South Wales at 3.38: Tamworth is where highways meet and where a farming district comes to town. None of that traffic is in a resident-based model.
Within the town, the market gap still separates good sites from crowded ones. The highest are in North Tamworth, near 11 Oliver Street, North Tamworth, at 177; and 168 Johnston Street, North Tamworth, at 163, against 100 for the typical spot.
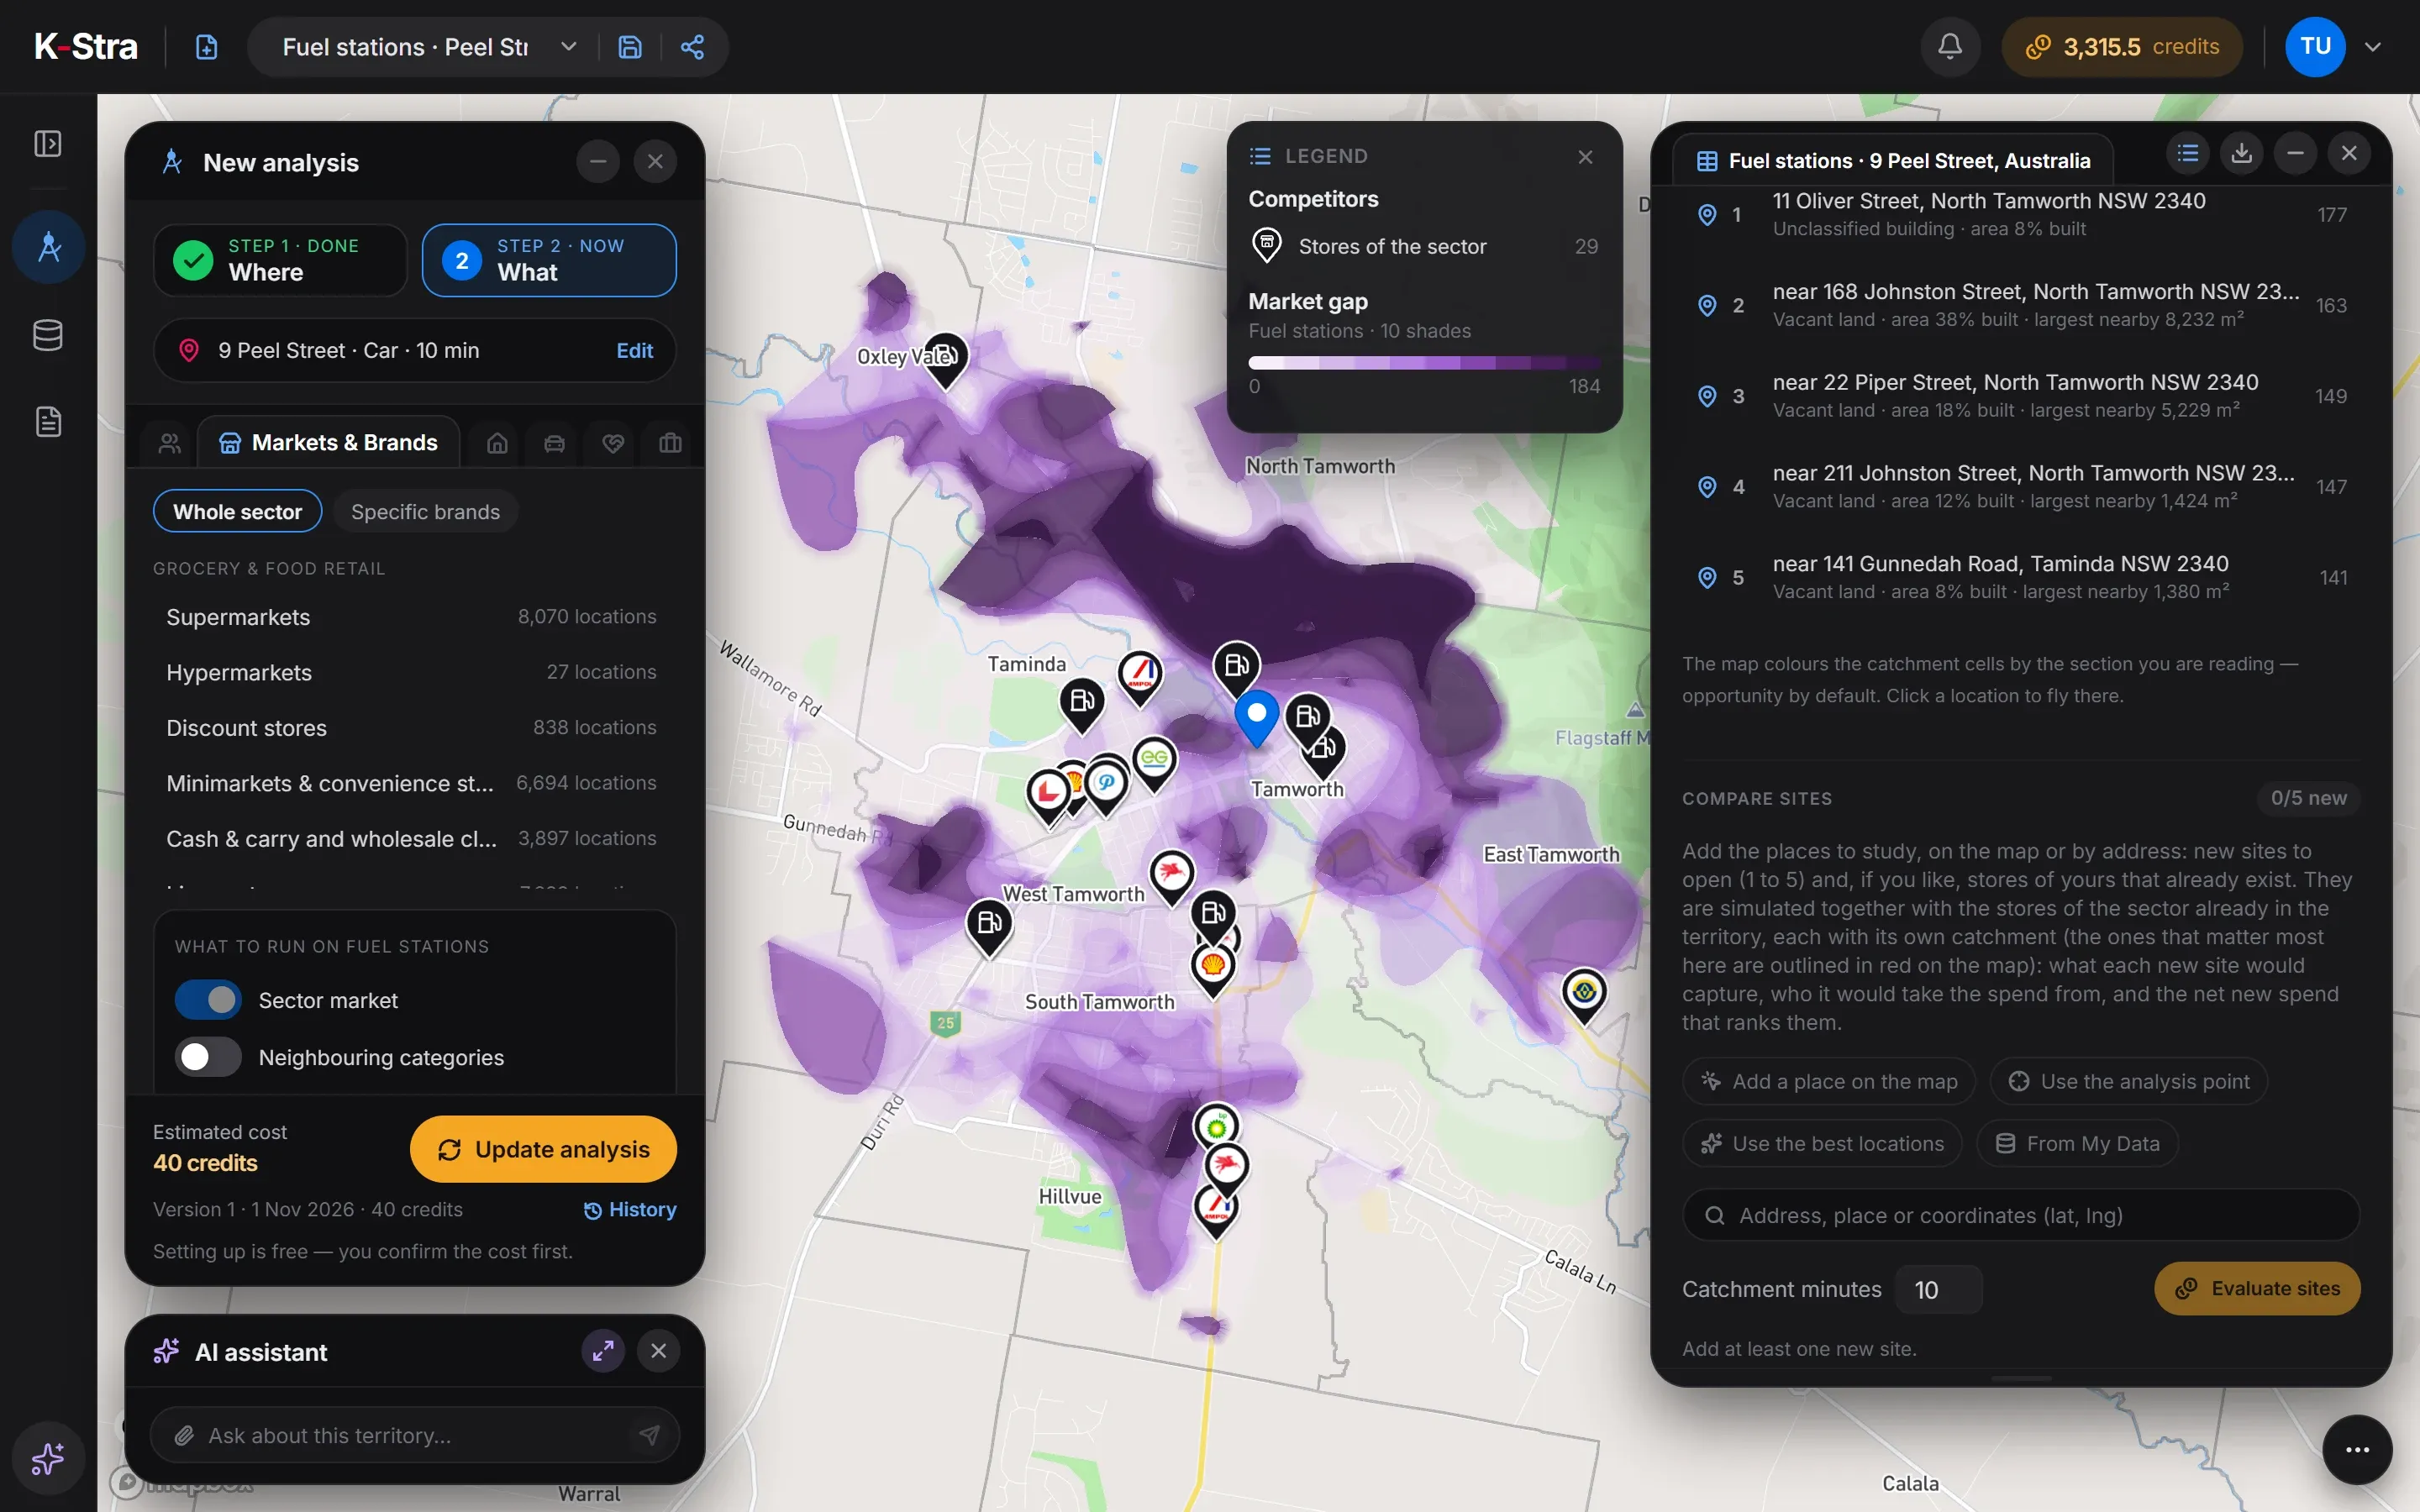 Market gap · Tamworth
How much does a car business analysis cost?
The Tamworth example cost 40 credits. A whole region costs the same: you pay for the sector, not the size of the area.
- Markets & Brands, one automotive sectorper sector, any area40 credits
- Estimated annual sales of the stationsFree for nowFree
- Maps, tables and exports of the resultsFree
- Total= 40 credits
- ≈ A$61 at the Single report pack rate of A$1.53 a credit; less with larger packs and monthly plans. A new free account’s 40 welcome credits cover it.
Optional, not in the total
- Neighbouring categoriesper set+ 2 credits
- Compare candidate sitesper candidate site+ 20 credits
The estimate appears before the run starts, and a run that fails costs nothing.
What do people opening a car business ask next?
Which of my candidate sites is stronger?
Run the same model on one to five addresses and compare the residents’ spending each could capture, and from which stations. It counts residents’ spending only, so use it to compare sites in the same sector and area: the absolute value is an order of magnitude, and workers, commuters, tourists and passing trade are not in it.
Retail site selectionWhich of my sites should stay open?
Rank sites by the residents each covers alone, and candidates by the new residents they add.
Store network planningHow do I draw dealer territories?
Territories with a similar number of residents for every dealer or franchisee, within a reasonable drive.
Franchise territory planning
What else do people ask about car business locations?
Does K-Stra count the traffic passing a fuel station?
No. Demand comes from the spending of residents within reach. Travellers, freight and passing traffic are not in it, so stations on highways, at service areas and on the edge of towns come out lower than they really are. Use the numbers to compare similar sites, not as a volume of sales.
How many fuel stations are there per resident in Australia?
10,333 fuel station locations for 27,613,654 residents: 3.74 per 10,000, in the K-Stra catalogue of October 2026. Service areas on motorways are a separate sector.
Can I analyse EV charging stations?
EV charging stations are in the sector list with their locations, but not yet analysable: their demand has not been calculated yet. Until it is, they cannot be run as a sector.
Does K-Stra show the estimated annual sales of competing stations?
For the stations the model can estimate, as a band with its confidence, never as a figure: they are estimates, not reported figures. In the Tamworth example, run on 1 November 2026, when only high and medium estimates were shown, 3 of 29 stations showed one, all in the A$0.5–1M band, and the other 26 had none; workshops, car washes and other services never have an estimate.
Can I see how many cars households have?
Yes. The Housing topic of People & Economy counts dwellings with no car, one, two, and three or more, from the ABS Census 2021, for 2 credits.
See the stations
around your site.
Type an address, pick your automotive sector and read residents, competition and the gaps on one map.
Open the app — free to exploreEstimated sales are free for now; you pay only for the analyses you run